Getting Transit (Mostly) Right: Minneapolis-Saint Paul edition

Minneapolis and Saint Paul do not necessarily lend themselves to being a transit paradise. The core of the region is not particularly dense, and wide roads and a mostly-built freeway system make driving too easy. The tree-lined avenues of Minneapolis and Saint Paul are mostly lined by single-family homes and duplexes with sizable yards and alleyways, meaning that population densities are far less than the three-deckers of Boston, side-by-side bungalows of Chicago and row houses of DC, so there are fewer people to provide the necessary patronage for a dense network of frequent transit lines. The factors that push people to transit that define the urban experience in a Boston, New York or DC—heavy congestion and high parking costs—are, if not completely absent, less of an issue. And without many grade-separated lines, there are few cases where transit has a distinct time advantage over rush hour traffic.

Additionally, much of the area is pockmarked by both active and abandoned industry and transportation networks, further diluting the population (while, at the same time, providing significant potential for brownfield redevelopment). Most in-city residents live within a short walk of a bus line (the suburbs, for the most part, are less dense and even more car-dependent), but frequencies are often only every 20 or 30 minutes. Since the demise of the streetcar network (most car lines ran every 10 or 12 minutes or better, and streetcar ridership peaked at 238 million per year, triple transit ridership today) and the rise of the highways in the 1950s and 1960s, driving has just been to easy to compete with transit. Even at its peak, Minneapolis had just under 10,000 people per square mile, Saint Paul only 6,000; neither reached the peak density of large rust belt cities further east. (Both cities saw their populations bottom out in 1990 and have gained about 10% since.)

Minneapolis-Saint Paul was one of the largest cities without rail transit until its first line opened in 2004—a 12 mile line for a cost, in current dollars, $905 million (including two major elevated overpasses and a mile-long tunnel under the airport, despite exceeding initial estimates it is, in retrospect, quite cheap.)—and the second corridor, linking Minneapolis and Saint Paul, came online in 2014. These two corridors have, in their own right, made Minneapolis’s “Metro” the most heavily-used rail system to have been inaugurated since 2000 (since surpassed by Seattle’s Link, which is experiencing overcrowding with its recent extension), with more than 60,000 passengers per day. But there are two new smaller-scale developments which show that the Twin Cities are more forward-thinking in providing transit, and may well entice passengers out of cars while providing transit along corridors with high potential for redevelopment.

The first is the speeding up of the Green Line (formerly the Central Corridor) between Minneapolis and Saint Paul. When it first opened, the signal system of the line was not optimized for transit: trains often waited at cross streets for vehicular traffic despite the promise of transit signal priority. While the line is not perfected in the way that the Blue Line, which has gated, at-speed grade crossings, operates (and, running in the center of a city street, it likely never will be) the kinks are being worked out, and the promise of a 39-minute downtown-to-downtown ride is coming to fruition (the downtown sections are still quite slow and trains have minimal signal priority there). Speeds have also been improved, to 40 mph between most stations and 50 where there are no cross streets for long distances. (Note that this center-running light rail line runs faster than any MBTA subway or light rail service.) Further progress may be made, but the cities have not kowtowed to a few delayed drivers, and reaped both the operational efficiencies of running trains faster, as well as the potential for higher ridership. Trains run just every ten minutes, but with three 100-foot-long railcars, they have a capacity of more than 500 passengers each.

The second is the upcoming A Line bus rapid transit route in (mostly) Saint Paul. While not true BRT—there are few, if any, protected lanes, and the efficacy of transit signal priority will have to be tested—it’s the right steps towards getting more riders on to buses, and then on to trains beyond. The 84 has long been an important crosstown route running north-south between Minneapolis and Saint Paul. It connects the Green Line at Snelling Avenue with the Blue Line at 46th Street in Minneapolis, and with the rail lines has acted as a major feeder route to the two lines, albeit an urban bus route with frequent stops, often picking up just one or two passengers at each due to the density of the area, slowing down the route.
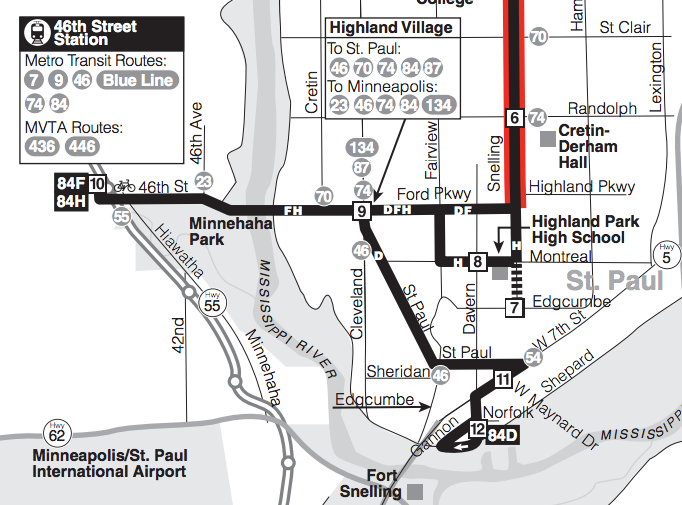
The new A Line will eliminate the Montreal joggle, a vestige
from the pre-light rail routing of the line.

Beyond this, it has had its share of issues. It has long been a frequent route—every fifteen minutes for the trunk service—but service was downgraded in 2004 when the direct trip to the airport and Mall of America was severed and required a transfer to the Blue Line. Additionally, until recently, only every other trip made the airport run, meaning service to the rail line was only available every 30 minutes, a major transfer penalty, especially changing from rail to bus. The other branch of the route dead-ended at the 54 bus, which also ran to the airport, but with less frequency (every 15 minutes) and without the passenger amenities at the transfer point. Furthermore, the line had several twists and turns. Before 2004, it made several jogs through Saint Paul en route to the airport. In the past decade, most buses serving the light rail have detoured half a mile south of the straight east-west route to the rail transfer station, providing some additional coverage but adding several minutes of extra travel time to each trip. When there are few advantages to bus travel in the first place, once a route goes out of its way in this manner, driving becomes even more logical.
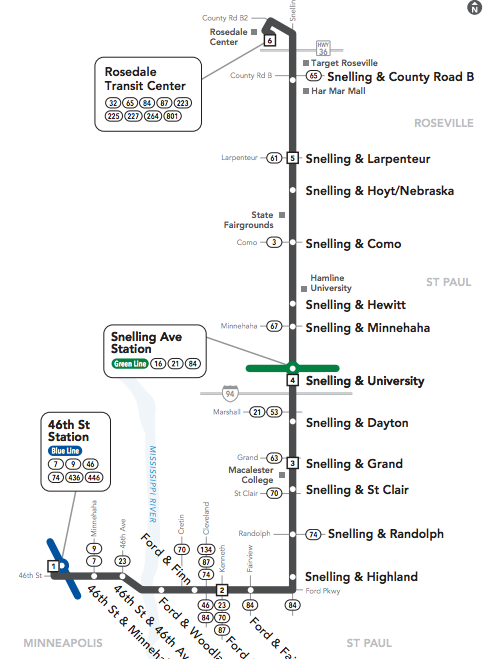
No joggles! The new A Line will follow
the city street grid: the most direct route.

The new A Line BRT route will eliminate many of the factors which make driving more desirable in this corridor. First, stops will be consolidated, from eight or ten per mile to two or three, mostly at major nodes, bus transfers and “100% corners” which developed around these streetcar transfer points in the first half of the 20th century (the term has since been applied to highway interchanges in suburbia and transit transfer stations downtown). Each stop will be more developed, with heftier shelters with heating elements (important in Minnesota winters) and real-time departure information (important for everyone, but especially choice riders). Each station will have a fare machine and provide off-board fare collection, distinct vehicles with wider doors, and all-door, level boarding to minimize dwell times. Furthermore, buses will stop in the right travel lane, at a curb bump-out, so buses will not waste time pulling in and out of travel lanes. This will all enhance the speed of the route and the customer experience, and an analysis shows that it will bring many jobs closer to residents of the corridor.

Frequency will increase as well, with 10 minute headways matching headways of the light rail lines (frequency had been increased in 2014 to this level when the Blue Line opened, but not all buses ran to the Blue Line in Minneapolis), so transfers between the two lines will be minimal. Very importantly, these won’t just be rush-hour frequencies, but for midday service seven days per week (shoulder periods—before 6 a.m. weekdays, slightly later on weekends, and after 7:30 p.m. on weekdays and slightly later on weekends—will be somewhat less frequent, but still generally every 15 or 20 minutes). And the hodgepodge of coverage-based joggles will be eliminated: an every-half-hour 84 route will provide this coverage service, but the every-ten-minutes A Line will follow the grid to a T—or, as it happens, a backwards “L”—taking the most direct route possible. (The 84 will also provide service every block along Snelling Avenue, continuing a fallacy among many transit agencies that stops can not be consolidated at any cost. Thus some operational efficiencies will be lost by having empty buses running along the route, as nearly all passengers will opt for the faster and more frequent A Line. Even with stations every half mile along the Blue Line, MetroTransit still runs the 16 bus along the route, making these frequent stops. Based on limited observations, there are few, if any, riders, and it may behoove the agency to take whatever constituent hits are involved in putting this type of service out of its misery.)
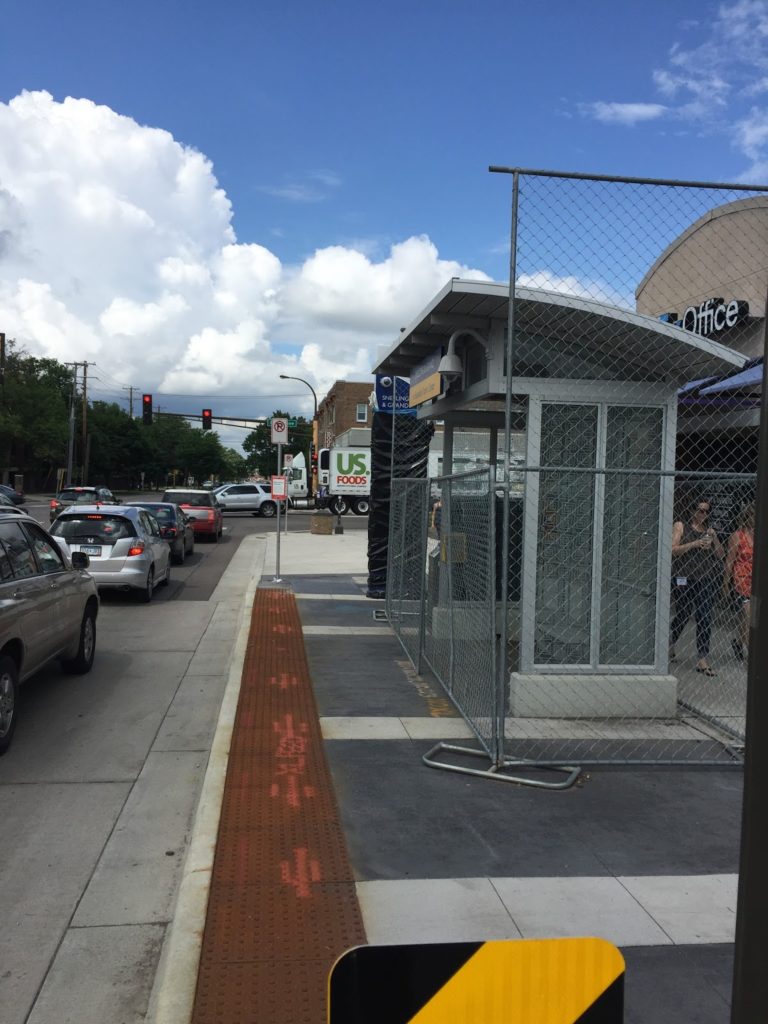
New stations feature curb bump-outs so buses
board in regular traffic lanes.

Is it perfect? Certainly not. Buses will still be susceptible to congestion, especially in the crowded Midway area, where exclusive bus lanes may be a future improvement. But it’s a major improvement, and for (relatively) minor dollars. Rather than a showy BRT or rail system (the corridor is probably not dense enough for rail, and doesn’t have the traffic issues that would require a full-on, expensive BRT system) the new A Line seems to address the most salient issues with a cost-benefit analysis, with low-cost, high-impact solutions (what they call Arterial BRT). It can also be incremental; if it’s successful, it will give the political capital to make further improvements, which may mean taking car travel lanes or parking spaces for queue jump lanes of exclusive bus facilities. It will leverage the much-improved Green Line light rail connecting to the downtowns with a better connection from the Snelling corridor, and the Blue Line at the other end. This system did not have free-falling ridership that would require a Houston-level redesign (bus ridership has grown in recent years, even as a major corridor—University Avenue—was replaced by light rail), but certain corridors—like the 84—did need improvement (others still do). This is a model which should be used for other high-use corridors in the Twin Cities (which is planned), and other systems in the US as well.

I started riding the 84 in 2002 (it still carried a note that it had been renamed from the Saint Paul 4—until 2000 Minneapolis and Saint Paul parochially had duplicate route numbers in different cities, like boroughs in New York) as a first year student at Macalester College, frequently to and from the airport. It ran every half hour, but with direct service it made the terminal impressively close: even with the joggles in the route, it was less than a 20 minute ride, door-to-door. The actually service degraded in 2004 with the rail transfer: it usually took about 30 or even 35 minutes, especially with the extra trip down to Montreal Avenue, and still only every half hour.

It took ten years, but a sensible route has finally been worked out. While the new service won’t match the speed of the pre-2004 service, with a more direct route, fewer stops and 10 minute headways for both the bus and the light rail, the trip, even with a transfer, should take about 25 minutes (with a perfect transfer at non-peak times, it may actually beat the circa-2004 20-minute mark), with the bus running up to 25% faster. Considering it will come three times as often, it will (finally) take full advantage of the light rail, and provide better service to the Snelling corridor in Saint Paul. Hopefully residents will notice the improvements and avail themselves of better transit options, even if it’s never perfectly competitive with an automobile.

Update: so far people are mostly happy with it, with one curmudgeon who won’t walk the extra block to a stop in the winter, supposedly. Update 2: Ridership on the corridor is up 25%.

How much does BRT cost? 7X less than LRT? (Hint: No.)

This is the third in a series about the ITDP bus rapid transit report for Boston, and the ITDP standard in general.

One of the claims often made by BRT propagandists is that constructing bus rapid transit is seven times cheaper than light rail transit.

This is from the executive summary of the ITDP’s Boston BRT report:

Analysis of recent transit development costs
in the United States suggests that implementing BRT in these
corridors would also be more cost-effective than other options
for improving the existing transportation system. Based on this
evidence, on average, BRT can be seven times more affordable
per mile implemented than light rail.

Their “Benefits of BRT” page repeats this factoid several times. Quite a ways down the page do they use some properly weasely language to qualify their statement: “BRT can on average be up to seven times more affordable than light rail.” (Italics mine.) Hey, guys? That’s now how averages work. An average is the sum of a set of numbers, divided by the total number in the set. It’s like saying “In February, Boston gets, on average, up to 65 inches of snow.” Boston must be a snowy place, a reader would say, since some there must be a lot of years that have more snow than that. Except “up to” denotes an outlier. Boston normally gets, in average, about 12 inches of snow in February. 65 inches is an outlier. The ITDP report is off by about the same factor.

If this seven-times-as-expensive figure were the case—especially in corridors where demand is not likely to exceed 2500 passengers per hour—then it would make a lot of sense to build, right? If you can get 25 miles of BRT for the price of four miles of light rail, it’s a no-brainer. But what about if you can get nine miles of BRT for the price of four miles of light rail? Because that’s the actual ratio: light rail comes in at slightly more than twice the cost. And the while the ITDP bandies about that number, they cite no actual evidence to back it up.

Given the capacity constraints of bus rapid transit, it becomes a harder choice: if you spend half the cost of light rail on a bus system that doesn’t have the capacity to serve the needs of the corridor, it’s wasted money. It becomes a sort of Yogi Berra white elephant: no one goes there anymore, it’s too crowded. Crowds seem like success, and they are, to a point. But overcrowded transit runs more slowly and is more prone to uneven headways. In other words, if you build it, and they come, then what?

* Planned for ~2020. Ridership includes 38, 38R, 38AX, 38BX
† Included significant grade separation/bridges/tunneling
‡ Primarily in an existing right-of-way
All dollar figures adjusted for inflation (2015)

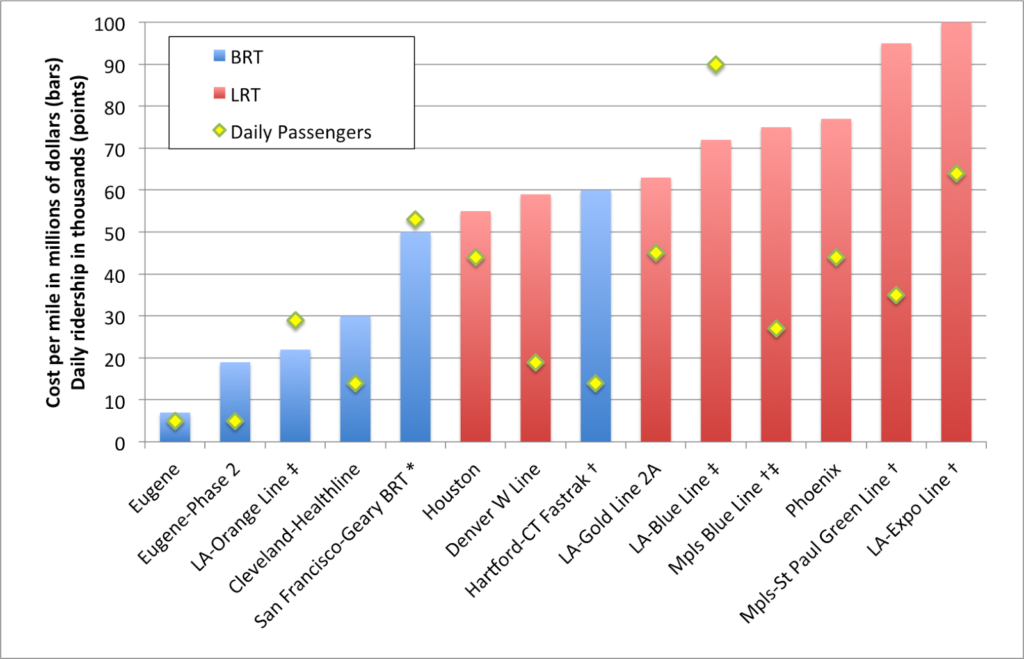
I like charts (you’ll know that if you’re a frequent reader) and here is one. It shows the costs per mile, and daily ridership, for a variety of BRT and LRT projects which have been built recently. I included several Los Angeles LRT examples because it is the only city which has built both BRT (to the level of an ITDP standard) and LRT in that time, and included the much older (relatively) Blue Line because it was mostly built on an old Pacific Electric right-of-way, much like the BRT Orange Line. Is light rail more expensive to construct than bus rapid transit? Yes. Is it seven times more expensive? Certainly not. The distance-weighted average construction cost for light rail is about 225% higher than BRT, less than a third of the difference that the ITDP suggests. (I’ve left out rail examples here—the Central Link in Seattle, for example—which include significant tunneling or grade separation, and similar BRT systems.)

There is only one example of BRT construction which is seven times less expensive than any similar light rail line: the Emerald Express in Eugene, Oregon.

Eugene, Oregon The Emerald Express was cheap to build: but you get what you pay for. The line serves a transit system which has a daily ridership of 40,000; fewer than most of the light rail lines above. It runs every ten minutes—frequent by the standards of a small town—but will require significant more investment to go any faster. Why? Because many of its exclusive lanes are bidirectional: a bus may have to wait for a vehicle going the other way to clear. It’s like a single-track railroad with passing loops for buses. And the stations are not what you’d see in Bogota: here is one along a less populated stretch of the route. This is not to say that there’s anything wrong with the Emerald Express—it is good for the community it serves. But that type of infrastructure would be overwhelmed on opening day in Boston.

Oh, also: the second leg of the Emerald Express—with similar BRT features—is coming in a bit higher: $19 million per mile. So the one-seventh number? It’s pretty selective.

Los Angeles Then there’s the Orange Line in LA. It is certainly successful, relative to an unused corridor, anyway. It runs every four minutes and carries 30,000 passengers per day. It’s basically at capacity. It cost $27 million per mile to build initially (but the recent extension was more than $50 million per mile), and has a third the capacity of the Blue Line, built in a similar corridor. It wasn’t built as light rail because, well, it’s along story that includes Orthodox Jews and corrupt politicians. You can’t make this up. Since it’s over capacity, there are initial plans to improve capacity (costing another $20 million per mile) or convert it to rail ($65 to $95 per mile).

The cost for a bus line that will perform anywhere near the level of a rail line will wind up being just about as high, and will still have a much lower capacity—certainly nowhere near the 90,000 passengers the Blue Line carries. Of course, there’s a sunk cost issue. Having already spent $600 million on a busway, there’s an argument not to “throw this money away”. But the total cost for the busway could come to $1 billion by the time all is said and done, about what light rail would have cost in the first place, with a lower overall capacity. So the BRT is really a white elephant, even if it’s one that transports a lot of people. This is a perfect illustration of the problem I posited above: you spend a lot of money on a project and quickly it is overburdened.

Cleveland Perhaps the best example of a successful BRT line in the US is the HealthLine. It was built along six miles of Euclid Avenue from downtown east towards a university/hospital cluster (including, yes, the eponymous Cleveland Clinic, and Case Western, too). It carries about 14,000 passengers per day, and does so in a well-designed corridor (the only one in the US to qualify as Silver based on the ITDP’s standards). The corridor varies between about 70 and 90 feed wide. The cost? $30 million per mile. It was probably a good investment. There is a roughly parallel heavy rail line that makes the end-to-end trip faster, so there’s never likely to be very heavy corridor ridership, and it likely won’t have to scale beyond it’s single-lane capacity. Of course, this rail line has plenty of capacity (it is by far most lightly used metro system in the country) between the HealthLine’s endpoints, so there is a valid question as to whether these investments were necessary.

BRT boosters (ITDP) point out that the HealthLine has been the $5.8 billion of development which has taken place along the line. (Well, other sources put the number in the $4 billion range; it’s a big number.) Which is great. But two important caveats. First: correlation does not imply causation. Much of this development was planned out well before the line was built. Much of it likely would have taken place if no improvements had been made. It’s not like the Cleveland Clinic (with 1500 beds and $9 billion in annual revenue) waited for the bus line out front to be built. Or that Case Western—with a $2 billion endowment—didn’t spend any of it until the HealthLine was completed.

The comments by Coolebra in this article flesh this out very well, as does this article. As one commenter there quips:

I could probably go put a giraffe near the Cleveland Clinic, and surely the Clinic will build another building within the next 24 months (or two). I can publish a study showing that giraffe investment is the best way spur development as cities run around to put giraffes across their neighborhoods.

The point being: there are a variety of factors which account for the return on investment for any transit line. Crediting all of it to a single source is folly. And let’s all say it together: correlation does not imply causation!

Second: most of the improvements have taken place on the eastern end of the line. This happens to be where it mostly parallels the aforementioned Red Line rail line. Saying that all of the development in the area occurred because of the HealthLine would be like ascribing all of the development between Dudley Square and the Financial District in Boston to the Silver Line. It helps, but there are a couple other factors—and rail lines—involved.

So there’s nothing wrong with the HealthLine, per se. It is a decent investment and has room to grow. But there needs to be a bit more nuance in analyzing it’s ability to leverage private investment than claiming that anything built within a stone’s throw—a college campus and two major hospitals—is only there because of the BRT. (In fact, they’re there because of transit—originally, Euclid Avenue had a streetcar, of course.)

Hartford Very recently-opened is CTFastrak in between Hartford and New Britain. Like the HealthLine, it probably doesn’t have the capacity needs for a rail line, and there’s no existing light rail infrastructure in Hartford to build upon. It’s reasonably fast, mostly grade-separated, and serves both buses along the line and others that enter the line part way along it. (It’s brand new, but has been getting good reviews.) Of course, it cost $60 million per mile to build, which is comparable to most new light rail lines. It will probably score well when the ITDP comes to town (separate platforms, some passing lanes, etc) and they’ll probably gloss over the fact that it cost as much as a couple of sets of railroad tracks.

It might be a good time to point out another hidden BRT cost: maintenance facilities. Light rail costs almost always include the operating fleet as well as the cost of maintenance facilities. Most BRT systems makes use of existing maintenance infrastructure, at least to start, which reduces costs in the short run but in the long run will require more or larger garages to be built down the road, especially if the line is successful (the cost of the vehicles is usually included in the cost of the system). I don’t believe BRT costs have future maintenance facility requirements amortized in to their figures. Since these are likely shared with other bus operations, the costs won’t be factored in to the cost of the system. Such facilities can cost more than half a million dollars per bus, adding a million dollars per mile in costs for frequent systems.

San Francisco And then there’s Geary, one of the busiest bus lines in the country. It has more than 50,000 daily passengers spread out among four routes, the 38, the 38R (a limited stop route) and two rush-hour express routes, the 38AX and 38BX, which serve an outer portion of the line before using other streets to access downtown San Francisco. In a sense, these already function as a local-express BRT network, just without the bus lanes, stations and other amenities the ITDP looks for. So basically BRT, without the R. Do they function well? Hard to say. People seem to like the limited and express options (I mapped their Yelp scores a few years back) although at rush hour the 38R, which comes every four minutes, is at or near capacity (running 60 foot buses).

The city is planning to build BRT and have it “light rail ready” because they don’t have the money for light rail. The problem is that this is going to have the capacity issues that the Orange Line has in Los Angeles on day one. Yes, better platforms, signal priority and wider doors may help, but the system already carries more than 3,000 passengers per hour, so it won’t have the capacity in a two lane system. Much of it is being built as side lanes instead of in a center median, especially in the inner part of the route, so limited buses will be able to pass locals in mixed traffic lanes. But it won’t really solve the capacity crunch, especially if there’s traffic in those lanes.

There are two ways to add enough capacity on Geary. One would be to build light rail. A three-car light rail train every five minutes would carry 6000 people per hour and not be at capacity. The second would be to build a full-on four-lane Bogotá-style BRT system. The corridor already has local, limited and express buses: at rush hour, there are nearly 60 buses per hour serving the corridor. This would allow buses with different service patterns to skip stops easily, and as we’ve said before, a multi-lane system does have capacity that will match light rail.

There are only two issues. The first is that even the half-baked BRT system will cost $50 million per mile (and run in to the same white elephant/sunk cost issue as LA has). A four-lane system would likely cost more, getting in to the range of the average light rail system. The second is that while there is enough space on the street for this type of system, there’s not much to spare. Geary is about 100 feet wide—one of the widest streets in San Francisco—but it is still narrow compared to most streets in Bogotá. Since most highways in the City were never built (or removed) and these few rider surface streets, it functions as a thoroughfare, as well as a shopping street. So to take four lanes plus stops for a busway would leave only 35 feet or so on each side, barely enough for one lane and parking. This likely wouldn’t fly, so you get single-lane BRT: pretty expensive, but minimal improvement to capacity. The B-Geary was one of the last lines in San Francisco to lose streetcar service, and the only way to keep enough of the road for cars and have enough transit throughput is a light rail line, even if it would cost more. BRT is, to quote Sarah Palin, lipstick on a pig.

Minneapolis-Saint Paul There are several light rail lines which have been built as well; for some of them there was a conscious choice made between bus and rail transit. The Green Line between Minneapolis and Saint Paul is one. When it was proposed, bus rapid transit would have cost about a third of the cost of rail. But it’s unlikely that it would have been able to handle the passenger loads that the rail line carries, especially since it serves both the University of Minnesota (with 50,000 students, one of the largest in the country) and both downtown Minneapolis and Saint Paul (Minneapolis being the larger traffic generator). The line already carries 35,000 passengers daily—more than the ten-year-old Blue Line (which was built along an already-cleared but never-built freeway right-of-way)—a year in to service. With those riders, Minneapolis now has the highest ridership of any light rail system opened since 2000.

It also serves the Cities’ main sporting arenas (the ballpark, hockey, basketball and both football stadiums and the minor league ballpark; and yes, the Twin Cities may be the most over-stadiumed city in the country), so in addition to heavy loads at rush hours, it has to cope with frequent event traffic as well. If it were a bus rapid transit system, it would have been overloaded from the start. As a light rail line, it can cope with demand with 10 minute headways at all times (except overnight, and, yes, it runs 24 hours a day), which means it could easily double capacity—or more—if ridership increases.

Which is not to say that the Twin Cities don’t have any bus rapid transit. They have a couple of freeway-based lines (which don’t really conform to ITDP standards) and are planning several arterial lines, which may not have exclusive lanes but will have better stops, all-door boarding and more frequent service. One, on Snelling Avenue, intersects the light rail lines near both lines’ midpoints. While Snelling once had a streetcar, it probably wouldn’t merit one today, but it connects the two rail lines and will provide an important link in the region.

While the Twin Cities may be somewhat light rail-heavy in their planning, they are choosing appropriate modes for each corridor. They aren’t hamstringing heavily-used routes with inadequate BRT because it’s cheaper (or because buses are always better, or something) but aren’t spending on light rail where BRT will do the trick (the streetcar plans are another story, and how I feel about them—conflicted—is the topic of another post entirely). Rail cost more than twice as much as BRT would have (but certainly not seven times as much) on University Avenue. But it provides more utility than BRT on day one, with room to grow. It was a smart investment, and the right choice.

I’m more familiar with the Twin Cities than other regions, but imagine there are others which act similarly. But the ITDP wouldn’t give them the time of day and certainly doesn’t examine rail systems as “gold standard” or otherwise. Perhaps it’s time we took a more holistic approach towards analyzing transit investments—looking at ridership, throughput and actual costs, not hyperbole—rather than engaging in mode wars (the Transport Politic made just this point recently). Let’s choose the right mode for each corridor, not blindly push for one over another based on preconceived agendas.

Ten years after I enroll, Macalester’s transit is slated to improve

Ten years ago, I arrived in Saint Paul, Minnesota as a (n extremely awkward 18-year old) first-year college student at Macalester College. Recently the college tweeted that new students could follow the campus life account and hash tag to stay abreast of move-in information. This made me feel old: when I moved in, we didn’t have hash tags. Or Twitter. Or Gmail. And forget about smart phones; many of us didn’t even have regular phones. And the Spotlight was an anticipated publication because it had everyone’s picture and phone number. In print form. Three years later, it would be fully supplanted by Facebook (which was based on a series of similar publications at Harvard).

Some things, however, have not changed. The 63 bus still bisects campus on Grand Avenue, and the 84 still runs north-south along Snelling Avenue. Even so, the public transport options from Macalester to the rest of the world (beyond the “bubble”) have changed in the past ten years, and are about to change exponentially. The two bus routes which serve campus will still follow their streetcar predecessors’ routes, but new rail lines will finally give them more flexibility and greatly enhance service.

Public transit lines can be very slow to change. They are rooted firmly in history; in most cities bus lines are based on streetcar lines built around 1900, and this entrenchment is not frequently updated to reflect more modern travel needs. For instance, the 63 bus runs west from Macalester and dead-ends at the University of Saint Thomas a mile to the west. This is the same route it’s run since 1890. (The only changes have been in headways, which have varied between 15 and 30 minutes over the last 10 years.) It connects there with one spur route of the 21, although it’s not timed, so except to get to Saint Thomas, there’s little reason to take the bus west. In 1900, the neighborhood was focused on Saint Paul, and ridership was mostly to downtown. Now, with Minneapolis a major draw, the bus provides very little connectivity to the west, instead dead-ending at an unheated bus shelter with a single transfer.

The 84 is slightly-more updated. By 2002, it had shed it’s streetcar-era jog up Pascal and moved to a full run on Snelling. (It also shed it’s Saint Paul-specific route number in 2000 or so, when the bi-city numbering scheme was integrated.) In 2000, it had several branches, and the airport branch was only served every hour-or-so, providing quick but infrequent access to MSP. (This was dramatically improved by 2002, when, during the heyday of Macalester-airport connectivity, there was an airport-bound bus twice an hour and the single-seat trip took under 30 minutes.) In 2004, when the Hiawatha Light Rail line opened, the route was changed to provide connections to the train and thence the airport, increasing travel times (especially with the moronic Montreal loop, which adds an out-of-the-way mile to the route with no appreciable gain) and no additional airport-bound headways, although the other half of the buses do connect to the airport-bound 54 bus which makes a tolerable airport connection every 15 minutes.

As much as that particular route has devolved, connectivity to the light rail and Minneapolis has improved for the 84. And with the new line on University finally being built, Saint Paul in general, and Macalester in particular, is going to reap dramatically improved transit access.

To the south, the 84 will see an increase from four to six buses per hour. The Montreal loop will be eliminated, shaving several minutes from the Snelling-Hiawatha trip. Headways on that branch will not be improved, however, so connections to the Hiawatha Line (Apparently, the Hiawatha Line is going to become the Blue Line, and the Central Corridor the Green Line. It’s probably good—unlike Hiawatha, “Central Corridor” is a pretty horrid name for a transit line, but I’m still not used to it.) will not be improved. This is too bad, and hopefully the short-turn trips at Ford Parkway could be extended across the river. Still, there is an improvement in frequency to Ford Parkway, and an improvement in time to 46th Street, both of which are gains. (In comparison, when the Hiawatha Line opened, there was no improvement in headways coupled with a loss in travel time.)

To the north, the 84 will serve its current route, but do so 50% more often. In addition, at some point it might become a “rapid bus” service and eliminate many single-patron stops, speeding the route mightily.

To the east there will be no net improvement in weekday headways, although the renewed emphasis on the 63 bus will likely mean less of a likelihood of headway reductions in the near future. (In 2001, headways were 15 minutes on the route west of Downtown, in 2003 they were expanded to Sunray, in 2005 they were reduced to 30 minutes West of Downtown and in 2009 they were finally made 20 minutes on both sides of the route.) And the weekend headways, which are currently 30 minutes on Saturday and an hour on Sunday, will be improved dramatically.

Finally, to the west, the most improvements occur. Right now, outside of rush hour, travel to Minneapolis is a trip on the 84 and a transfer to the express-bus 94 (30 minute frequencies outside of rush hour) or the 16/50 (10 minute headways at least, but horrendously slow service. The light rail will halve scheduled times, and with the 84 matching its headway, the average connection at Snelling and University will be 5 minutes in both directions. The average trip time will be 30 minutes from Macalester to Nicollet, as fast as the current connection but with no traffic delays at rush hour and triple the frequency middays.

In addition, the 63 bus will provide service west and a connection to the light rail. So, from campus, there will be 9 options per hour to get to Minneapolis, and a quick wave of the smart phone will tell you which bus is slated to arrive next. If an 84 is 9 minutes off but a 63 is due in 2, walk to Grand. If the 63 just passed, grab an 84. Coming back, if you can make a quick connection at Raymond to the 63, hop on it; otherwise, stay on the train.

When I was on campus, I rode the bus east with some frequency to Saint Paul (15 minute headways and a 15 minute ride) but rarely ventured to Minneapolis. When I lived in Saint Paul, headways on the 63 were worse and there were still no good connections to Minneapolis, so I spent a lot of time bicycling. I’d still probably bike for this trip with the Central Corridor plan in place, but I can think of multiple times where I decided not to take a trip to Minneapolis because the weather was lousy and the bus schedules uncooperative. Having improved headways to all points of the compass will be a boon for Macalester students, and a boon for the residents of Saint Paul. Hopefully they’ll be enticed to come out and use it.

Time lapse on the road

A couple years ago, before the long Minnesota winter set in, I went biking around Saint Paul taking long camera exposures to … well, to see what happened.

Other than my hands freezing (it was October, or maybe November), the shots were mostly what I had expected. The lights of the city at night streaked along during the exposure. My subject was still, but the camera was moving. By taking a long shot I was able to take a subject and almost completely abstract it, turning the lights of the city in to squiggly lines along the night sky.

I had a camera out last night in Cambridge and have to change the strap around a bit (i.e. I took a bunch of time lapse pictures of the road), but playing with the lights of the city at night is a lot of fun. And, yes, I really do want to take a bike the next time I head to New York City.

Extra credit: where were these two photographs taken?

Bicycling directions: Google Maps vs. Cyclopath

When Google Maps launched bicycling directions, it was seen as a boon to the bicycling community nationwide. Finally, cyclists could see directions based on roads and trails, instead of being routed by the Googles on to highways and freeways. Speculation about the directions—that it would encourage more people to bike and even might influence city planning—abounds. People from Seattle to Portland to San Francisco to New York to Boston started throwing around reviews (mixed, actually; the service still feels very beta-y) about the new feature. It’s great that Google has released this product, but it feels like it might not be ready for prime time.

Around the same time as the feature launched, the first proofs of Bicycling Magazine’s annual ranking of cities for cycling came out, and there was a new #1. The newly crowned Minneapolitans (and their Saint Paulite brethren) were not as excited about the Google Maps cycling directions. Why? Because for quite some time, they’ve had their own version: Cyclopath.

Cyclopath was developed by, what’s best to call them, a bunch of bicyclist-geeks. Long before Google entered the marketplace, Cyclopath had developed, first as a project at the University of Minnesota and then as a “Geo-wiki” (part of it is to study of Recommender Systems, and even the behavioral science behind route finding). It was developed in 2008 and released to the public in the summer of that year, more than a year and a half before Google developed their nationwide network. It’s gone through several releases  and now incorporates users opinions of various roads. While Google depends on a very analytic approach, Cyclopath provides more subjective data for users, which it seems, is more useful in the long run.

Plus which, Cyclopath’s data—since it was first uploaded—is consistently updated by its users. Find a road which has been closed? You can close it. Has a road been repaved or has it become incredibly potholed by a winter of freezing? Change its bikeability. Need to add a road? Add it in. Want to write about a long traffic light or a weird lane merge? That can be added in, easily. Google’s still in beta; Cyclopath is humming along.

In comes Google. Cyclopath likes it well enough, and doesn’t really see it as a threat, since they think they are better. In reality, they are two different approaches to the same problem: how do you get from Point A to Point B (as long as, in the case of Cyclopath, you’re in the Twin Cities). So, which is better? Let’s go through a few differences.

Quality of Route

This is the big one, let’s get to it right off. Cyclopath, with years of experience and input, rarely routes you inefficiently (you can change its algorithm, too, see below). Google Maps, on the other hand, has enough mistakes (it’s missing, for example, the Sabo Bridge and will route you on an Interstate ramp) that it’s a bit of a pain to use. But it’s not so much these glaring omissions—it’s the turns that are missing, often turns you can make in a car (try, for example, to make a left turn from Cleveland Avenue in Saint Paul to Mississippi River Boulevard)—which result in convoluted directions. And if you put in a ZIP code and Google happens to located it on an interstate, forget about non-car directions (even the car directions are bollixed up). Until these issues are fixed—and I know of half a dozen in Minneapolis and Saint Paul alone, so there have got to be hundreds nationwide—Cyclopath wins, hands down. I’m sure in cities which went from zero biking directions to Google, it’s great, but they have a way to go to catch up with Cyclopath.

Flexibility of Route Search

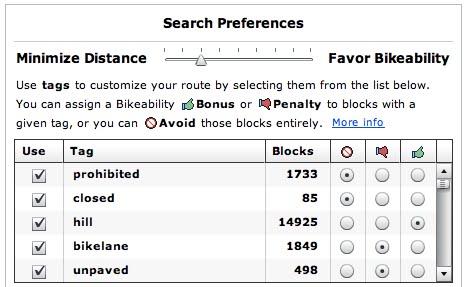
When you search for a route in Google maps, you get several options: by car, by transit, walking or bicycling. Within bike directions, however, you have no options. There’s no way to avoid hills, or weight bike paths higher. They have gone on about their great algorithm, but there’s no way to know exactly how it works. The algorithm is what the algorithm is. In Cyclopath, you have choices. (see right) If you want to get from point A to point B as quickly as possible, you can choose to minimize distance. For a nicer, but potentially longer ride, choose, bikeability. And you can then assign penalties or bonuses to your routes for customization.

The one aspect of route flexibility where Google wins is in the post-search environment. With Cyclopath, you usually get a good route, but if you want to change it to, say, add a waypoint (often to get it to follow a certain road or trail) it won’t let you. You have to create a new route. Of course, Cyclopath can display multiple routes at once; Google can not.

Non-cycling Data

Cyclopath sounds great, but isn’t it just a glorified bike map with directions? Nope. While Google has added a lot of secondary data, Cyclopath more than keeps up. Google has more background layers, and draws on its wide search database to show photos and webcams and georeferenced Wikipedia articles and other such sundries which clutter the map. Cyclopath has a toggle for satellite imagery (the “P” key) which loads faster. In addition, Cyclopath has a plethora of local businesses and buildings tagged, some of which have very pertinent information added (such as “bike racks on north side” or “bathrooms on lower level”). In addition, Cyclopath has future trail alignments shown as being “closed” which Google omits.

Fixing data

If you want to fix data in Cyclopath—if you find a street which is closed (even temporarily, for construction) or a new bike lane or anything else which is missing, sign up, sign up, and edit away. There’s been little vandalism (a Star Tribune article from 2008 didn’t foresee any) and editing is encouraged to keep the map’s data up-to-date. The map is relatively easy to edit (although the onus is on users to assure that the network is configured correctly). In Google? Well, there is a link to email suggestions to Google. I have—more than once—and gotten an email that they are working on it. But it still gives wonky directions for those routes. And the ability to add data and comment on the quality of roads is, well, amazing functionality.

UI

Google Maps’ UI is a thing of beauty. Going from the clunky pre-Gmaps interfaces (yes, Mapquest, we’re looking at you, at least until pretty recently) to Google Maps, back in the day, was eye-opening. Zooming, scrolling and navigating were made far simple in Google Maps, and while it may be resting on its laurels, everyone else is just catching up. Cyclopath is a different animal, and while its main interface seems a slight bit clunkier than Google Maps (no, you can’t double click to zoom and recenter) it’s very well designed for a local, bicycling website, especially one which has editing capabilities and a community feel mixed in.

The Name

No one knows what to call Google Maps bicycling directions beta. “Google Maps Bike Directions”? “Google Bike?” Everything seems, well, clunky. Cyclopath has a great ring to it.

Geographic Range and expandability

Okay, here Google wins. Google Maps bicycling (or, um, whatever) is nationwide. Cyclopath is in the Twin Cities (one of which is the top cycling city in the country). Could Cyclopath be exported? Maybe. Its creators claim that it would take a month of tech work from a rather qualified person, and that there’d still be logistical issues (or, as they put it, “unknown unknowns”).

Implications for bicycling as a whole

Google Maps may actually stymie the development of Cyclopath-like websites in other cities—who may be content with their Mountain View bicycle overlords. While Google has created a respectable product, it does little to incorporate the huge knowledge base of cyclists around the country. Road users don’t so much care whether a street surface is concrete or asphalt, and how wide the lanes are. Cyclists do—and ceding the authority to Google by default may not be in the best interest for bicycling. Hopefully both services will thrive, and Google will become more suited towards biking. In the short term, Google Maps bike directions are good for cycling. In the long term, it has the potential to be a back-burner project for Google, but one which is just useful enough that enterprising individuals don’t continue to innovate with products and services like Cyclopath.

The Verdict?

Right now, if you’re in the Twin Cities, skip Google Maps. Cyclopath will give you better directions, and may even entice you to become part of the community. And any changes you make won’t come with a ticket number.

A bit more on bricks

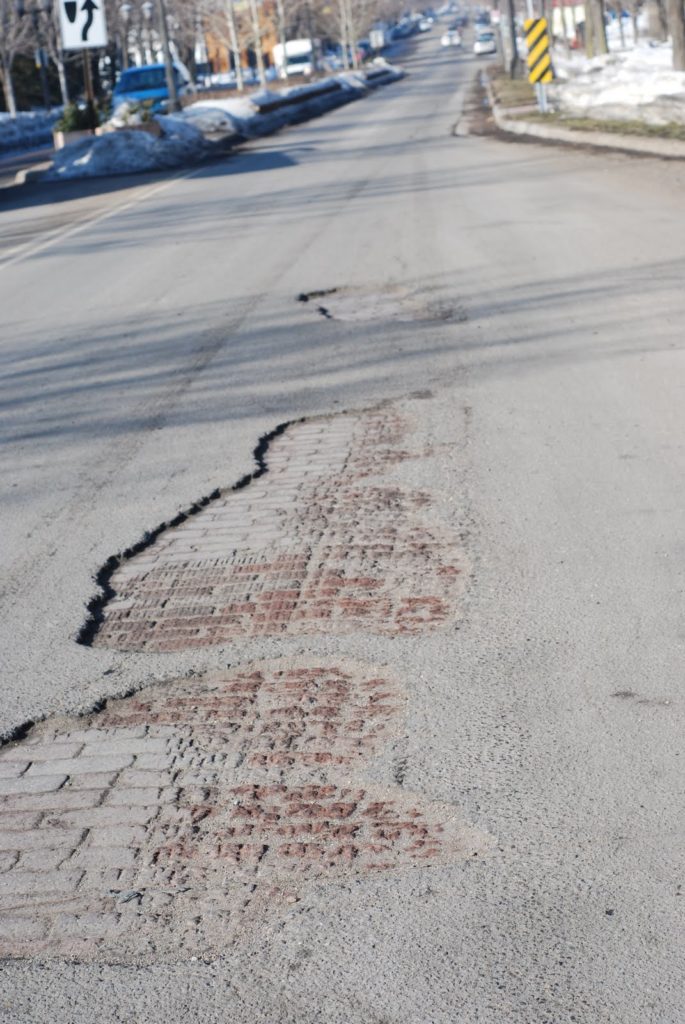
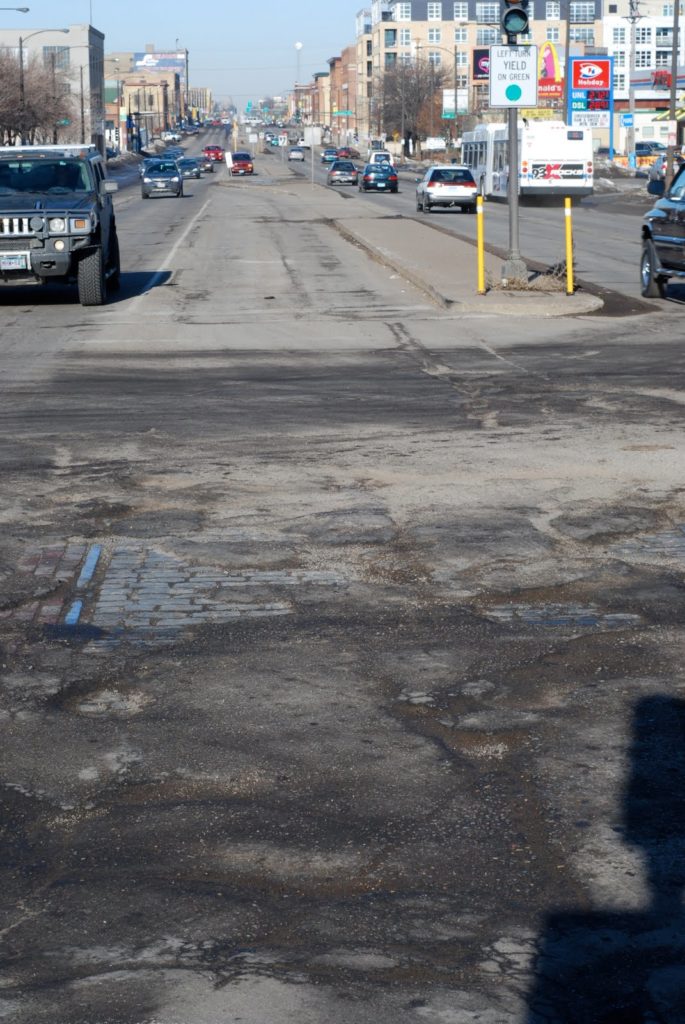
Bricks are by no means a panacea, but they’re a different idea. First, they’re showing up in more places, such as on Grand Avenue just west of Snelling. (I don’t know what happened to the bricks on the right side, but they’ve been ground up a bit.)

What’s interesting here is that Macalester College funded the building of a median in the street a few years ago (you can see it at the top of the picture above) for the benefit of pedestrians: dorms are to the north (right) of the street and the dining hall and academic buildings are to the south. The street used to be three paved lanes with a striped median (it disappeared in the winter), and the new median entailed rebuilding the street—there are plans for one on Snelling as well (which we covered last year)—and tearing out the brick and rails. One wonders why they couldn’t have kept the brick—there is little heavy traffic on the street except for buses. This is relatively new pavement that’s already coming up.
Second, some crosswalks further down Grand (a mile east, at Lexington) were built with brick pavers, most likely for aesthetic purposes. What’s illustrated here is that when bricks are uprooted—in this case, most likely by passing snow plows—they can be replaced piece meal. And, unlike asphalt, replaced bricks don’t result in ugly patches that just rip back out, anyway (except where the patches in the brickwork are patched with asphalt, which is especially ugly and does rip right out).

When streets were streets

About a week ago, Infrastructurist posted about the various materials used for sidewalks. The consensus is that concrete is cheap and functional if not very environmentally friendly (both in its construction and its low permeability). Of course, in Paris, the streets are cobbled, which is beautiful, if a bit jarring to drivers and cyclists (although perhaps better than potholed asphalt).
Now, in America, except in a few instances (historic districts, or places where rich people gather, or both), streets are pavement. In some cases, concrete. Pavement is good when it’s good, but when it’s bad, it’s real bad. In other words, asphalt seems to have a wide range of conditions: new asphalt is silky smooth, but it doesn’t last in good shape. For a while it’s tolerable, until there’s a year with a lot of freeze-thaw cycles and gaps, gashes, frost heaves and, yes, potholes take over.
And that’s where we are in the Twin Cities. We’ve had an about-normal winter, but it’s been marked by a decent amount of warmer and colder temperatures. And snow. And plows. Minneapolis had enough snow accumulated that they had to ban parking on one side of narrow streets to allow traffic to flow, and all over there are huge gaping holes in the streets. And that’s meant we get to see what lies beneath.
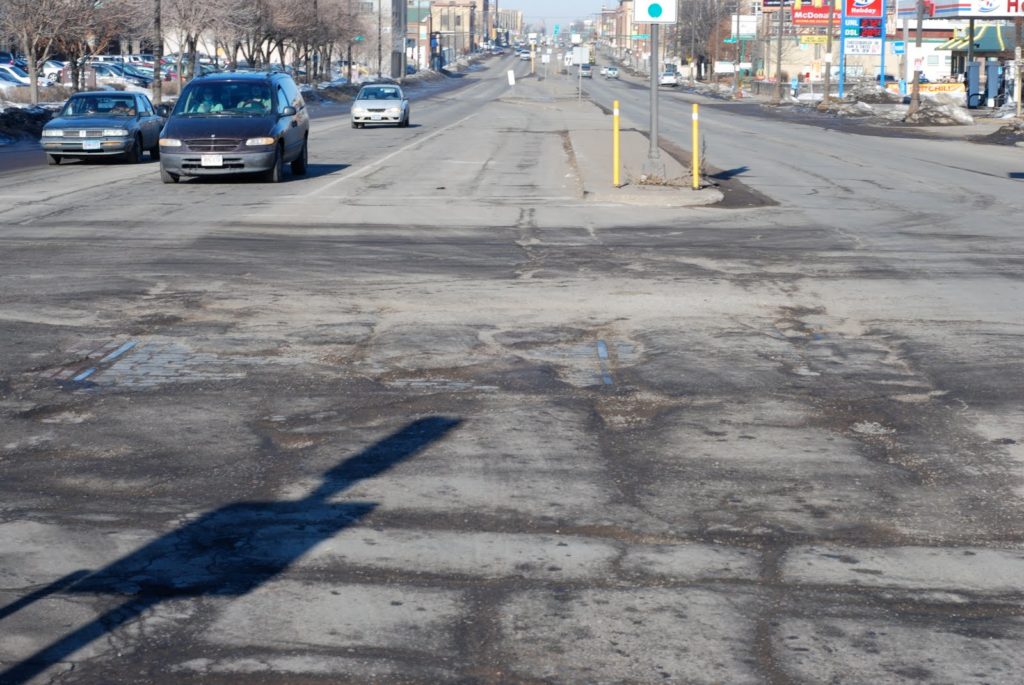
Here’s the middle of the intersection of University Avenue and Vandalia Street in Saint Paul. University was once the main thoroughfare between Saint Paul and Minneapolis, and while most traffic now takes the paralleling I-94, it is home to buses and will, in a few years, be home to the Central Corridor Light Rail. Of course, University had a streetcar line, which was very well patronized (the buses still run at 10-plus minute headways, with limited service at rush hours) until it was closed in favor of buses in the early 1950s. 
But 55 years later, the streetcar tracks, at least, are making a (re)appearance. The Google Street View from a couple years ago shows solid pavement at the corner of Vandalia and University. However, Vandalia is the route to the interstate for many trucks serving the nearby industrial area, as well as going to a large BNSF multi-modal facility, and the corner sees a lot of heavy traffic. So with the current winter, the pavement has been torn up pretty well.
It’s actually not bad to drive on—the holes are wide enough that they aren’t all that deep (the sides generally slope) but so much pavement is gone that you can see the streetcar tracks as well as the pavement. And it’s really quite interesting. First of all, for such a wide road, the streetcar tracks really take up a small amount of room. The image above shows that the tracks are contained in a lane-and-a-half of a turn lane and median (no comment on how ugly the University streetscape is), and there are two lanes of traffic and a wide parking lane on either side.
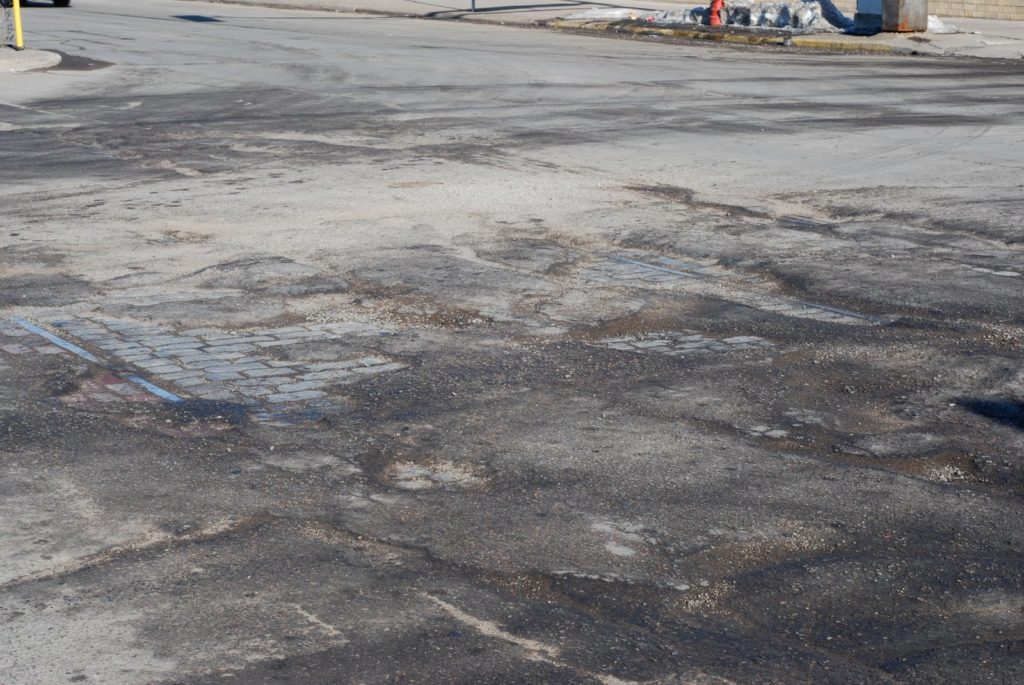
But second, it gives us a really good idea of what streets used to look like. Here’s a closer-up look at the exposed section. The rail on the left is the southern rail of the eastbound track, the rail visible to the right is the southern rail of the westbound track. So, between the tracks were (are) gray cobblestones, and on the outside red brick. There isn’t much color film from the time, but it seems that University, with red and gray stone and silver, steel rails would be almost elegant (some trees would be nice as well). Now, with gray, gray and more gray, it’s quite drab.
Apparently bricks and cobbles don’t hold up well to heavy truck traffic, although this section seems to be doing just fine. Apparently bricks and cobbles were used along streetcar routes because they could be more easily picked up and laid down when track work was necessary. Of course, there’s a possibly apocryphal tale that Melbourne, Australia’s trams were saved when, in the ’50s, the tracks were set in concrete, so that ripping them up would be prohibitive (in the US they were mostly just paved over). The union’s intransigence there—they required two-man operation on buses, and streetcars had conductors until the 1990s, when their removal caused a crippling strike (long story short: government says “one person tram operation”, union says “no” and runs trams without collecting fares, government plans to cut power to the system, union drives trams on to streets in city center, where they sit for a month)—was probably more to blame.
When Lake Street was rebuilt in Minneapolis in 2005, the street below was in similar shape—shoddy asphalt over a firm streetcar base. Since it was not just repaved, it was dug up completely, and Twin Citians flocked to scavenge bricks from below. University, which is wider and longer than Lake Street, should be a field day for anyone who wants a new, free patio or walk—it will be fully rebuilt for the light rail line (yes, they’ve studied it, and they can’t just reuse the tracks already there).
But, why not build streets out of these materials again? The upside to pavement is that, for a while, you have a really nice road. But in the long run? You have ruts, dips and potholes. Another layer of pavement is a panacea; cracks almost always form where there were cracks before (it’s easy to find old streetcar tracks—they’re wherever there are parallel cracks running down the road). Bricks and cobbles are attractive and permeable. Water filters through, which is better for the environment. As long as there’s no heavy truck or bus traffic, they’re fine. If something goes wrong, it’s easy to make small repairs which actually last (as opposed to patches which tear out during the next thaw). And for cyclists, constant cobbles are almost better than old pavement with huge potholes and ruts, even if you have a good bunny hop.
I’m not saying it’s the way to go for every street, but in certain cases—especially if there are streetcars involved, red bricks and granite pavers may be the way to go. And in many cases, they may be lurking just below the surface already.

The fallacy of one-way car sharing

(This all began a few months ago, when a friend in Austin and I discussed a one-way rental scheme there. Months have passed, he’s moved, and one-way car sharing still isn’t open to the public in Austin. Or anywhere else in the hemisphere. And, outside a couple isolated cases, I’m not sure it will ever work. I distilled the argument, a bit, in a comment at the Transport Politic, and promised to flesh it out. Here’s my best attempt …)

One of the most frequently asked questions for those of us in the car sharing industry is “when are you going to have one-way rentals.” There’s no good answer. Yes, car sharing is a relatively young industry: Communauto is celebrating 15 years in Montreal, most other Car Sharing Organizations (CSOs) in the western hemisphere are 10 or younger. While the technological advances during that time have been rapid, from paper log books and lock boxes to iPhone reservations and remote unlocks, everyone has been vexed by one-way rentals. Supposedly some very smart people (at MIT IIRC) tried to build an algorithm to allow for one-way rentals, and it failed miserably. So, with one minor exception, if you take out a car sharing vehicle, you have to return it to the same space.

The one exception is with Car2Go (not to be confused with a similarly named CSO in Israel), which is “operating” in Ulm, Germany and Austin, Texas. Why Ulm and Austin? Well, Car2Go is backed by Daimler, and has a fleet of Smart Cars in each city. I know very little about the operation in Ulm (or the city itself) other than it is a small, dense, European city. As far as Austin, I know two things. First, the system there is not open to the public. Second, it seems to have backing from the municipal government and the University of Texas, at least as far as parking, which is why it might not fail. Might.

There are two ways to figure out why one-way rentals do not work for car sharing. One is to take a CSO, its members, vehicles, and a defined area, and try to create an model which takes in to account car usage, parking, times of day and fees per mile or minute to see if it, well, works. That is very complicated and, even if it proved successful (so far it has not) is still only a model. The second method, however, is to take a step back and look at some of the underlying factors which would create a workable one-way car share, and how these mesh with such a program. Doing this, it becomes quite clear that one-way car sharing will never really work, no matter how many GPS-enabled cell phones there are.

So, let’s take that step back. In North America, one-way rentals would seem to be based on cities with high density, i.e. cities where, once a car was parked, it would not be long before another driver needed it. We can use a very good proxy for this: cities which are existing major car sharing markets. These are, in the United States, Boston, New York, Philadelphia, Washington, D.C., Chicago, San Francisco, and to a somewhat lesser extent, Portland and Seattle; and in Canada, Vancouver, Toronto and Montreal. (All have at least 300 shared cars on the road, except Portland and Seattle, which have about 200.)

What do all these cities have in common? They all have the soft factors which, in my opinion, are supportive of car sharing: the availability (or lack thereof) and cost of parking, the frequency, reliability and speed of a transit network, and the prevalence of urban congestion. (See this post about car sharing for a longer discussion of these three factors.)

Why won’t one-way car sharing work in these cities? One word: parking.

Imagine starting something like this in a city like Boston (a stand in for our dense car sharing cities because I am poaching most of the next few paragraphs off of an email I wrote a while back). No one would use it. The reason Zipcar is successful (as are other CSOs in other cities) is that when you return your car you are guaranteed a parking spot. If you are going from Cambridge to the South End, you take the T, because it is faster (or marginally slower) than driving, cheaper, less aggravating, and less likely to experience a traffic jam. (And if it is delayed you can walk—you’re not wedded to your car.) If time is of the essence, you take a taxi; as long as you aren’t going right there and back it’s probably cheaper than a shared car (you pay for when you use it, driving or not, so if you are going to a party, it’s cheaper to that the T there and a cab home). You use Zipcar for trips to the grocery store when you don’t want to haul groceries on the T, trips to Ikea &c., trips to the suburbs or places to which the T doesn’t run and to which a cab would be abhorrently expensive (anything within spitting distance of 128).

Now, imagine the one-way car sharing scenario. You pick up a car near your house in Cambridge, and drive to the South End. It works well because it is an easy trip. But there are two problems on two different scales. On a small scale, you get to the South End, and start looking for parking. Most likely, any time you saved driving you lose trying to find a space. Maybe a firm comes up with a way to send the location of spaces to your phone (I worked for one of these for a while, and it did not work out), but there is still a lot more demand than supply. So circling the block eats up any time savings you may have enjoyed. And there’s no way that this service, at $300+ per space per month, goes out and buys enough spaces around the city that you could always find one open and convenient. It might work if you dynamically base the price of the destination based on demand, but then high-demand locations will cost more than taxicabs.

Based on the density of cities like Boston alone, one-way car sharing would work. Except that it is impossible that the parking could be worked out. You’d almost necessarily have more parking spaces than cars, which is both an economic and social detriment: parking, especially empty, is antithetical to density and walkability. (Most CSOs have as many parking spaces as cars; some have fewer. If a CSO has 15 cars assigned to a lot and knows that 99.5% of the time no fewer than 2 cars will be checked out, and lower pricing for off hours can encourage this, they can buy fewer spaces than they have cars. At $300 a space, this is a nice thing to be able to do.)

The other problem is large scale, one of congestion. Imagine that you somehow solve the parking conundrum this takes off. Imagine that whenever you need a car, you can get one and drop it off wherever you need to, and pay a few dollars for its use. It would be great. Everyone would use it. And, there’s the problem. And all of the sudden, tens of thousands of people who used to be carried below grade on subway lines (and some buses) would be clogging the streets in their little two-seater cars. Even if they were in such eight-foot long vehicles, they’d take up a lot of space. In cities like Boston, New York and San Francisco, adding a few percent to the already at-capacity roads throws the system in to gridlock. You’d pretty quickly lose whatever time advantage you had over mass transit, trips would be more expensive than transit (or, if they were short enough, still more expensive than walking), and it’s not pleasurable to sit in stopped traffic in a city.

Finally, cars will necessarily flow to certain places at certain times of day. From residential areas to office areas, from offices to restaurants to entertainment districts. If there are too many, you have to move them. But cars aren’t like shared bikes. You can’t send one buy out with a truck, load ten of them up in one location, and ship them off somewhere else. You need a driver for each, and that gets costly.

On the other end of the spectrum, there are less dense American cities, some of which do have shared cars on the street. I’m not speaking of universities which pay for a couple of shared cars, but cities with smaller shared car fleets on their streets, like Madison, Denver/Boulder, Minneapolis/Saint Paul, Atlanta and Pittsburgh. We’ll use these are stand-ins for the less-dense American city, which may not have the aforementioned factors in place.

Here our stand-in will be Minneapolis and Saint Paul, because, uh, again, I can coöpt much of an existing email in to this post. In the Twin Cities parking is pretty easy. But for a scheme like this to work, you’d need so many cars in order for them to be within walking distance of enough people. (Add to that the fact that in the neighborhoods where it works best—Uptown, the University of Minnesota, the downtowns—parking is an issue.) So there are a few neighborhoods where it might work okay, they are not very well connected, and many people living there ride their bikes anyway. Andy pretty much every city I can think of falls in to this category.

In addition, cities such as the Twin Cities have many services which are only available in the suburbs. For instance, in Boston, Chicago and San Francisco, there are REIs and Apple Stores easily accessible by transit. In the Twin Cities, they’re in the suburbs. So for a lot of trips, you have to drive somewhere, leave the car in a suburban parking lot, and need it to get back. One-way rentals don’t really apply here.

The only cities I can think of that might be able to solve the parking issues yet have dense enough areas to support many cars are mid-sized cities with huge, urban college camuses, decent transit and middling parking issues, and the right “clientele” for the service. Basically, Austin and Madison. The colleges can be strong-armed in to giving up enough parking to make it viable on the campus, and the geography might work out otherwise. (Of course, would this program be used by broke college students when free options like biking or walking abound?) It’s definitely a might; I’d still be surprised if it works.

You may notice I have not said a word about the logistics of the whole charade yet. I am rather well-qualified to speak to them, and it would scare the hell out of me. Basically, what happens when a car goes off to never-never land—a part of the city which might be in the city limits (or the sharing limits), but where no one really wants to drive from. Either it sits there generating no revenue until someone wants it, or you have to dispatch someone a folding bike to get it. Either way costs staff time and mileage.

What happens when someone parks it and leaves it in an underground garage with no GPS reception. You know, like Whole Foods (in Austin, which has underground parking)? (I assume they’ll have sensors there, which would be somewhere I’d assume a lot of the cars would wind up, but you’d have people walking up and down the aisles in the lot, or have the cars in a special parking space. Still, now you’ve spent a lot of money wiring every garage in the city for connectivity.) No one can find the car, you have to have someone call the previous user (and good luck reaching the jet-set type anymore, many of us don’t answer calls promptly), and try to find the car. CSOs know where our cars are—they are returned to their spots 99.9+ percent of the time.

Finally, take the following scenario: you live near the outskirts of the drop-off area and work eight miles away, also near the outskirts of the drop-off area. You pick up a car one day and park it at your house, where no one else is likely to use it. Then you wake up, drive it to work (you pay for what you drive, so 15 minutes costs you $3) and leave it at work, where, likely, no one will want to use it. At the end of the day, you drive it home, another $3, and leave it there. All of the sudden, you’ve paid $6 for a 16 mile round-trip commute, gas and insurance included. If someone else uses the car, you take a bus or bike in to town, pick up another one, and do it again. If this happens every couple of weeks, it’s a minor inconvenience,  and your total commuting costs might be $120 a month. It’s not a bad deal for you, but would bankrupt anyone trying to run the thing.

A couple more tidbits:

A lot of car sharers often make reservations in advance. Like, weeks in advance. Every Tuesday evening they drive to the grocery store, or their great aunt’s house, or the climbing gym. The car is where the car is and they know it will be there. With one-way rentals you don’t have any assurance a car will be where a car will be. Thus, you throw out the segment of the market which has reserved in advance. (Without throwing around any insider information, let’s say this market is below 50%, but still significant.) You could have a dual system, where some cars are round-trippers and some are one-ways, but then you have more overhead and member confusion (we’ve found that simplicity, in car sharing, is a virtue). And the logistics—people parking in the wrong spaces; people taking one-way cars on round trips, would be an administrative nightmare. Or, you could have a system robust enough that there’d almost always be a car where you wanted it. But I think I’ve given several reasons that such a system is unlikely. And you’d still need a system whereby people could take cars for longer trips and pay for the non-driving time in between to guarantee the car would be theirs.

Okay, so what about bike sharing? It works, right? Yes, but bikes are smaller than cars. A lot smaller. You can put fifteen bikes on a sidewalk without disrupting the traffic flow of pedestrians or vehicles. Try doing that with one car, let alone a dozen.

To sum up, a one-way car sharing system only works in an area well-served by transit. However, to get from one area served by transit to another, you don’t really need car sharing. Car sharing fills a specific niche where transit is too slow or inconvenient, taxicabs too expensive, and cycling too impractical. One-way car sharing would be like taxis without drivers. Except when taxis aren’t carrying a fare, they are doing one of three things: they are either parked in an out-of-the-way location, driving to find another fare, or idling (generally at a cab stand or high-traffic area) with a driver in the seat. Taxis never have to find parking. Take away the cabbie, and the system fails. As would, in my opinion, one-way car sharing.

*****

Want to find a CSO near you? CarSharing.net‘s list a pretty good list. If you are in the Twin Cities, HOURCAR is fantastic, although, full disclosure, I do work for them.

Progressive cities: are they racist?

Andrew Sullivan has recently been blogging about an article that certain progressive cities are progressive because they have fewer African Americans. This is not only preposterous, but it completely ignores the historical perspective of minorities in cities. Take my current hometown of Minneapolis-Saint Paul, particularly Minneapolis. As late as 1970, Minneapolis was 93% white. This is rather astounding. The African American community was concentrated in a couple neighborhoods, and the rest of the city was almost completely white. (Saint Paul, while slightly more diverse, was also rather white.)

Most of the African Americans who moved north in the first half of the 20th century did so during the Great Migration, and where they moved was mainly based on the railroads. Since Chicago was the end of the Illinois Central (and other lines) which reached in to the south, most blacks stayed there (or took interurbans to Milwaukee for a few nickels). Minneapolis’s industrial employment during through the war was diverse, if you count Swedes, Norwegians, Finns, Germans and Irish as diversity.

While the other cities mentioned—Austin, Seattle, Portland, Denver—have had different migration patterns, none were on rail lines which led directly back in to the black belt, so they didn’t pull from the pool of African American labor in the industrialization of the early 1900s. And, thus, they are generally less diverse—if you look at diversity as purely black-and-white—than some other cities.

However, Minneapolis has changed, dramatically, over the last 40 years. The minority population, at seven percent in 1970, has increased more than fourfold, and now stands at nearly one third. Much of this has been Asian and Hispanic immigration, but a significant portion has been African Americans moving from other cities, especially Chicago. And the adjustment to a more diverse city has not been smooth. In the 1980s and 1990s, Minneapolis saw increased crime, often blamed on imported street gangs and drugs. In the 1990s, the city was nick-named Murderopolis, and saw nearly 100 murders in a year—for a city with fewer than 400,000 residents. And the change has been dramatic; in many http://www.ci.minneapolis.mn.us/neighborhoods/>neighborhoods, (an example from the Minneapolis Neighborhood website) there has been an almost full-scale switch from white to black in 20 years (all taking place after the 1980s—i.e. not done illegally through redlining), a phenomenon David Carr described last year in the Times. (Recent surveys show the racial makeup of the city may be stabilizing.)

In other words, Minneapolis is not a white city without any racial tensions. It’s far from it, yet it’s continued to be a rather progressive place. (Although some of this can probably be attributed to conservatives fleeing to the suburbs—the same suburbs that spawn creatures like Michele Bachmann. Minneapolis’s outer suburbs are very, very red.) But in the last few years, a curious trend has emerged. Crime has been dropping, which is often attributed to more police on the streets and community development. This summer, the city had six murders in the first six months of the year, shocking some local historians. The trend has continued to be low; there have currently been about a dozen murders this year in the city, so it’s on place to be at one-sixth the rate of the mid-90s.

In the mean time, the city (along with Saint Paul, which is also rather safe) has welcomed tens of thousands of new immigrants, including many Hmong and Somali refugees. There’s no second language in the city—signs and materials are often translated in to Spanish, Hmong and Somali. Renn’s contention that these progressive cities are only progressive because of their racial makeup holds no water. In other words, causation does not necessarily imply correlation.

The strange tale of the 21, 53 and 63

This was originally posted as a comment on the Minneapolis Transit blog about increasing limited bus service.

1. Cutting service on the Selby section of the line to every 26-28 minutes is probably not a good idea. The line is rather well-patronized along that section with the current 20 minute headways and reducing it beyond that would make it much less useful (I think it should have more frequent headways, every 15 minutes, anyway). There’s a lot of land along Selby which is either vacant or parking, and better transit service might serve as a catalyst for redevelopment. A better economy would help, too, of course.

2. The 21D is a farce. Supposedly it was wrangled by Saint Thomas in order to have better transit, but it is usually empty until it clears the river. The worst part is, however, that the 20 minute headways on the 21D match the 20 minute headways on the 63 which ends at the same stop, but no one at MetroTransit has ever thought of interlining (I asked). How much sense would that make? Lots. Grand Avenue’s line would no longer dead-end at Saint Thomas, providing access from Grand to the LRT (to Minneapolis and the airport) and Uptown.

Furthermore, of the buses that run west from Saint Paul more than twice an hour (the 3, 16, 21, 63, 74 and 54), the 63 is the only one without a western “anchor.” The 3 and 16 run to the U and downtown Minneapolis, the 21 to Uptown and the 54 and 74 to the Light Rail. The 63 ends in a residential neighborhood in Saint Paul. Finally, going from Grand Avenue to Downtown Minneapolis requires two transfers (unless you go east to Saint Paul, not feasible from the western part of the route), which is time consuming and inconvenient. Interlining with the 21D would solve many problems with little or no additional service required (except, perhaps, when the 21D doesn’t run at rush hour). Running the 63 in to Minneapolis seems almost intuitive. I guess that’s why it hasn’t been done.

3. The bus stops along the 21 line from Uptown to Hiawatha (and in most of the Twin Cities) are way too close together. Since there is often someone getting on at every block, the bus winds up pulling in and out of every stop. No wonder it is scheduled to complete this section of route in 25 minutes, at a speed of less than 10 mph. If bus stops were halved few people would notice the longer walk (still generally under 1/10 miles) and the buses would be speedier. Plus, what it its real utility when it doesn’t run at rush hours?!

4. Finally, the jog to University is very helpful for people who want to transfer there, but very time-consuming for through-riders on the 21. Perhaps the midday 53 could, instead of using the Interstate from Snelling to downtown, use Selby, with stops every 1/2 mile at major cross streets (Hamline, Lexington, Victoria, Dale, Western).

When this was changed some time around 2004 (from the historic Selby-Lake route dating back to the streetcar era), it increased the utility for travel to University and a transfer to the 16, but decreased the utility for cross-town trips by adding to the already-long run time of the bus. Considering how many people transfer to and from the 21 at University, it seems like it would almost make sense to have one leg of the 21 run on Selby to University and Snelling, and then west on University to Minneapolis, and another to run on University from Saint Paul to Snelling, and then west on Marshall and Lake to Uptown. Better 53 service would, of course, help as well, and just cutting off that jog, with half a dozen lights and a mile of extra route, would cut service times.