“No Headphones While Driving” goes for bikes, but moreso

Driving around Massachusetts today, I noticed some of the variable message boards—you know, the ones which usually flash YOU BOOZE, YOU CRUISE, YOU LOSE and infrequently tell you about traffic conditions were proffering a message near and dear to my heart.

NO HEADPHONES WHEN DRIVING. ONE EARBUD ON PHONE OKAY.

This is important. Just because we’ve said that hands-free driving is okay (Is it as safe as undistracted driving? probably not, but a conversation can be a good way to stay awake and alert, I’ve found.) doesn’t mean that you can rock out to your tunes on your headphones. That’s a primary offense and can get you a citation. And, jesus, people, haven’t you ever heard of a stereo? Or are your earbuds that good?

But here’s my message to whoever will listen (we’ll file these under Ari’s Friendly-if-Somewhat-Passive-Aggressive Helpful Hints to Cyclists, along with “For fuck’s sake, wear a helmet!” and “You’re riding the wrong way down JFK Street in Harvard Square in rush hour? Seriously?”): Wearing headphones on a bike is ridiculously dumb, and it’s against the law, too. When you’re in a car, what you’re listening for are sirens, car horns and, well that’s about it, everything else gets drowned out by car noise.

When you’re on a bike, you have a lot more potential to use audio cues. I’ve found that I actually can get more information as to the presence of vehicles by listening than a quick glance over my shoulder. I’ve heard other cyclists overtaking me (this happens more often on Hubway bikes than it does on real wheels), I’ve heard cars starting, I’ve heard any number of cues which affected how I cycled. And if I’d had earphones in, I would have heard none of it.

Yet so often I see people riding with earphones in. I sort-of-kind-of understand this in two situations. First, if you are a professional cyclists and your coach is telling you things in a race. Still, you don’t have two. Second, and this is the sort-of-kind-of, if you’re on a segregated bicycle facility (bike path) and there aren’t many other users and you’re going faster than them. But if that’s the case, just deal with listening to nature for a few minutes.

And a quick note: if you’re riding a fixed gear bike with no brakes, at night, not wearing a helmet, wearing earbuds without anything reflective and with no lights, only about half the things (brakes, lights, reflective) are illegal. But THEY’RE ALL STUPID. Colin Reuter made some similar points a few years back, so go read that.

Dear Mr. McGrory: stop the anti-bike/ped snark

Brian McGrory is a columnist for the Boston Globe, and someone told me he’s a good one. However, he has it out for anyone not driving their own car, I think, unless he is being very coy and sarcastic. When Hubway was launching last July, he proposed banning bikes altogether. It’s pretty tongue-in-cheek. Obviously he doesn’t want to ban bikes, but he wants cyclists to do a better job of obeying the rules. Sure, he posits that all cyclists are lycra-clad speedsters who run red lights with abandon. (We’re not.) I get the point; but there was probably a better way to say it.


But was that an isolated incident of non-driving hate? Apparently not. Today, after last year endorsing a war against bikes, McGrory rails against the war against cars. Apparently—and believe you me, I have not noticed this—Mayor Tom Menino, in declaring his support of bikes and walkers, has actually declared war on the automobile. So “the car is no longer king” is a battle cry. Right.


McGrory’s latest column is pure rubbish. It turns out Menino wants to convert some parking spaces to “pop-up parks” or “parklets.” This sent McGrory in to a rage. The mayor is crazy! he writes. And he needs to be committed.


Apparently, the lack of vehicular traffic is to blame for every problem in the Downtown Crossing area:

The car is still banned from Downtown Crossing, even while it’s painfully obvious that the hard luck neighborhood would benefit enormously from vehicular traffic. Cities around the country have turned their tired pedestrian malls back into real streets with great success.

Oh, where to begin? First of all, many of the country’s de-pedestrianized malls have been in places like Buffalo and Kalamazoo, not the most vibrant of metropolises. Pedestrian malls are going strong in cities like Denver, Burlington, Minneapolis and Boulder, and New York has cordoned off main streets in its retail core to widespread praise. Second, it’s quite possible that a lot of the issues in the area are due to a massive hole, and the mayor has been instrumental going as far as to threaten eminent domain takings (nothing says blight like an abandoned building) to speed reconstruction forwards. Third, it’s not like the retail district there is dead. While it might not hop at night, during the day the area is filled with thousands (by some counts, a quarter million) of pedestrians daily. Adding a few hundred car trips would be to the detriment of these hordes.


And it’s painfully obvious that cars along the currently-pedestrian streets would help? Apparently McGrory hasn’t ever been to Filene’s or Jordan Marsh (or Macy’s). The streets in Downtown Crossing are one-way, one-lane streets. They are busy with pedestrians, cyclists and deliveries, and trafficked streets nearby usually feature stalled vehicles waiting for lights. I’m not sure how a few extra vehicles in the area—and no on-street parking, assuredly—would be a panacea for the woes. A Wegmans or Target and 500 units of housing, on the other hand, might help.


McGrory concludes, after positing not an iota of actual data, that “the mayor is at war with the car, and the drivers are the collateral damage.” He, as we have seen, believes everyone drives, or at least, everyone ought to. I would contend that the mayor is simply fulfilling the wishes of the majority of voters who elected him. (Yes, believe it or not, Hizzoner still stands for elections.) 51% of Bostonians don’t drive to work, and only 44% drive (it was 51% ten years ago). Yet most of the real estate of our rights of way is given over to cars, even if they are a smaller fraction of the users on a stretch of road.


Maybe, Mr. McGrory, the mayor is simply acting in the best interests of his constituency. Or, at least, the constituency who has actually gotten out of their cars in the top walking city n the country. If you’d like, I’d be glad to take you on a walk and bike ride to some of the places you’d like to have teeming with cars instead of vehicles. Let me know.

Bike sharing trip lengths

For a transportation data junkie like me, one of the great things about bike sharing is that the system lets you log in and see your trips. I’ve been riding Hubway for about a month, and I’ve taken 21 trips. Of these trips, 20 have been ten minutes or less. The one longer trip was 13 minutes. At no time have I gotten even half way to the 30 minute cutoff. Over on the right is a chart of the trips I’ve taken. The frequent four-minute trip is when I jump on a Hubway at Charles and ride it across town to my office, docking it outside the building. It’s faster than taking the T another stop, fighting the crowd at Park Street and either walking the Common or taking the Green Line one stop to Boylston.

This will probably change once Hubway launches in Cambridge, especially if they manage to put a station in the park near my house (not that likely, since it’s a mostly residential area, although it is halfway between Central Square and the grocery stores on the river, so there might be good traffic to those areas; I’ve been lobbying Whole Foods by Twitter to sponsor a rack there). I figure a trip on a Hubway from home to work would take about 16 minutes, so I’d still be well within the limit. And if I were taking a longer trip on a shared bike, I’d probably be cognizant of the time limits and swap a bike in and out at a rack (you just have to dock and undock) to reset the clock and get another half hour. Fifteen seconds of my time is certainly worthwhile to save a few bucks, and most trips are bound to pass by a Hubway rack.

Anyway, bike sharing in New York City is getting readier to launch and there’s a bit of a hoo-rah about how high its marginal hourly rates are. It is worth noting that the 97% of rides which are under 30 minutes in DC, as quoted by this article, (and 99+% are under an hour) are rides for frequent users on a monthly or annual pass. Capital Bikeshare publishes a lot of data (*) on their website (from which the chart below was taken) and the number of trips under an hour, for annual users, is pretty staggering. The number of trips under 2 hours—at which point trip costs really get out of hand, is 99.83%.

The main impact of overage costs are on casual users. For casual users, only slightly more than half of trips are completed within the free half-hour time limit, and 25% of trips are longer than an hour. So these folks pay. This is okay with me, for the most part, since they basically subsidize the riders who pay $50 to $100 and ride the bikes for several months. (If I make 20 trips per month of 8 months, my $50 Hubway fee will divide out to about 30¢ per trip.)

There seem to be two types of casual user (someone buying a single- or multi-day pass). One are people who want to try out the system (or use the system) in a similar manner to a frequent user and understand fully how it works. These folks probably fall mainly within the time limit. The second group are the people using shared bikes in place of rental bikes (which CitiBikes encourages on their website for longer-duration trips). This is basically how carsharing and traditional car rental operate. For a short trip (a few hours) a shared car is most certainly cheaper than a rented one. For a multi-day trip, it’s probably cheaper to go with a rental car. Bicycles, not surprisingly, have shorter trip times, and more disparity between low-cost (or no-cost) shorter trips and quite expensive long ones.

And rental bikes aren’t that cheap. The first hour is $14. Half a day is $39. These rates are more expensive than bike sharing for the first 90 minutes, on par from one-and-a-half to three hours, and cheaper beyond that. So if you want to rent a bicycle to roll around Manhattan all day, bike sharing probably isn’t for you. But take a look at the number of trips in DC longer than two hours. It’s only about 5% (and casual users only account for 1/6th of all trips). So the number of users dinged for particularly long trips is rather small.

There’s obviously a learning curve to the pricing scheme, and a number of Yelpers in Boston have apparently not understood it (although, frankly, it’s not that hard to understand). Apparently Hubway could do a better job of communicating this, and maybe CitiBikes should as well. What I really am surprised by is how someone would take bike with no lock and keep it out in a city for five or six hours! It’s not like they’re riding a century on it. I’d have to assume that even an oblivious tourist would get scared off by Boston traffic after a while, or run out of room on the Charles River paths and make for a cafe or museum. And in New York, where most any bicycle parked anywhere is asking to be stolen, having a rental bike is a liability. With a shared bike, all you have to do is find the nearest dock and leave the bike there. No lock required. With well-placed kiosks, this should be relatively easy.

What will be interesting is how this affects revenue from casual users (looking at the data from DC, I doubt that more than a handful of frequent users will ever pay an overage fee). While casual users do not account for much of the ridership, they do provide a good income stream. It’s possible that the higher rental costs will drive away prospective users. Even with higher prices, the drop in ridership will result in less revenue from casual ridership.

However, we’re talking about New York. There are a lot of potential casual riders (tourists), so it might be good to have higher prices as a bit of a barrier to entry to keep casual users from usurping the transportation demand aspect of bike sharing. And New York tourists don’t seem particularly price sensitive. Visitors to the City are paying $300 a night for a hotel room, $150 for tickets to a show and $40 for a pre-show meal at a mediocre Times Square restaurant. At those rates, what is another $25 to ride a bike around Central Park for a couple of hours? The higher rates—especially for casual users—strike me as a good balance between keeping bikes in the system available and maximizing revenue.

* CaBi has CSV files with every trip taken, too. I’m drooling.

Transit mode share to ballparks

In a cute lede in a recent op-ed in the Boston Globe, New York and Boston sports fans were held up as examples of transit users.

Red Sox and Yankees fans can agree on one thing — how to get to the game. In New York, about 45 percent of ticketholders take public transportation. In Boston, more than 50 percent of ticketholders take the T — a percentage higher than any other professional sports franchise in any city in the country. Yet, even as hundreds of thousands pour into rail cars each season, most are unaware that the trains are running on empty.

That makes sense: parking in Boston is atrocious ($40 for a spot, and horrible traffic pre- and post-game) and in New York many fans come from The City, and those who don’t face interminable waits to get off of and back on to the Major Deegan. (Google Maps imagery of Yankee Stadium, taken just before a ballgame, shows hordes of people getting off the subway, and traffic backed up from the stadium 3 miles north up 87, and across the Harlem River in to Manhattan towards the GW Bridge, although the CBE is pretty clear.)

This got me to thinking. I profiled Minneapolis’s new stadium, Target Field, a few weeks ago, focusing in on how it was built in to a transit system which, when fully developed*, could see a 600-passenger crush load, three car light rail train leaving every three minutes in each direction. (I was biking through Minneapolis last week and saw them using three car trains after a Twins game.) I also went to Kansas City, where there is no transit service to the game, and everyone is forced to park in the huge lots surrounding Kauffman Stadium, setting up a nice little racket for the stadium owners.

I want the data. I want to plot ballpark transit mode share versus overall transit mode share. I’d love to see data on biking to the stadium. This mode is nonexistent in Boston or New York (where your bike is liable to be stolen if you aren’t hit by a driver on the way to the game) but in Minneapolis there are hundreds of bike racks and they’re full on game day (and the city is planning to complete a bike trail quite literally underneath the stadium which will enable off-street links from most directions). If anyone knows where I can get it (and, yes, I emailed the authors of that article) I’d love to know.

* The Central Corridor to the south and then east, the Southwest Corridor to the north and then southwest and the Bottineau Transitway to the north and then northwest, plus any additional commuter rail.

Why can’t we internalize the cost of commuting?

Yesterday I was biking from Saint Paul to Minneapolis at rush hour. In to a stiff headwind, which shaved four or five miles per hour off my speed—more on downhills. However, when I crossed over Interstate 94 (*) just east of the Mississippi, I smiled. Both sides of the highway were parking lots. I probably wouldn’t have gone any faster in a car.

I hate traffic. Actually, I should rephrase that. I hate being stuck in traffic. I love the concept of traffic, as long as it is not “solved” by building more roads. Livable cities have traffic. (They have transit as well. The ones with traffic and no transit, well …) I continued on a few blocks to my destination and, while I was not particularly happy fighting against the gale, I was glad I wasn’t giving myself ulcers in a traffic jam.

There have been several recent articles about the fact that people are unable to properly calculate the cost—both economically, the time cost and the emotional distress—of a long commute. It’s been called the commuter’s paradox. The long and short of it comes down to the fact that people, when making an important decision (where to live) will worry about rare, very inconvenient occasions more than frequent and not-quite-so-inconvenient-but-still-bothersome occasions. In other words (mostly those of Ap Dijksterhuis of Radboud University in the Netherlands):

Consider two housing options: a three bedroom apartment that is located in the middle of a city, with a ten minute commute time, or a five bedroom McMansion on the urban outskirts, with a forty-five minute commute. “People will think about this trade-off for a long time,” Dijksterhuis says. “And most them will eventually choose the large house. After all, a third bathroom or extra bedroom is very important for when grandma and grandpa come over for Christmas, whereas driving two hours each day is really not that bad.” What’s interesting, Dijksterhuis says, is that the more time people spend deliberating, the more important that extra space becomes. They’ll imagine all sorts of scenarios (a big birthday party, Thanksgiving dinner, another child) that will turn the suburban house into an absolute necessity. The pain of a lengthy commute, meanwhile, will seem less and less significant, at least when compared to the allure of an extra bathroom. But, as Dijksterhuis points out, that reasoning process is exactly backwards: “The additional bathroom is a completely superfluous asset for at least 362 or 363 days each year, whereas a long commute does become a burden after a while.”

In addition to the environmental catastrophe of building and heating (or air conditioning) superfluous, unused rooms, people have convinced themselves that they need this extra space, and pay dearly for it: first when they buy something larger than necessary, and then when they spend hours a day in the car because they can’t get anywhere without turning the ignition key. (Has no one heard of a fold-out bed or a hotel room? It’s a lot cheaper than a bigger house.)

The article also goes in to the issue that the worst thing about traffic isn’t that it’s bad, but that it’s unpredictable. With all sorts of technological advancements, the best we can do now are sporadic signs above the Interstate telling us how long we have left in this particular hell. With a little money, we could make the trains and buses run on time (the worst thing about a poorly functioning transit system is, generally, its unpredictability). Making traffic predictable, on the other hand, is all but impossible.

There’s another piece up recently regarding a book about car dependence. It goes in to more of the economics, that we don’t internalize the costs of driving because they are so ingrained in the American psyche. It’s really a problem, and one that will take decades to fix. Whether the current economic status (and, yes, economics, not environmentalism, will be the driver of less automobile use) or higher gas prices will make a change is yet to be seen. However, it may be a generational change, and amongst a generation of always-plugged-in folks who see time in a car for what it is—almost completely wasted—we may see more people who are less interested in driving the latest, greatest shiny new automobile.

[ * Why is I-94 bad going west? Because in the course of about three miles there is a lane drop on the right (Riverside), a lane drop on the left (35W), two horrible merges on the right (from 35W and 11th), and then a sharp curve in to the Lowry Tunnel. There are no lanes which don’t disappear or have just brutal merges. You can add all the suburban lane miles you want, but it won’t address these bottlenecks.]

Bicycling directions: Google Maps vs. Cyclopath

When Google Maps launched bicycling directions, it was seen as a boon to the bicycling community nationwide. Finally, cyclists could see directions based on roads and trails, instead of being routed by the Googles on to highways and freeways. Speculation about the directions—that it would encourage more people to bike and even might influence city planning—abounds. People from Seattle to Portland to San Francisco to New York to Boston started throwing around reviews (mixed, actually; the service still feels very beta-y) about the new feature. It’s great that Google has released this product, but it feels like it might not be ready for prime time.

Around the same time as the feature launched, the first proofs of Bicycling Magazine’s annual ranking of cities for cycling came out, and there was a new #1. The newly crowned Minneapolitans (and their Saint Paulite brethren) were not as excited about the Google Maps cycling directions. Why? Because for quite some time, they’ve had their own version: Cyclopath.

Cyclopath was developed by, what’s best to call them, a bunch of bicyclist-geeks. Long before Google entered the marketplace, Cyclopath had developed, first as a project at the University of Minnesota and then as a “Geo-wiki” (part of it is to study of Recommender Systems, and even the behavioral science behind route finding). It was developed in 2008 and released to the public in the summer of that year, more than a year and a half before Google developed their nationwide network. It’s gone through several releases  and now incorporates users opinions of various roads. While Google depends on a very analytic approach, Cyclopath provides more subjective data for users, which it seems, is more useful in the long run.

Plus which, Cyclopath’s data—since it was first uploaded—is consistently updated by its users. Find a road which has been closed? You can close it. Has a road been repaved or has it become incredibly potholed by a winter of freezing? Change its bikeability. Need to add a road? Add it in. Want to write about a long traffic light or a weird lane merge? That can be added in, easily. Google’s still in beta; Cyclopath is humming along.

In comes Google. Cyclopath likes it well enough, and doesn’t really see it as a threat, since they think they are better. In reality, they are two different approaches to the same problem: how do you get from Point A to Point B (as long as, in the case of Cyclopath, you’re in the Twin Cities). So, which is better? Let’s go through a few differences.

Quality of Route

This is the big one, let’s get to it right off. Cyclopath, with years of experience and input, rarely routes you inefficiently (you can change its algorithm, too, see below). Google Maps, on the other hand, has enough mistakes (it’s missing, for example, the Sabo Bridge and will route you on an Interstate ramp) that it’s a bit of a pain to use. But it’s not so much these glaring omissions—it’s the turns that are missing, often turns you can make in a car (try, for example, to make a left turn from Cleveland Avenue in Saint Paul to Mississippi River Boulevard)—which result in convoluted directions. And if you put in a ZIP code and Google happens to located it on an interstate, forget about non-car directions (even the car directions are bollixed up). Until these issues are fixed—and I know of half a dozen in Minneapolis and Saint Paul alone, so there have got to be hundreds nationwide—Cyclopath wins, hands down. I’m sure in cities which went from zero biking directions to Google, it’s great, but they have a way to go to catch up with Cyclopath.

Flexibility of Route Search

When you search for a route in Google maps, you get several options: by car, by transit, walking or bicycling. Within bike directions, however, you have no options. There’s no way to avoid hills, or weight bike paths higher. They have gone on about their great algorithm, but there’s no way to know exactly how it works. The algorithm is what the algorithm is. In Cyclopath, you have choices. (see right) If you want to get from point A to point B as quickly as possible, you can choose to minimize distance. For a nicer, but potentially longer ride, choose, bikeability. And you can then assign penalties or bonuses to your routes for customization.

The one aspect of route flexibility where Google wins is in the post-search environment. With Cyclopath, you usually get a good route, but if you want to change it to, say, add a waypoint (often to get it to follow a certain road or trail) it won’t let you. You have to create a new route. Of course, Cyclopath can display multiple routes at once; Google can not.

Non-cycling Data

Cyclopath sounds great, but isn’t it just a glorified bike map with directions? Nope. While Google has added a lot of secondary data, Cyclopath more than keeps up. Google has more background layers, and draws on its wide search database to show photos and webcams and georeferenced Wikipedia articles and other such sundries which clutter the map. Cyclopath has a toggle for satellite imagery (the “P” key) which loads faster. In addition, Cyclopath has a plethora of local businesses and buildings tagged, some of which have very pertinent information added (such as “bike racks on north side” or “bathrooms on lower level”). In addition, Cyclopath has future trail alignments shown as being “closed” which Google omits.

Fixing data

If you want to fix data in Cyclopath—if you find a street which is closed (even temporarily, for construction) or a new bike lane or anything else which is missing, sign up, sign up, and edit away. There’s been little vandalism (a Star Tribune article from 2008 didn’t foresee any) and editing is encouraged to keep the map’s data up-to-date. The map is relatively easy to edit (although the onus is on users to assure that the network is configured correctly). In Google? Well, there is a link to email suggestions to Google. I have—more than once—and gotten an email that they are working on it. But it still gives wonky directions for those routes. And the ability to add data and comment on the quality of roads is, well, amazing functionality.

UI

Google Maps’ UI is a thing of beauty. Going from the clunky pre-Gmaps interfaces (yes, Mapquest, we’re looking at you, at least until pretty recently) to Google Maps, back in the day, was eye-opening. Zooming, scrolling and navigating were made far simple in Google Maps, and while it may be resting on its laurels, everyone else is just catching up. Cyclopath is a different animal, and while its main interface seems a slight bit clunkier than Google Maps (no, you can’t double click to zoom and recenter) it’s very well designed for a local, bicycling website, especially one which has editing capabilities and a community feel mixed in.

The Name

No one knows what to call Google Maps bicycling directions beta. “Google Maps Bike Directions”? “Google Bike?” Everything seems, well, clunky. Cyclopath has a great ring to it.

Geographic Range and expandability

Okay, here Google wins. Google Maps bicycling (or, um, whatever) is nationwide. Cyclopath is in the Twin Cities (one of which is the top cycling city in the country). Could Cyclopath be exported? Maybe. Its creators claim that it would take a month of tech work from a rather qualified person, and that there’d still be logistical issues (or, as they put it, “unknown unknowns”).

Implications for bicycling as a whole

Google Maps may actually stymie the development of Cyclopath-like websites in other cities—who may be content with their Mountain View bicycle overlords. While Google has created a respectable product, it does little to incorporate the huge knowledge base of cyclists around the country. Road users don’t so much care whether a street surface is concrete or asphalt, and how wide the lanes are. Cyclists do—and ceding the authority to Google by default may not be in the best interest for bicycling. Hopefully both services will thrive, and Google will become more suited towards biking. In the short term, Google Maps bike directions are good for cycling. In the long term, it has the potential to be a back-burner project for Google, but one which is just useful enough that enterprising individuals don’t continue to innovate with products and services like Cyclopath.

The Verdict?

Right now, if you’re in the Twin Cities, skip Google Maps. Cyclopath will give you better directions, and may even entice you to become part of the community. And any changes you make won’t come with a ticket number.

Site, situation and planning: Target Field

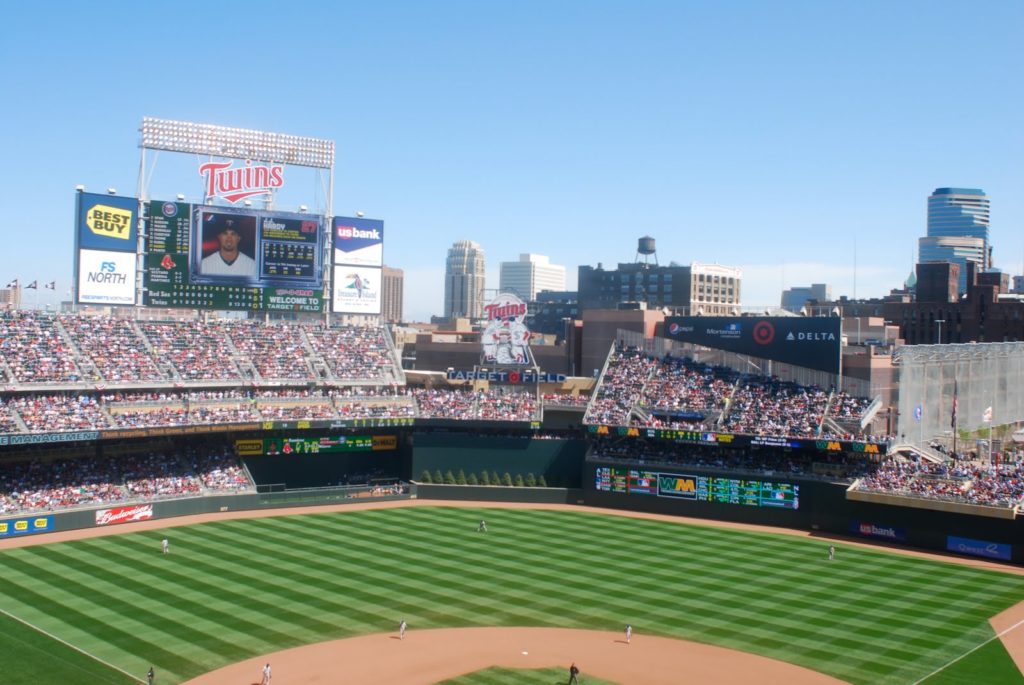
Game three at Target Field, looking east.

I managed to catch one of the games in the first series at Target Field in Minneapolis this week (my Red Sox were in town) and although the Sox lost, it was great to see a new stadium. It was actually the second in a week—I was at Kauffman Stadium in Kansas City last weekend for a Sox game (nice ballpark, in the ‘burbs surrounded by a sea of parking, and I didn’t have time to explore KC)—and it was very interesting to see how the park is sited, and how people are adapting to the new experience, both inside and out.

From a baseball perspective, it’s fun to see how people like the inside. I was born and raised on Fenway, and the Metrodome was, um, atrocious. After a Sox loss there, I was depressed. Watching my team get shellacked on Thursday, having skipped out of work, with the sun beating down and the cool breeze blowing, well, it was nice. There are some cute features (the two baseball players—Minnie and Paul—shaking hands across the river when a home run is hit or the game is won), the usual odd angles of a new ballpark, and no baggie in right field. And the view of the skyline is a great touch. Otherwise, it’s a perfectly good replacement for what was a perfectly poor excuse for a baseball stadium.

But this isn’t a baseball blog.

The geographic term “site and situation” is usually applied to whole cities or settlements, but it can really be used to describe the location of nearly any geographic feature. And with 40,000 people, Target Field (or any baseball stadium) can be described as a small city for three (or, in a Red Sox-Yankees game, four and a half) hours at a time. Basically, the site is physical characteristics of, in this case, the stadium. Situation is how it interfaces with what is around it; how it connects to other buildings, roads and transit.

Of all the arenas cities build to glorify their teams (or their selves), baseball parks generally see the most traffic. A football stadium may seat 70,000, but it only sees 10 games a year. Even with other events, such a stadium is hard-pressed to break a million fans. (There’s a good reason football stadiums are often, and maybe should be, built away from downtowns: their demand for parking does not mesh well with surrounding land uses, and moving that many people in and out can strain all but the best-equipped transit systems.) Indoor arenas, even when the combine basketball and hockey, sell out shy of 20,000, and there are only about 80 games a season. That’s 1.6 million. Add in some other shows, and you can break two million. (The Staples Center in LA, with two basketball tenants, may see more fans, although I can’t imagine Clippers games sell out.)

But baseball parks? They usually seat at least 40,000 (most new parks are around this figure). And they have 81 home dates a year. Throw in a few concerts, and you can bring more than three million fans in each year. From an economic development standpoint, baseball stadia are probably the best generator of people in sheer numbers. Even if they don’t have anything beyond baseball, they still bring in more visitors than any other arena.

Of course, the Metrodome didn’t do much for its surroundings. Much as it was 28 years ago, it is surrounded by, well, mostly by parking lots—a suburban stadium in the middle of a city (or, at least, a tangle of highway ramps). Target Field, for many reasons, may not suffer quite the same fate.

Target Field’s Site

Target field sits on a not-quite square plot of land on the northern fringe of Downtown Minneapolis. The street grid in Downtown is oriented to the Mississippi river, which flows five blocks to the site’s east. South of Hennepin, the grid is shifted slightly, but where the ballpark is located, the streets run almost perfectly 45˚ off of the cardinal directions (i.e. NE-SW and NW-SE). Before the ball park was constructed, there was a ditch between 2nd Avenue N and where 4th Avenue N would run. The southeastern half was taken up with the exit ramps of Interstate 394; the rest was a parking lot until it reaches the railroad tracks. The stadium is built above the former parking lot, with a pavilion extending above the railroad tracks.

The park is oriented due east—that is, the batter is looking straight at the rising sun and the pitcher throws the ball to the west. To fit the field in the confined location, the stadium needed to be oriented in a cardinal direction, and baseball stadiums are best located to the northeast. Baseball games are rarely played at sunrise, and this allows for the smallest chance that the sun will be in a player’s eyes. (Although there are two baseball stadia which are oriented due west—and they sometimes have to suspend play at sundown.) With baseball games starting in the afternoon (with one exception, the 11:05 a.m. start for the Patriots Day game in Boston), some parks face south of east, and some due north, but most face northeast. Here’s a great diagram of all the ballparks. And, in case you were wondering, this orientation is set forth as “desirable” in Major League Baseballs rules (1.04).

There’s another major reason for the orientation of the ballpark, but we’ll explore that in the situation discussion. Other than the fact that the stadium is built on stilts over a highway and a railroad (and, in the future, a bike path), there’s not much else exciting about the ballpark’s site, since it is basically reclaimed land (discussions of sites for cities often go on for much longer, incorporating terrain, water sources, deep harbors, rail corridors and the like). Basically, it’s a rather cramped city block in Minneapolis.

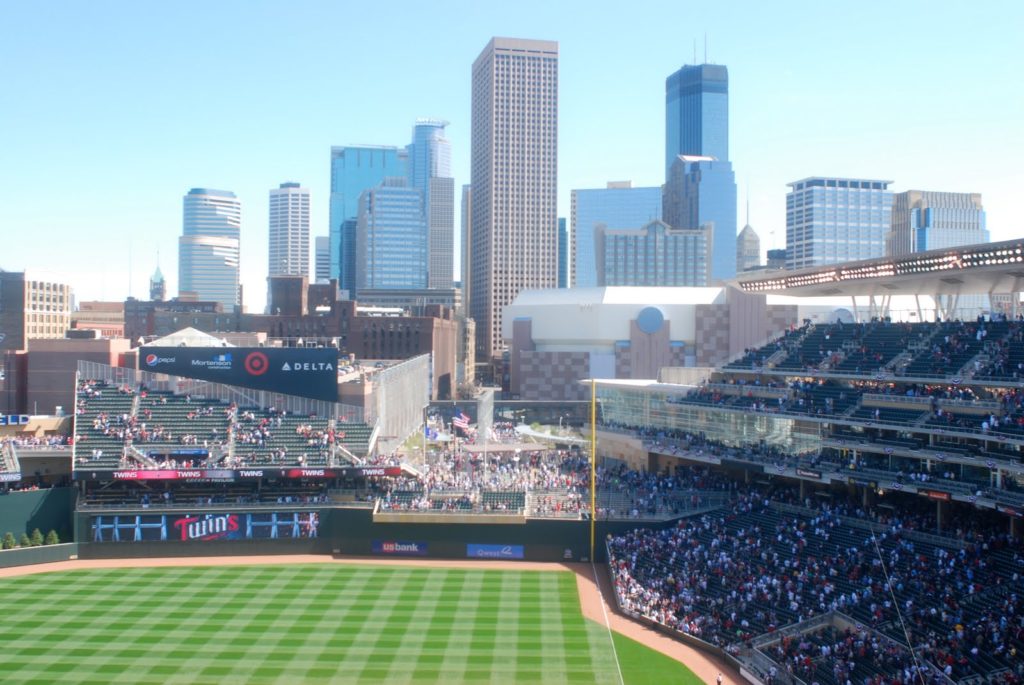
Target Field’s easterly orientation gives is a grand view of the Minneapolis skyline; it should be even better at night.

Target Field’s Situation

The situation of the ballpark—how it interfaces with the rest of the city—is much more interesting. The orientation, which is a site feature, is, perhaps, more importantly, part of the park’s situation. The reason that the park was sited facing east instead of north is the proximity of Minneapolis’s skyline—the highest buildings between Chicago and Seattle—sits to the southeast of the field. A northerly facing diamond would have nothing in view beyond the stadium’s walls. With the east-facing ballpark, several 800-foot-tall buildings loom less than half a mile above the field (and, yes, you can see in from the higher floors of some of them).

In fact, Target Field is significantly closer to the center of Downtown Minneapolis (we’ll define it as the IDS Center) than the Metrodome. As the crow flies, the nearest gate to Target Field is about a quarter mile from Nicollet. The Metrodome is more than twice that distance. There is quite a bit less surface parking around Target Field, too. Minneapolis has a lot of parking downtown, and, for the most part, these spaces are empty nights and weekends—which is precisely when they are needed for baseball. The Metrodome was almost completely surrounded by surface parking, while Target Field has only a few nearby surface lots.

This lack of surface parking is going to have several interesting effects on the parking market. First, the land near the Metrodome will lose much of its value for parking as the parking for the Twins and Vikings will be disaggregated. The Twins drew 2.4 million fans in 2009, many of whom parked in these surface lots. While Vikings fans will need somewhere to park, there are only about 600,000 Vikings fans, one fifth of the pre-2010 total. If the real estate market picks up in Downtown Minneapolis (one of the few under-construction buildings in the city is on a former parking lot near the Dome), these lots—especially the ones a bit further from the Dome—will net less cash from parking revenue, and thus be more likely to be sold for development.

Around Target Field, the parking situation is a bit more developed. Minneapolis has a many car commuters, and, thus, a lot of parking structures (and some surface parking). The Central Business District is strong enough that it is not infiltrated by surface parking, although there is a good deal on the flanks. The city operates three “ramps” (as parking garages are called here), called the ABC Ramps, which surround the field, have direct freeway access, and about 7,000 parking spaces (assuming 2.5 passengers per car, that’s half the stadium). There are, of course, dozens of other garages downtown, and even some surface parking. With the Target Center (home of the basketball Timberwolves—the hockey Wild play in Saint Paul) and several theaters nearby, the events parking market is rather well established, and there may not be a need to claim more land for parking. However, the few surface parking lots nearby will become more valuable as parking, which may hamper redevelopment efforts in the neighborhood, unless the ballpark increases their value as developed land.

The Twins, who originally played at suburban Metropolitan Stadium (now the Mall of America) have decreased nearby surface parking with each move. Their original ballpark was similar to Kauffman or Miller Park in Milwaukee—everyone drives, and many tailgate. Thirty years later, they are now playing in a very urban-feeling environment.

Target Field is also accessible by transit, and these connections are well publicized by the team and city, which hope to limit the volume of traffic around the stadium on game days. Amongst stadia with transit connections, there are actually few which are located as centrally on a transit system as Target Stadium, or at least as it has the potential to be. Stadia require quite a bit of land and, recently, quite a bit of parking, which are not generally compatible with the centers of transit systems. If you look at older ballparks (or former locations)—Fenway, Wrigley, Yankee Stadium, Shibe and Baker Park (in Philadelphia), Comiskey, Ebbets Field, the Polo Grounds—they are generally on transit lines, and far from the nexus of the transit system. Even in cities with new stadiums, like AT&T Park in San Francisco or the ballpark in Washington, D.C., the parks are generally not near main transit stations. In cities with major transit systems, land near major centers are just too damn valuable for a block of grass and stands which are only used 250 hours each year.

In other words, most baseball stadia require a transfer. They’re not near commuter rail terminal stations. They were built where there was cheap, vacant land, which, for older stadia, was usually a few miles out from the middle of the city. In Boston, this means that thousands jam the trolleys to Kenmore (when this coincides with the end of rush hour, for a 7:00 game, the trains are jammed). In New York, the two lines which serve the Stadium—the IRT Jerome Avenue Line (4) and the IND Concourse Line (B, D)—easily reach crush capacity, especially the over-capacity Lexington IRT which is already way beyond capacity (which is why they’re building the Second Avenue Subway), and the L to Addison in Chicago gets pretty full up to Wrigley.

Minneapolis has one rather-well used transit line, which was extended a stop to serve the stadium. The light rail vehicles on the line are rather large, with a crush capacity of more than 200, meaning a two-car train can carry nearly 500 passengers. Right now, the stadium is at the end of the line, meaning that fans can pour in to empty trains, and as long as the end of the game doesn’t conflict with rush hour (any weekday day games begin at noon, likely in the hopes the game will end before the height of the evening rush) and the trains should be able to clear passengers out before the rush. For 7:00 games, baseball fans will be traveling against rush hour, which is desirable. On evenings and weekends, the trains are relatively empty—the line is rather commuter-oriented—so they an be mostly devoted to game traffic. And the line was designed to stop adjacent to the stadium to allow for ease of boarding and alighting. There are no stairs, escalators or treks to the station. Many bus routes also pass nearby or terminate near the stadium.

In addition to the light rail, a new commuter rail service serves Minneapolis and stops below the stadium.  The 500 fans it can carry is small potatoes compared with the light rail (which can carry that many every few minutes) and it won’t even serve every game (it buys trackage rights from a very well-traveled section of one of the BNSF’s main transcontinental routes). However, it has large parking lots in the suburbs and special fares for ballgames, and appeared to be well-used this past week.

The line for the light rail was long, but orderly. Still, the boarding process needs to be streamlined.

There are definitely some kinks to work out. At the Metrodome, 4000 of the average of 30,000 fans came by train. Target Field seats 40,000 and should be sold out most of the season, and parking is harder and more costly; it’s presumable that upwards of 6000 fans will ride the light rail to the stadium. On Thursday, the line after the game was several hundred people long (but very orderly, as opposed to what happens in Boston or New York; it probably also meant that it was slower and that the maximum nuber of people were not filling the cars). MetroTransit had staff on hand, but did not have the vehicular capacity. In Boston, where the main sticking point is line capacity, the MBTA runs full rush-hour service before and after Red Sox games on the Green Line, and usually stores several cars in the Kenmore Loop, allowing them to run several trains outbound, one after the next, to deal with the post-game rush. Here, the line could support three car trains at three minute headways—700 people 20 times an hour—but was not utilized to that level.

MetroTransit needs to take heed. They have stub tracks beyond the station, and should have as many trains stored there as they can. With 300m of double-track, they should be able to have 10 cars—for 2500 people—stored there, although with two-car trains, only 8 cars for 2000 people may be feasible. They should then run these at three-to-five minute headways for the first half hour after the game. Additional cars stored just south of Downtown at the maintenance facility should be sent as quickly as possible, with boarding on both tracks. With the ability to run three-car trains, this would be a capacity of 8400 to 14000 per hour, more than enough to clear out the stadium traffic in 30 minutes after a game.

In the future, Target Field could become one of the most transit-centered ballparks in the country. Plans are moving forward to build the Central Corridor (to Saint Paul, 2014), and long range plans have these two lines, which will terminate at Target Field (thus doubling capacity through downtown), interlining through downtown with the Southwest Corridor (2015) and the Bottineau Transitway (to the northwest). With 7.5 minute headways (the current rush hour headways on the Hiawatha Line), 32 trains, each carrying up to 500 to 700 passengers, could pass Target Field each hour, carrying 16,000 to 22,000 passengers—more than enough capacity for the ballpark, and a capacity rivaling the transit capabilities of Fenway and Wrigley.

With ample parking in place and the possibility of increased transit service, Target Field may do a better job of drawing nearby development than the Metrodome. The Dome is in a no-mans land. It is surrounded by parking on all sides, and by freeways in two directions. Once transit showed up in 2004, its days as a baseball stadium were all but numbered. Target Field helps connect Downtown Minneapolis to the North Loop, a hodgepodge of new lofts, hip restaurants, and still-operational warehouses. It has a bit of parking, but most of this is a good distance from the ballpark, much further than the huge ramps nearby (thus, its value as parking won’t increase dramatically with the new ballpark). There is a rather obtrusive highway offramp between the stadium and the North Loop; however, if it were dismantled, would yield a plethora of developable land with half a mile of the Mississippi River, Downtown, transit and bicycle facilities. It is also slated to have a line of Minneapolis’s proposed streetcar network pass through it. The North Loop could benefit greatly from being linked to downtown by the park, which bridges the former two-block-wide trench between the neighborhood and the downtown with rather wide pedestrian concourses, and be further developed as a transit-oriented, mixed-use neighborhood, where there are currently underutilized light industrial plots or warehouses within a mile of downtown.

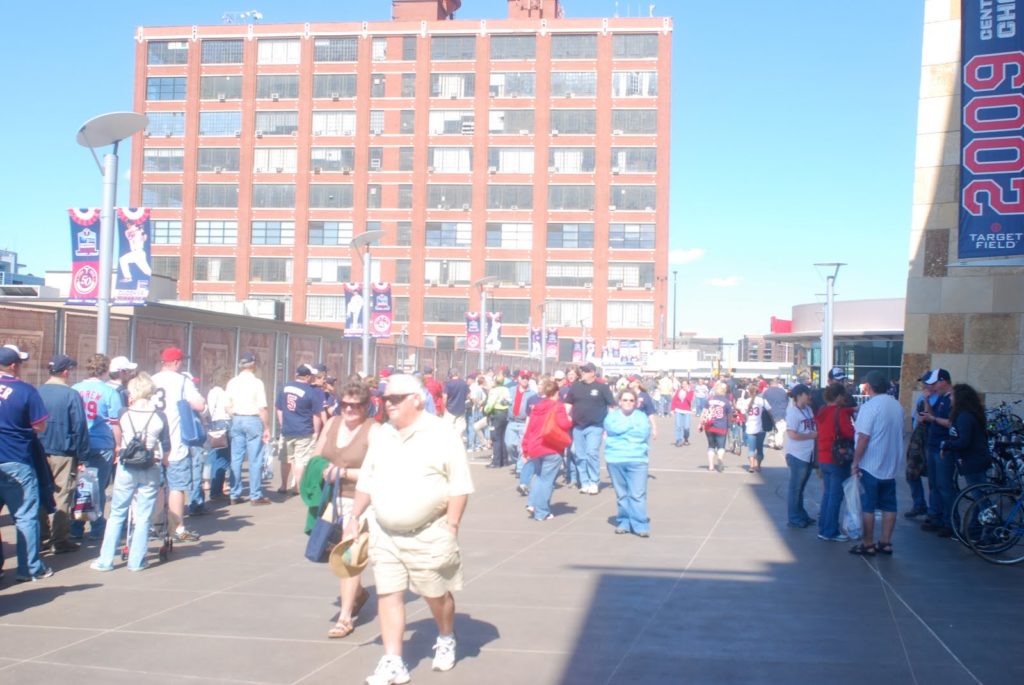
Finally, with Minneapolis currently the top bicycling city in the country, I’d be remiss to not mention the stadium’s situation regarding cycling. And walking. As far as walkability, the ballpark is a few blocks from Hennepin and, while not connected to the Skyway system (which are used more in the winter than summer) it is better connected by sidewalks and by the new pavilion built between the ballpark and the Target Center.

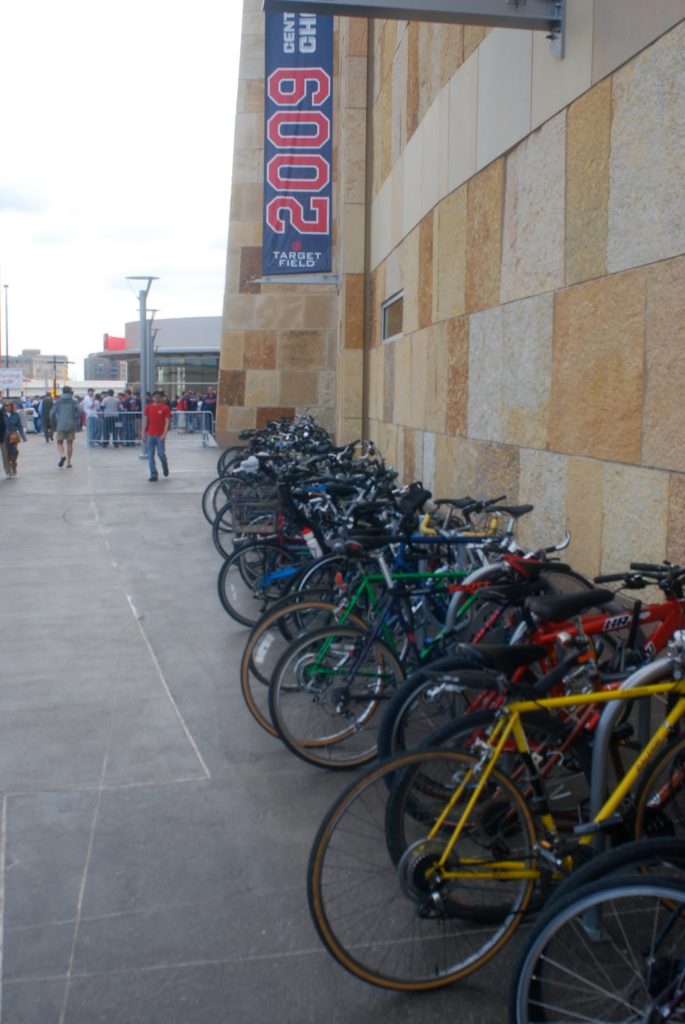
Ten minutes before game time (and ten minutes before the sun came out), the bike racks at the field were full, even though it had rained lightly in the morning. Several other similar racks line the stadium walls.

As for cycling, Minneapolis probably has more people who bicycle to baseball games than any other city. The bike racks at the Metrodome, which was actually located near more bike trails than Target Field, were always well used, but they were tucked away on one side of the building, away from most of the trails. The field is surrounded by bike racks (map [pdf]), including racks which line the northwest promenade of the field—built over the railroad tracks—and when I visited this week, they were all packed. Perhaps the Twins need to install some more.

In addition, the Cedar Lake Bike trail, which extends in to downtown from the southwest, is being extended under the ballpark. It will connect the bike trail along the Mississippi River to the stadium, and allow grade-separated bike access to the stadium, avoiding foot and car traffic. With these improvements, the bike facilities near Target Field will be unparalleled in the major leagues. (And, no, when I was living a similar distance from the ballpark in Boston, I never even thought of biking to Fenway.)

With easy transit options (a bus straight from my house; a nice bike ride along the river) and a lovely field I do want to see at night, I’ll be back.

Is bike sharing the “last mile” for car sharing?

A lot of hay is made about the “last mile” in public transport. Unless you live right at a bus stop or train station, your walk to the bus is going to be further than your walk to your car. (The term last mile derives from many other applications, such as communications and logistics, where the connections from end users to the main network are the least efficient, and thus most costly, to build and keep up. In transportation it relates to moving users from their origins and destinations to the nearest transit infrastructure.)

It’s an issue for car sharing, too. Even in the densest car sharing cities, many users live a few blocks away from the nearest shared car. (In these cities, of course, owning a car is generally very expensive and inconvenient, so the marginal gains from having a car right out your door are offset by the cost of a reserved spot or the time cost of circling the block looking for an unreserved one.) A car sharing network can be seen as similar to a transport network, with various access points spread across a region. With transport, the last mile is actually on both ends—getting from your origin to the network, and from the network to your destination—while with car sharing there is only an issue getting from your origin to the network as you then drive to your destination, so perhaps it’s more of a first mile issue. Still, it’s very similar—while there’s no hard research that I know of, anecdotal evidence is such that most car sharing users are willing to walk a quarter mile to a shared car, tolerant of maybe up to a half mile, but not very interested in going much further than that (similar to transit users).

Bike sharing may help to change that, by lengthening the distance people can travel to other modes. It fits in to a rather specific niche of the transportation network, for trips of between about 0.5 and 1.5 miles—trips that would be too short to bother with transit but too far to walk quickly. If bike share access is seamless and dependable—as is its goal—it can rather well fill this piece of the transport network. So before we look at how bike sharing and car sharing may interact, we should try to imagine where, exactly, bike sharing fits in.

In Europe, bike sharing has started up in the densest of cities—Paris (which is nearly as dense as Manhattan), Barcelona, Copenhagen—as well as many others. In North America, the first cities planning bike sharing systems are not necessarily the densest. Montreal, which is home to the successful Bixi system, is about as dense (11,000 persons per square mile) as Philly, although less-so than San Francisco (17,000) or Boston-Cambridge-Somerville (14,000). Boston is planning a system this year, as are considerably less-dense Minneapolis (7000) and Denver (4000), although, of course, the networks there will focus only on the densest portions of these cities. In a Paris, or even a Montreal or Boston, bike sharing will probably replace some trips made by transit or walking (or even short bike trips), but may not be as much of a driver of providing links to different modes, as transit is generally readily available. In the other cities, however, this may not hold true.

So there are basically two levels of cities implementing bike sharing. One is the dense city (>10,000 with a major fixed-guideway transit system and a large existing car sharing network: Boston, Montreal, Washington D.C., Paris, San Francisco …). The other is a less-dense city with a small fixed-guideway system and a fledgling car sharing system (Denver and Minneapolis, so far). Portland, which will likely join the bike sharing fray in the next couple of years, would fall in between, with its maturing transit system and a rather large car sharing market.

What bike sharing is best for are trips of a relatively finite distance, and it seems to vary based on the type of city (and which other transit modes are available). For trips significantly less than half a mile, you’d walk. The extra time it takes to get a bike and return it, even if there is a station right each end of a trip, is made up by the fact that by the time you got the bike, you’d be well on your way by foot. For trips longer than two miles, you’d likely want to ride your own bike (faster and more comfortable, but with a bit more overhead of storing a bike, carrying a lock and locking the bike) or ride transit (ditto, depending on the route), or use a shared vehicle. So bike sharing’s market is between about a third of a mile and a mile and a quarter (if you don’t mind locking your own bike) or a mile and a half (if you do)—perhaps a tad longer in cities without dense transit networks. Beyond that, biking, transit, a taxi or a car make sense.

So, how does it break down. Well, I made the following assumptions:

Denser city Less dense city
Mode MPH Overhead Mode MPH Overhead
Walk 3 0 Walk 3 0
Bike share 8 4 Bike share 8 4
Bike 12 7 Bike 12 7
Transit-slow 15 10 Transit-slow 15 12
Transit-fast 25 15 Car share+BS 20 
Car (Share) 20 10 Car (Share) 20 12
Taxi 20 6 Taxi 20 6
Trans-fast+BS 25  12  Transit+BS 15 10

MPH is, of course, miles per hour once using that mode. Overhead is the amount of time it takes at the beginning and end of the trip to get to the mode from the origin and from the mode to the destination. Walking has zero overhead. Bike share was estimated to have four minutes (a minute to the kiosk and a minute getting the bike on either end; this is probably a lowball estimate). Biking seven minutes: three minutes to get your bike out of storage, two minutes to lock it at the end, and two for incidentals (shoes, helmet). Transit-slow is for local routes, which are probably a shorter walk, transit-fast for faster routes (such as a subway) which are generally further away. Car share overhead is to walk to the car and unlock it, and adding Bike share (BS) to a mode can cut down on the walking time.

Bike share only makes sense in multi-modal situations in a few scenarios:

  1. In denser cities, to access faster transit. For longer trips, riding a shared bike a mile to a faster transit mode (say, a subway instead of a bus line) can allow most of the trip to be at a faster speed, and make the overall trip faster. Since most, if not all, transit stations served by bike sharing will have kiosks, this makes sense. In addition, it may allow users to travel to another transit line of the same level of service and eliminate a transfer, but, to keep things simple, these models don’t really look at transfers.
  2. In less dense cities, car sharing, which is quite dense in large cities, is a bit more diffuse. Thus, many potential car sharers might live more than half a mile from the nearest shared car. In Minneapolis, every HOURCAR in the initial service area will be within about 100 feet of a bike sharing kiosk, so dropping off the car is easy, and it may allow people a bit further away to access the vehicles. And bike sharing is much easier, here, than riding your own bike because you don’t have to bring a lock and lock it up (and worry about it)
  3. In less dense cities with less dense transit networks, it may make sense for some people to use bike share to access slower transit routes, especially if they live far from a route with frequent service, although in areas served by bike sharing, route networks are rather well established.

This perhaps, is best visualized by charts showing the time various trips take, based on the speed and overhead in the tables above.

The first chart is for denser cities, the second for less dense ones. For a given distance, the line nearest the bottom is the fastest mode. Cost is not taken in to account, but any orange or yellow line is a pay-per-use mode (taxi, car sharing) while any other line is a mode which is unlimited use, assuming most frequent transit and bike share users will have a monthly or yearly pass, so the marginal cost of each trip is zero. Dashed lines are variants of a mode with bike share added to the start or end of the trip to reduce overhead.

So in a dense city, where does bike sharing fit in to the picture? Well, assuming, for a minute, that we discount taxis (fast but expensive) and car sharing (expensive, fast, and not for short trips unless there is parking at the other end), bike sharing makes the most sense between about 1/3 miles and 1 mile if you have a bike of your own (or don’t mind locking said bike) and 1.5 miles if you would otherwise rely on transit. Considering that nearly half of trips are less than two miles from home, that’s a pretty big range—more tan a tad under half a mile and you’d walk, beyond two you’d take transit. However, bike sharing is generally only marginally faster than other options. Walking takes over for transit for trips much longer than 3/4 of a mile, so bike sharing will generally only ever save three to five minutes. So it better work well.

The other factor here is bike sharing and the faster transit network. What I mean by faster transit are generally grade-separated fixed-guideway modes (subway, proper light rail) but could also be express buses on highways. These lines are generally further apart than slower bus lines, so fewer people live within easy walking distance. In the chart above, for trips under three miles, it makes sense to take the bus (assuming it’s five minutes closer than the train), but if bike sharing can shave just a few minutes off the walk to the station, the train—which is more energy efficient and can more easily accommodate higher passenger loads—becomes a better option at distances of just over a mile—right about where bike sharing leaves off.

(Yes, it appears that bike sharing will actually make transit faster than driving at one point, but for very long distances, at least outside of rush hour, car sharing’s speed would be higher as drivers would access faster roads. This line should probably be curved (as should others) but that’s not really necessary for these simple simulations.)

In other words, imagine the following scenario: You live a block from a bus line, and the corner with the bus stop has a bike sharing kiosk. The bus line runs three miles to your office, or a store, or some such destination. You also live near a train station which has a line running to the same destination, but it’s a half mile walk from your house. Let’s assume that the bus and train have the same headways, that the bus runs at an average of 12 mph and the train at 25. Right now, your options are to walk to the corner, catch the bus, and ride 15 minutes to your destination; or walk ten minutes to the train, catch it and ride 7.2 minutes to your destination (17.2 total). With bike sharing, you can now ride at 8 mph 0.5 miles to the train (3.75 minutes), spend a minute at each end retrieving and returning the bike, and ride the 7.2 minutes, for a total of 12.95 minutes. So you save 2:03 versus the previous fastest mode time. It’s not a lot, but it’s a small advantage.

Of course, no transportation network is this cut and dry—but this is at least a way to imagine where bike sharing fits in. This summer, for instance, I wandered through Paris for a day with my family. We had two choices: the Metro or walking. Bike sharing was out because we didn’t have the proper credit card and my mother was scared of cycling through traffic without a helmet, and we didn’t know enough about the bus system to use it. (Taxis would have been an option, but they are expensive, slow—buses often have reserved lanes—and my family is cheap.) Had we had access to bike sharing, trips between half a mile and a mile and a half would have been easier and faster by Velib.

Now on to less dense cities. Here, the niche for bike sharing is similar, and maybe even larger, as we can assume that bus and transit service is a bit harder to come by. Bike sharing makes sense from about a third of a mile,  but this time is only exceeded by transit for trips greater than two miles. (This is due to the assumption that frequent bus routes are a bit less prevalent in these cities; living right near a good bus route would obviously change this equation.)

But it also shows the other advantages of bike sharing in these cities. First, bike sharing increases the utility of transit. It’s not a big difference, but with a more dispersed route network, we can assume that bike sharing allows a few more residents to live within “easy travel distance” of said routes. (Although this may be confounded by most bike sharing locations being near bus lines.) If this is the case, it makes transit faster than bike sharing around 1.5 miles—if a shared bike is used to access the bus.

Then there’s car sharing. While cities like Boston and Montreal have robust car sharing networks, Minneapolis and Denver don’t. In Boston, for example, there are entire neighborhoods where every resident is within a half mile—or often less—of not one but many shared cars. This just isn’t the case with Minneapolis and Denver. If bike sharing can be utilized heavily in these cities—and without as much competing transit there is a bit more of a market to seize—it could be the missing link to shared cars. These data assume that the time needed to access a shared car would drop from twelve minutes (±1/2 mile walking at 3 mph plus a minute to access the car) to seven (±1/2 mile biking at 8 mph, plus two minutes to get and return the bike, a minute to walk to the bike and a minute to access the car).

If there are bike share locations in locations other than car sharing locations (as is the plan, at least, in Minneapolis), they will allow people who may live a mile from a shared car to get to the car in eight or ten minutes (biking) instead of 20 or 25. This is the proverbial “last mile.” In less dense cities with higher car ownership, it is not always possible to support a shared car on every block. We’ll see if this becomes the case, but it is possible that a symbiosis will develop between the two shared transportation modes where bike sharing will allow a substantial increase in the reach of the car sharing networks in Denver and Minneapolis.

In lane markings, paint does matter

I had a bit of a treat riding to work today: new paint for the bike lanes on Summit Avenue. Summit is the main east-west bike route west of downtown Saint Paul, extending from the top of the hill near the cathedral to the Mississippi. It is quite well-used, both by recreational cyclists and commuters, and is straight, relatively flat and in decent shape.

The lane markings weren’t disappearing completely (although notice the rather invisible bike stencil, which has not been repainted), but they were getting dull. I wish I had had my camera when they had painted only one of the lines anew; still, the new markings are very noticeable. And I believe it makes a difference. Drivers are more likely to notice the bike lanes, and more likely to look for cyclists; thus, cyclists are more likely to feel safe as they bike. And since a local cyclist was hit—and I saw him down moments later and am still surprised he was not badly hurt—when riding in one of these lanes by a turning vehicle, the more visibility, the better. In other words, well-painted lines will help drivers to look twice for bikes.


Now if they would only plow the lanes properly in the winter, and not let them become an icy mess.

[We’ll have a long post regarding segregated bike lanes soon]

Bike 1, Car 0

When we left the Nook on Tuesday, my housemate and his girlfriend got in to their car and I straddled my bike. As we sat at the first traffic light, I realised that I needed my headlamp was in my bag, so I fumbled for it and put it on. As I did, he yelled out the open window “get a car, hippie!” I took this as an invitation to race.

I knew I’d have a tailwind and that if the lights behaved I had a chance. I roared down Hamline, almost keeping pace with traffic at 28 mph. At Saint Clair, I rolled to his left to take a left as he waited for the light to change, tapping his windows as I rode by. He yelled the name of a baseball player we’d been trying to remember (Nick Swisher, a current Yankee mentioned in Moneyball, which he is reading) and, with no traffic at 10:30, I hung the left and made for home.

One stop sign later, I rolled to a stop at our corner, pumping my fist as I did so as he was still half a block away from home. The moral of the story: cars may have some advantages over bikes, but they are not necessarily always faster.


View Untitled in a larger map