Does your transit system have a pulse?

In this post I’ll describe something which is probably unfamiliar to big city transit system users, but which is very familiar for those who use smaller systems: a pulse. A pulse is a timed transfer between multiple routes in one location (or, in some cases, multiple locations) where buses wait for each other in order to allow passengers to transfer between them. Large systems with complex networks generally don’t use pulses both because of the complexity of scheduling and bus frequency: a transfer will often only mean a few minutes’ wait. But with 30- or 60-minute headways on many smaller systems, a pulse is an efficient means to create a usable network.

There are four requirements for a pulse system to be feasible:

  • The system must be small enough. With more than 15 or 20 routes, the complexity of scheduling every bus to one central point will overwhelm the pulse savings, and may also result in inefficient and overlapping routings to reach the pulse location. Some large systems may have pulse features in peripheral locations, or certain times of day.
  • A convergence of routes. Trying to schedule multiple pulse meets at multiple locations is quite complex, and mid-route meets are operationally inefficient since buses usually need a few minutes of schedule padding to allow for variances in travel times. Most pulses take place at a central location where multiple routes lay over. So a network needs to be focused on a single location.
  • Minimal traffic. Pulse networks are based on buses keeping their schedules. In cities with heavy traffic, unless there are busways, a bus that is delayed for five or ten minutes may result in the rest of the pulse being delayed, or passengers missing transfers.
  • Not too much crowding. Crowding on transit is generally a good thing, since it means that people are using the system. Too much crowding, in addition to passenger discomfort, leads to slower run times which, much like traffic can cause a pulse network to break down. In addition, crowding shows that more frequent buses are needed, and pulse networks provide coverage and predictability, but are not easy to scale, because to change the headways on one route, you need to change the headways on all the others.
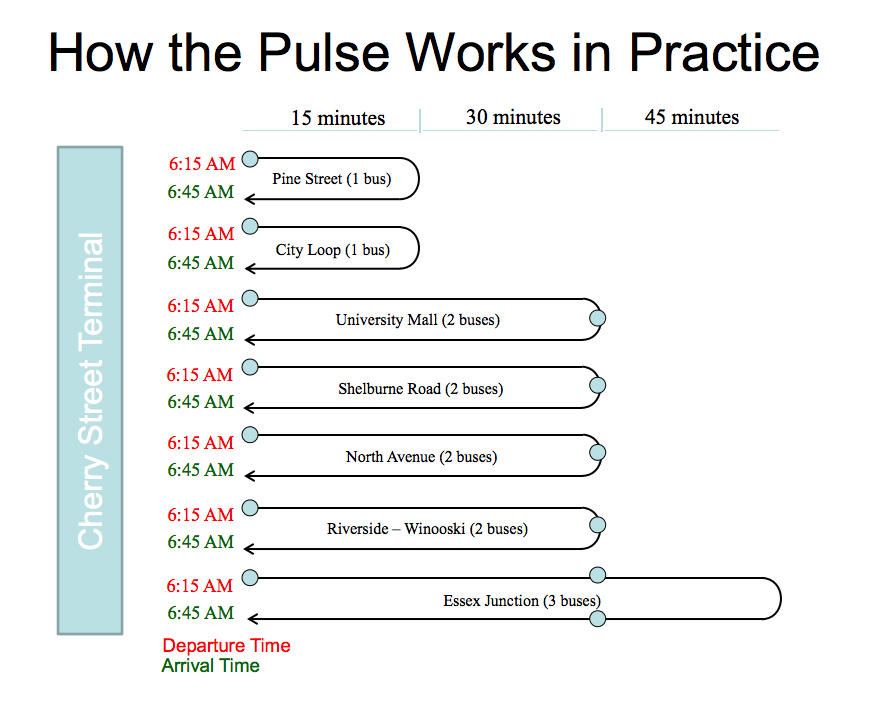
  • Burlington, Vermont’s 30-minute pulse system shows how routes of
    different lengths operate with different numbers of buses; this is
    more difficult with an hour headway pulse.
  • Routes have to be similar in length. Pulses work best when a single bus can make a roundtrip in an hour, including schedule padding. Issue arise when, say, a destination is 28 minutes of schedule time from the pulse location. You can’t feasibly run it with one bus, since if that bus is at all delayed it will either delay other pulse buses or cause missed transfers. But putting two buses on the route is a poor use of resources, since each bus will now lay over more than half the time. So an hourly pulse network works only with routes where most round trips can be completed in under 50 minutes, and where others are long enough so that resources don’t sit idle. This is less of an issue with 30 minute pulses, as routes can be shorter and still align with the pulse.
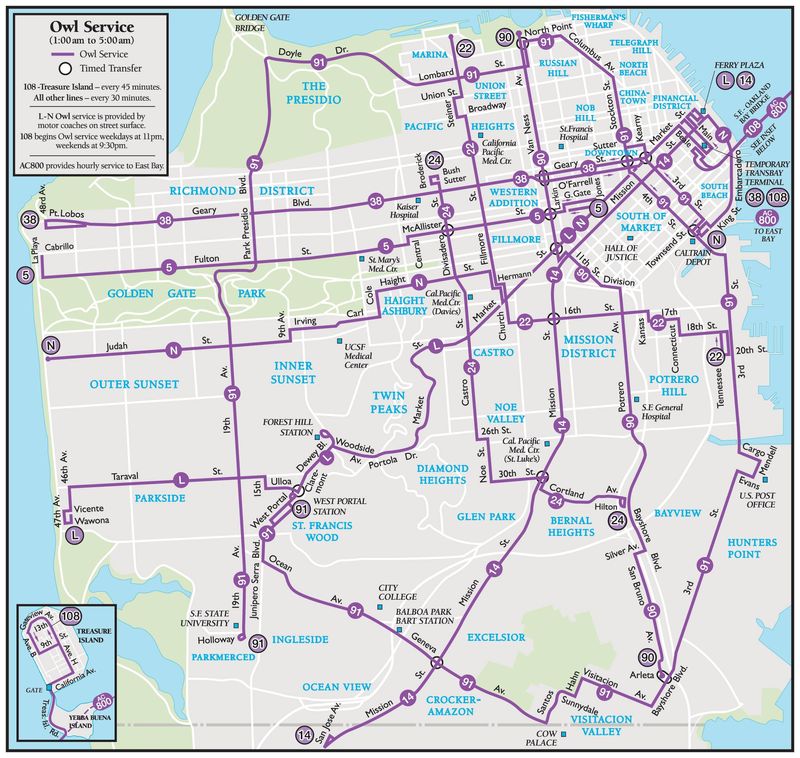
San Francisco’s late night transit services involve a series of timed transfers.
Where are pulse networks run? Pretty much everywhere. For instance, many of the regional transit authorities in Massachusetts run pulse networks, even if they don’t advertise them as such. For instance, if you look at the schedule for nearly every bus in Brockton’s BAT network, it will leave the “BAT Centre” (or the BAT Cave, and after it receives the BAT signal; the Centre has received high praise from Miles on the MBTA; another feature of a pulse system is that it makes it worthwhile to invest in central infrastructure since all routes serve it) at exactly the same time. Buses pull in, passengers transfer, buses pull out. Simple.
Once headways drop below 20 minutes, transfers become very, very difficult if they’re untimed, which is why pulse systems make sense in lower frequency networks. Most of the time, transferring between subways in New York means waiting only a couple of minutes for a train. But after midnight it is often an exercise in futility if you have to change lines, since you may spend as much time waiting in a station for up to 20 minutes as riding the train. Without information on departures or guaranteed transfers, even the country’s only full-service 24-hour subway loses much of its utility.
Jarrett Walker has a good if somewhat wonky description of how a pulse system works here, as does this presentation from the Chittenden Country Transportation Authority (in Burlington, Vermont, where I stole the graphic above). Even San Francisco gets in on the pulse system, for it’s late night service most buses start in a single location, and a few other timed transfers are accommodated as well. In Boston, the transfers to the 117 downtown during early morning service are a proto-pulse, although with a more robust overnight service, a pulse would make more sense.

Burying the lede: Caltrain saves money vs driving, not Uber

There’s an article about a woman who replaced her car (well, SUV) with Uber and how much money she saved. A lot of the variable costs were from her commute “from home to KP in Menlo Park was 70 miles round trip and I’d go down to the office 2–3 times a week.” That’s quite the commute to do by Uber.

She spent $4700 on Uber last year.

The cost of an Uber from Sand Hill to San Francisco is $51 to $68, without any surge. An average roundtrip would cost $120. So if you did this two to three times per week for a year it would cost $15,000. It’s pretty clear that she’s not replacing Uber trips with car trips, or she wouldn’t have made it to May. So without a car, how does she get to Menlo Park?

By train, of course. Caltrain runs a nice service south from the City, with frequent trains, many of them express. She uses Uber on either end (you know, there are these bike things, and buses, but those are hard). So there’s probably an $8 Uber ride on either end, and the other $104 are on Caltrain (40 minutes, generally faster than traffic). Except it costs $13.50. So the whole commute costs $30, or ¼ of the cost of riding Uber both ways, all of the savings from transit.

Taking Uber both ways would cost 50% more than driving. So that doesn’t work. What she really means to be saying is “I started taking transit for the majority of my commuting miles and saved a ton of money.” The Uber use helps the transit work in this case, but it’s Caltrain that is the main reason this works, not just Uber.

Don’t use bus routes to subsidize malls …

especially if the mall isn’t the final stop on the route.

I recently had the pleasure of riding the entire route of the 34E, one of the MBTA’s longest bus routes. The route starts in Walpole Center, makes a beeline to Washington Street (which extends from Boston to Providence) and runs in a straight line to Forest Hill Station. A straight line, that is, except, for a bizarre figure-eight loop through the Dedham Mall. The loop-the-loop to access the mall unnecessarily lengthens the route, costs the T money, costs passengers time, and subsidizes private development, all to service the front door of an auto-centered development.

Instead of continuing on Washington Street, the mall loop takes 8 or 10 minutes as the bus leaves the street, navigates no fewer than eight stop signs and traffic signals, makes two separate looped turn-arounds and traverses the same intersection three times. The route is scheduled for a full hour for the 14 mile trip from Walpole to Forest Hills, so the detour through the mall accounts for 13 to 16% of the total run time, all to serve two stops (out of more than 80 total on the route) which would otherwise require a 2 to 5 minute walk.

In other words, for riders wishing to get to the Dedham Mall, it would likely be faster if the bus ran straight on Washington Street and they got off and walked in to the mall, rather than taking a circuitous route to be dropped near the door. And for everyone else, it would save 8 to 10 minutes each way of not riding through the mall parking lot.

I rode the route on a weekday evening a few days before Christmas. This should have been a high water mark for people using the 34E to get to the mall. While my bus was full—there were probably between 45 and 50 passengers on board at any given time (and probably 70 or more served along the route)—only two or three got on or off at the mall. So, in order to serve this small number of passengers, the rest of the bus had to loop in and out and in and out of endless parking lots and driveways, because front-door service to the mall is apparently required.

From HumanTransit.org

What is particularly irksome is that in this case—and it’s not isolated, but, at least in Boston, perhaps the most egregious (the 350 serves the Burlington Mall with a similar detour, but much closer to the terminus of the route, meaning that many fewer passengers are inconvenienced by the route’s detour)—is that anyone who rides the bus past the mall has their trip dramatically lengthened (how dramatically? 18 minutes a day, five days a week, 50 weeks a year adds up to 75 hours of extra time on the bus annually). Jarrett Walker talks of “being on the way” and the mall is decidedly not; the 34E takes what should be a straight-line transit trip and degrades it to a mall circulator, despite the thousands of passengers who ride the bus daily.

In addition, running service via the mall requires several hidden subsidies which degrade service and provide a perverse incentive for people to drive instead of use transit. This one, in turn, further subsidizes the car-centric mall over pedestrian-oriented business districts, several of which are served by this route. There is also the direct subsidy to businesses at the mall. If I open a store on a street near an existing transit line, I would not (and should not) expect the transit agency to reroute the transit line to provide a stop at my front door. Yet we provide this service to the mall.

This subsidy can be quantified, in fact. The T doesn’t break down service between the 34E and the 34, but let’s assume that slightly more than half the passengers on the route are carried by the 34E (looking at the total number of vehicles on the route at different times of day)—or about 2500 passengers. The route costs $3.09 per passenger to operate (66¢ average bus fare paid plus $2.43 subsidy), or a total cost per day of about $7725. If we calculate 15% of this approximately $1150, meaning that over the course of a year—even given lower service levels on weekends—the cost to serve the mall is well north of $300,000 per year. [Update: these numbers may be somewhat lower given that morning service—before the mall opens—and some peak evening rush hour trips do skip the mall.]

Here’s another way to look at this: currently, the 20 minute evening headways on the 34E requires 6 buses running the route in about (or just under), each bus makes a round trip in two hours. If the run time were reduced to 51 minutes by omitting the mall, the same six buses could make seven round trips, reducing headways and, thus increasing capacity on the route. If you could get it to 50 minutes, the same headways could be maintained with 5 buses, which would save 1/6 of the route’s operating cost while providing the same service. But, instead, we provide service to the mall, at the expense of everyone who isn’t the mall.

What to do? Make the mall subsidize the route—yes, to the tune of $350,000 per year—or have them build an ADA facility from Washington Street to the mall. The extra cost of running this route in to the mall for 10 years could buy a very nice set of bus shelters, crosswalks and a ramp from Washington Street to the mall’s front door. Another option would be to run the 34—which ends its route nearby—to the mall, instead of putting this joggle in the middle of the 34E. While it might not have the same cost savings, it would at least not have the effect of costing thousands of passenger hours each day. Or, abandon service to the mall all together. Malls are dying, anyway, and it should not be the business of public transit agencies to help prop them up.

No need to duplicate transit on Comm Ave

NB: This got picked up on Universal Hub and there are a bunch of comments there. I’ll respond to comments in both forums, but probably here more. One note of clarification: I’m not saying that this should be the plan, but that it should be considered. Like much of the Commonwealth Avenue project, the planning process has been opaque and has had no public input. Also, this comment is a great illustration of what you could have.

The Boston Globe recently ran a story about proposed changes to Commonwealth Avenue. Of issue is that while Comm Ave is wide, it is not infinitely wide, and the changes will widen the transit reservation (mainly for safety for track workers, presumably this would also allow for wider stations), narrowing the rest of the road enough that the city is reticent to add cycle tracks, because it would narrow bus stops, and stopped buses would delay vehicles. (I’m just going to touch on the fact that there really shouldn’t be an issue with delaying traffic in favor of buses, bicyclists and pedestrians, but that’s not the scope of this post.)

What I am going to point out is that all of these issues could be mitigated by moving the 57 bus route and the BU buses to the center reservation of Comm Ave with the trolley tracks. This would result in the removal of bus infrastructure from the sides of the street—buses could instead stop at the same stations as Green Line trains. While this would be novel for Boston, it has been used in other cities, and while it could result in delays for transit riders, with better stations and transit signal priority, it would result in a better experience for all customers.

There are a variety of benefits from such a plan:

  •  Buses would move out of mixed traffic, resulting in fewer traffic delays for buses (especially at the busy BU Bridge intersection) and fewer conflicts between buses and traffic.
  • The duplicative infrastructure of having parallel bus and trolley stops would be eliminated. In their place, larger, more substantial stations could be built in the center transit median.
  • Instead of waiting for either a bus or a trolley, riders could board “whatever comes first” for short trips between Packards Corner and Kenmore Square, and riders wishing to go further east than Kenmore could take a bus to Kenmore and transfer down to a B, C or D car.
  • Removing bus stops would eliminate the conflict with buses pulling across the bike lanes when entering and exiting stops.
  • Removing bus stops would allow for more parking spaces to be added to the street. The number would be small—probably in the 12 to 18 range—but not negligible, and would assuage the (dubious) constant calls for more parking in the area.
  • In addition, there would no longer be issues with cars and taxicabs blocking bus stops, requiring buses to stop in the travel lanes.
  • Wider stations would better serve disabled users, with higher platforms better allowing wheelchairs and other disabled users to board and alight transit vehicles.
  • Narrower side lanes (parked cars are narrower than buses) would allow for more bicycle and sidewalk space, including the possibility of cycle tracks.
  • Without bus stops, there would be no need for bus passengers to get off of buses and cross a cycling facility.
  • With signal priority implemented, transit travel times through the corridor could be improved for bus and trolley riders.

The main reason to not to do this is that it hasn’t been done before. The cost to pave the trackbed—and to pave it well—wouldn’t be negligible, but since the entire corridor is under construction, it would be feasible. There would have to be some study to see if the number of vehicles would cause congestion in the transit reservation.

Additionally, there would have to be a specific signal to allow buses to enter and leave the corridor at each end of the corridor—especially the east end where they would have to merge back in to traffic. However, the 57 bus would only have to merge in to and out of the left lane since it then accesses the busway at Kenmore, which is in the center of the roadway. This could be attained with a signal activated by the approaching vehicle—again, a novelty in Boston, but by no means a procedure without global precedent.

The B line has 26,000 surface boardings, most of which travel to Boston University or through the campus and in to the tunnel. The 57 bus adds 10,000 more, and the BU Bus serves countless others. There are tens of thousands of pedestrians in the corridor, and thousands of bicyclists—it is one of the most heavily-traveled bicycle corridors in the city. Yet we are planning for cars—minority users of the corridor—first, when we should be planning for transit first (by far the largest user of the corridor by the number of passengers carried), then bicyclists and pedestrians. Cars should be an afterthought, put in to the plans after other users have been accommodated, not before. Of course, had the old A line never been converted to buses, Commonwealth Avenue would not host any MBTA services, and wouldn’t need any bus infrastructure. But that battle was lost 45 years ago.

Take the (train/bus/car) to the ballgame

When the whole melee about Cobb County Braves broke last month it got me thinking about a long-thought project of mine: calculating travel mode share to baseball parks. Ballparks see the most visits of any sport (a multipurpose arena with hockey and basketball only has as many home games as a baseball team, with half the capacity), and ballparks are often (although not in the case of the Braves) seen as means to revitalize downtown areas.

So, I created a chart of each stadium, and how far it was from various transit modes. And then I mapped it out:

Green shows transit options within ¼ mile, or a five minute walk. Yellow is within ½ mile (10 minutes) and red within a mile (20 minutes). Note that bus stops more than half a mile form the stadium are not shown. Here is a Venn-ish diagram of the same data:

A few notes:
  • 28 ballparks lie within half a mile of some transit option. (The exceptions: Arlington, Texas—which doesn’t even have transit within the city limits!—and Kansas City, have bus stops less than a mile away.)
  • 3 cities have no rail transit but do have bus service. Miller Park, built with huge parking lots for tailgaiting Wisconsinites, is the only one of these ballparks more than a quarter mile from the nearest bus stop.
  • Boston, Baltimore and Toronto have all four transit options within half a mile of the stadium. (In Boston, the Green Line, despite carrying more passengers than several subway systems, is classified as light rail; the Orange Line, half a mile away, is the heavy rail option.)
  • Denver is opening a multi-modal station near the current ballpark, this reflects the projected opening next year.
  • The Braves new ballpark will be nearly a mile from the nearest bus stop, putting it in the company of Texas and Kansas City.
  • Historically, ballparks were often further from the city center, and served mainly by streetcars, even in cities with subways. Braves Field, Shibe Park, Ebbets Field and the Polo Grounds were all closer to streetcars than to subways. (And note that Fenway Park, Yankee Stadium, and both ballparks in Chicago are not in the downtown core.)

Road Width vs Road use

When I was researching information about the new green housing development in Brighton I found some interesting numbers regarding the traffic on Commonwealth Avenue. As part of their permitting with the Boston Redevelopment Agency, a big PDF details the traffic patterns in the neighborhood, for both pedestrians and vehicles. Looking at the traffic numbers, I got the feeling that Commonwealth Avenue in Brighton is not equitably sized. In other words: the width of the road is not proportional to the number of users for each segment.

Here’s how the roadway in question breaks down (I measured it online):

The unlabeled gray sections are medians. Here it is simplified by use:

And here’s a pie chart of how many feet (the total width is 200 feet) are used for each use:

About two thirds of the street is taken up by traffic lanes, parking or medians which separate traffic lanes and parking (and provide no refuge to pedestrians and no landscaping). But of people traveling along Comm Av, fewer than two thirds are traveling by car. Many fewer. According to the study, there are, at the peak PM rush hour between 5 and 6 p.m., 1343 vehicles traveling along Commonwealth or turning on to or off of Harvard. Of these, 785 go through, and the rest turn. Counting each turner as half a trip, there are 1064 road users along this stretch of Commonwealth Avenue. Assuming some carpooling, this probably equates to about 1400 people per hour.

There was no count for cyclists. This is a frequented stretch of road by bikes, but it is certainly not bike-friendly. I’d guess that there are 50 bikes per hour in total at rush hour. (There are no marked lanes for cyclists and they have to choose between the trafficked main travel lanes or the carriage/parking lanes which have parked car hazards and more stop signs. Most choose the former.)

For pedestrians the counting is easier: there are about 300 walkers per hour.

As for transit users: the T maintains a six-minute headway along this stretch of street during rush hours. In recent years, they’ve moved from two-car trains to three-car trains, and about half the rush-hour consists along this line have three cars. That’s 25 vehicles per hour in each direction. In the peak direction, the T operates at or near crush capacity in this section, with 150 to 200 passengers per car (specs here). The non-peak direction probably operates at about one third that capacity, with 50 passengers per car (around all-seated capacity). This estimate gives us, conservatively, 5000 people per hour.

So, compare the chart above to this one:

The vehicle right-of-way, which uses the lion’s share of the street’s real estate, sees fewer than a quarter of the street’s users. Transit, with less than a sixth of the street width, carries more than triple that number. Per linear foot, the roadway and the sidewalk come out about the same. By passengers per foot of right-of-way per hour (ppfph) the numbers break down as:

  • Vehicle ROW: 11.1
  • Sidewalk: 12.5
  • Transit: 172.0

Note where the decimal is for the transit. It’s 15 times more efficient for each unit of real estate.

This can be documented for many other streets. Take the main cross street here, Harvard Street. It sees about 900 cars (1200 passengers) at peak hour, 350 pedestrians and (I’m guessing here) 60 cyclists (it was not counted in the bike count database since 1976). The street right-of-way is 78 feet wide, with 22 feet of sidewalk, 10 of bike lane and 46 for vehicles (travel and parking). Of course, the MBTA’s route 66 bus runs every 9 minutes at crush capacity (60 passengers per bus) in both directions, carrying about 800 passengers.

On Harvard, the sidewalks carry 15.9 pedestrians per foot per hour, the bike lanes 6 and the vehicle lanes 43.5. (Not terribly surprisingly, Harvard Street is usually gridlocked between 5 and 6 p.m.) This neglects to account for the efficiency of the buses. Buses demand some real estate, namely a 10-foot-by-50-foot bus stop every 1000 feet or so. That breaks down to one half of one linear foot, but for good measure we’ll assume the buses use that much street real estate during travel, and assign two of the vehicle feet to the buses. That changes the numbers:

  • Vehicle ROW: 27.3
  • Bike lanes: 6.0
  • Sidewalk: 15.9
  • Transit: 400
Does that mean that the 66 bus is more efficient than the Green Line? Certainly not. With 800 passengers per hour, the 66 is stretched to capacity: it gets bogged down in traffic, it frequently runs late or in bunches, and it crawls along its route. To add many more passengers, it would need its own lane. Even still, if, as a bus rapid transit, it took over the parking lanes (note: this won’t happen any time soon) and doubled its ridership (likely, considering how many people take it even despite its slothly pace, it would still be more efficient than the adjacent roadway.
(And one more note: we’ll look at the Red Line on the Longfellow Bridge soon, but the back of the envelope calculation is 15 trains each way carrying an average of 750 passengers each per hour in 30 feet of right of way, giving a ppfph of 750. A New York Subway line running every three minutes with 1000 passengers per train would yield a ppfph of 1333. A highway at peak capacity might be able to attain 2700 passengers per lane per mile—or a bit more with a lot of buses—for a ppfph of 225, but adding any more vehicles quickly decreases the speed and capacity.)

What is the busiest road in the country?

I originally drafted this in 2009 and was reminded of it by a recent Room for Debate article in the Times, which pointed out that

if the morning subway commute were to be conducted by car, we would need 84 Queens Midtown Tunnels, 76 Brooklyn Bridges or 200 Fifth Avenues.

which is about the same point I am trying to make here …)

What is the busiest road—the busiest single right of way—in the United States? The Jersey Turnpike? The George Washington Bridge? The Bay Bridge? Any number of roads in Los Angeles? Houston? Chicago? The 401 in Ontario?—okay, that’s twenty lanes wide and in Canada.

But the answer is, none of the above. And no other multi-lane suburban monstrosity. In fact, quite arguably the busiest roadway in the United States is five lanes wide—of which two are for parking. And it has sidewalks! It’s not particularly what goes on on the street, although the road is often congested. But, still, three lanes? Parking? Presumably traffic lights? And it is busier than dozen-lane-wide Interstates?

There’s a lot of pedestrian traffic on the street too. Especially since, every eight or ten blocks, thousands of people disappear down stairways and provide most of the traffic on the street. Of course, the street is Lexington Avenue in New York, and most of the traffic comes from ridership aboard the Lexington Avenue Line. WIth 1.3 million trips daily, the line would, on its own, be the largest rapid transit system in the country, other than New York. With more than 50 trains per hour at rush hour—in each direction—the line has a crush-load capacity of close to 100,000 passengers per hour.

(Oh, yeah, there are some cars and buses and bicycles on the surface, but these are margins of error compared to the capacity underground.)

How many cars would it take to move 100,000 people per hour? Well, let’s assume 1.5 people per car at rush hour. That’s about 67,000 cars. Various studies have pegged the capacity of a highway lane at about 2000 cars per hour, or more than one every two seconds. Any more and the speed—and then the capacity—drops. (I can’t find the source, but maximum capacity occurs at around 50 mph, after which, if you add any more vehicles, speed drops precipitously. So if you are in traffic which begins to drop below the speed limit, get ready to slow further.) Highways are relatively inefficient for their space—the five lanes of Lexington avenue, even if they were a highway, could only handle about a tenth of the capacity of the Lexington Line.

So, how many lanes would it take to move 100,000 people per hour? Well, let’s make one more assumption. Crush capacity in the peak direction, and full capacity (100 per car) in the other—150,000 people, or 100,000 cars. The math is rather obvious: it would take about 50 lanes to move the number of cars as one subway line—or about the total number of north-south lanes on Central Park Drive, 5th, Madison, Park, Lexington, 3rd, 2nd, 1st and York Avenues, and FDR Drive.

Or to put it another way, every packed-full, ten-car subway train in New York City (or similarly-full trains elsewhere) is equivalent to a full lane of rush hour traffic for an hour.

Transit mode share to ballparks

In a cute lede in a recent op-ed in the Boston Globe, New York and Boston sports fans were held up as examples of transit users.

Red Sox and Yankees fans can agree on one thing — how to get to the game. In New York, about 45 percent of ticketholders take public transportation. In Boston, more than 50 percent of ticketholders take the T — a percentage higher than any other professional sports franchise in any city in the country. Yet, even as hundreds of thousands pour into rail cars each season, most are unaware that the trains are running on empty.

That makes sense: parking in Boston is atrocious ($40 for a spot, and horrible traffic pre- and post-game) and in New York many fans come from The City, and those who don’t face interminable waits to get off of and back on to the Major Deegan. (Google Maps imagery of Yankee Stadium, taken just before a ballgame, shows hordes of people getting off the subway, and traffic backed up from the stadium 3 miles north up 87, and across the Harlem River in to Manhattan towards the GW Bridge, although the CBE is pretty clear.)

This got me to thinking. I profiled Minneapolis’s new stadium, Target Field, a few weeks ago, focusing in on how it was built in to a transit system which, when fully developed*, could see a 600-passenger crush load, three car light rail train leaving every three minutes in each direction. (I was biking through Minneapolis last week and saw them using three car trains after a Twins game.) I also went to Kansas City, where there is no transit service to the game, and everyone is forced to park in the huge lots surrounding Kauffman Stadium, setting up a nice little racket for the stadium owners.

I want the data. I want to plot ballpark transit mode share versus overall transit mode share. I’d love to see data on biking to the stadium. This mode is nonexistent in Boston or New York (where your bike is liable to be stolen if you aren’t hit by a driver on the way to the game) but in Minneapolis there are hundreds of bike racks and they’re full on game day (and the city is planning to complete a bike trail quite literally underneath the stadium which will enable off-street links from most directions). If anyone knows where I can get it (and, yes, I emailed the authors of that article) I’d love to know.

* The Central Corridor to the south and then east, the Southwest Corridor to the north and then southwest and the Bottineau Transitway to the north and then northwest, plus any additional commuter rail.

Soft factors that benefit car sharing

Since I work for a car sharing organization, people often ask me what makes a city or neighborhood ideal for car sharing. While certain factors are easily measurable or obvious (density, walkability, and mixed use development), others are a just as important but not as apparent. I’ve come up with three such “soft factors” (soft because they are not hard measurements which can be gleaned, say, from census data). These seem to be quite indicative of whether car sharing will thrive, and seem to be good for creating livable cities as well—as long as livability is not intertwined with car ownership.

They are the availability and cost of parking; the frequency, reliability and speed of a transit network; and the prevalence of urban congestion.

1. The cost and availability of parking. Owning a car is expensive. However, once you start paying for parking, you’re throwing money at little more than a 100-square-foot plot of ground for your car not to drive. Once this cost gets over about $100 a month, it contributes significantly to lower car ownership. Enmeshed with this factor is the availability of parking. It’s almost always possible to find street parking if you look hard enough. But if you have to circle a block six times, jockey your car in to a tiny spot, and/or move it every third day to the alternate side of the street, it makes car ownership more of a burden than a freedom.

Cities where car sharing thrives are not cities where it is easy to find a parking space. One of the major reasons car sharing took off in cities like Boston, Philadelphia and San Francisco is that they were able to advertise that their cars always had “reserved parking,” a godsend for residents who had to deal with expensive private lots or arduous on-street spaces. All of the sudden, they could take a two hour car trip, get home, and not have to worry about how many blocks away the nearest spot would be. Or, if they gave up their private spot, they might find a couple grand in their pocket at the end of the year.

2. The frequency, reliability and speed of a public transit network. The three adjectives here generally go hand-in-hand-in-hand, with the exception of a minor explanation regarding speed. Speed is relative. Sure, antiquated subways in Boston, New York and Chicago may creep along through ancient tunnels or els, but compared with the gridlock above (or below)? Well, private right-of-ways do have their advantages. And are they reliable? Well, about as reliable as highways which, at any time, may devolve in to a traffic jam.

The most important piece of the transit puzzle seems to be frequency. Or to put it differently, “can you walk to the nearest bus line and get on a bus without knowing a schedule.” This generally means that most lines should have midday headways of 15 minutes or less. And while grade-separated, rail transit carries a large fraction of riders in many of these cities, reliability and frequency seem to be more important to car sharing than the exact mode. Seattle, for example, was until a few months ago a bus-only transit system (We’ll ignore the monorail and one-mile streetcar.) and the new light rail line doesn’t serve many high-car sharing neighborhoods. Still, most lines run every ten or fifteen minutes all day and in to the evening, and while they’re not particularly fast, they come pretty often.

Do a lot of car sharing users walk or bike? Yes. But if it’s raining, or cold, or they just want to make use of transit, the ability to walk to the corner and not have to wait 25 minutes reduces the need and desire to own a car. (Especially when it might take that long to find a parking space; see factor 1 above.)

3. The prevalence of urban congestion. This is probably the most confusing of the three factors, since I don’t mean congestion on freeways leading in to the city in the morning and out in the evening. What it refers to is the prevalence of random traffic jams and tie-ups. In other words, how often during non-peak periods (middays, evenings and weekends) is there horrible traffic for no apparent reason? How often do you get in your car and, because a lane has been blocked off or a light has malfunction or an inch of snow has fallen, a trip that should take ten minutes takes half an hour? How often do you sit and watch a light a quarter mile ahead and realize that there are 40 cars ahead of you and only two are making it through each cycle? And how often is there some event—a parade or a race or a visiting dignitary—which so screws up the traffic system that no one in their right mind would drive downtown?

In cities which support car sharing, everyone’s had the experience of sitting in traffic on a Saturday afternoon for, well, no apparent reason. Urban congestion is not just that there are too many cars on the road, but that they are dynamic urban environments which sometimes don’t mesh with the automobile. If one small protest or minor accident closes off a main street corner, it can cascade across the street network, creating gridlock at a time it’s not expected. Of course, as anyone driving in any of these cities knows, there’s no time when there’s never been traffic.

Are these the only three factors which contribute to a dynamic car sharing market (or, in other words, make owning a car so unpalatable that many people do without)? Of course not. Also important are population and employment density, walkability (which has to do with these factors) and, to a small extent, the availability of bicycle facilities, the cost of gas, planning ordinances, physical geography and the like. But, from what I’ve seen, these are some of the most important factors, and they not only create a city with good car sharing prospects, but one in which people actually want to live.