Personal data collection: Hubway

Back in 2011, as part of a convoluted New Year’s resolution, I started tracking my personal travel daily. Each day, I record how many miles I travel, by what mode, and whether I am traveling for transportation or exercise/pleasure. Why did I start collecting these data? Because I figured that there was the chance that some day it would be useful.

And that day is … today!

I realized recently that I had a pretty good comparative data set between the April to July portion of 2012 and 2013. Not too much in my life changed in that time frame. Most days I woke up, went to work, came home and went for a run. Probably the biggest difference, transportation-wise, was that in 2012 there were no Hubway stations in Cambridge, and in 2013 there were. In addition, since Hubway keeps track of every trip, I can pretty easily see how many trips I take, and how many days I use each mode.

To the spreadsheets!

The question I want to test is, essentially, does the presence of bike sharing cause me to walk and bike more frequently, less frequently or about the same? Also, do I travel more miles, fewer or about the same? A few notes on the data. First, I am using April 6 (my first Hubway ride in 2012) to July 9 (in 2012 I had a bike accident on the 10th and my travel habits changed; Hubway launched in Cambridge at the end of the month, anyway). Second, I collect these data in 0.5 mile increments, and I don’t log each and every trip (maybe next year) but it’s a pretty good snapshot.

The results? With Hubway available, I ride somewhat more mileage, but bicycle significantly more often. In addition, my transit use has declined (but I generally use transit at peak times, so it takes strain off the system) and I walk about the same amount.

Here are the data in a bit more detail for the 95 days between April 6 and July 9, inclusive:

Foot travel. In 2012 I walked 84 days in the period a total of 190.5 miles. In 2013, the numbers 83/180. (Note that I do not tally very short distances in these data.)

Bicycle travel. In 2012, I biked 66 and, believe it or not, in 2013 I actually biked fewer days, only 64. As for the distance traveled, I biked 466.5 miles in 2012, and 544.5 miles in 2013. So despite riding slightly fewer, I biked nearly 20% more distance. This can be partially explained by my participation in 30 Days of Biking in 2012, when I took many short trips in April.

In addition, in 2013 I began keeping track of my non bike-share cycling trips. I only rode my own bike 14 days during the period, tallying 44 trips on those days. But there were many days where I rode my own bike and a Hubway; I took 29 Hubway trips on days I rode my own bike; on 8 of the days I rode my own bike, I rode a Hubway as well.

Bike share trips. In 2012 I rode Hubway on 39 days, totaling 71 rides, an average of 1.8 Hubway rides per day riding Hubway. In 2013, I rode Hubway on 58 days, but tallied 185 rides, an average of 3.2! So having Hubway nearby means that I ride it more days, and more often on the days I ride.

Transit. In 2012, I took transit almost as frequently as bicycling, 61 days. I frequently rode the Red Line to Charles Circle and rode Hubway from there to my office. In 2013, my transit use dropped by nearly half, to just 31 days, as I could make the commute by Hubway the whole way without having to worry about evening showers or carrying a lock.

We might look for the mode shift here. My walking mode shift has not changed dramatically. My bicycling mode shift hasn’t appreciably increased, although the number of total rides likely has. My transit mode shift has decreased, as I shift shorter transit rides to Hubway.

Now, if they ever put a station near my house, I’ll get to see how those data would stack up. My hypothesis: I’d never walk anywhere, ever.

Mapnifiscent Needs More Bikeshare

There’s a great site called Mapnifiscent. You put in a location, it calls up the Google Maps GTFS API (probably), and it tells you where you can get in n minutes. What if you have a bike? If you have a bike, you can change the settings and say “I have a bike!” and it will factor that in to the equation. (One minor point of contention: it assumes 3 mph straight-line for walking, but just 6 mph for bikes. 3 mph in a straight line for walking seems quite fast, as it probably equates to 4-5 mph when roads are taken in to account. 6 mph seems slow, although when I calculated Hubway speeds it is actually a pretty good estimate for straight-line urban biking speeds.)

What if you have a Bike Share fob? Well—that’s anyone’s guess. A great new feature would be for Mapnifiscent to scrape the XML feed off of bike share sites (for instance, here’s Boston and DC) and plug locations in to their formula. It could then offer an option “are you a Bike Share member” which would allow estimates based on combined transit-bike share-walking trips; and show how bike sharing can enhance transit by expanding access. Because, let’s face it: you don’t always have a bike with you. And sometimes it’s not allowed.

Hubway Expansion Station Locations Not Always Optimally Located

Boston Bikes and Hubway are in the midst of a public input process for adding shared bicycle stations to several neighborhoods in Boston. Not only are these additions welcome for the general public, but the city has decided to use a local start-up, CoUrbanize, to solicit input. CoUrbanize has a map- and tag-based comment database, and seems like a good, simple platform in the often-confusing public comment sphere. So all systems are in place to get some good comments, and get the stations on the street, right?

Not really, because instead of putting the stations in thoughtful locations where they will do the most good, they are scattered across the study area and located in places where they make no sense (while leaving out obvious locations like major commercial corridors and transit stations). So instead of having a good discussion about the merits and detractions of various locations, the public is now discussing how some of these locations make no sense at all as bike sharing locations (at least in the current iteration of bike share), and why other, disparate locations, would work much better. This seems less productive than would be desirable.

An issue seems to be that the station maps were created to cover as much of the map as possible without much thought to whether the locations were best of bike sharing. This seems like a political play to keep constituents happy, but seems to assume that constituents will be content if their neighborhood is covered by a circle on a map, but not care whether or not there is a useful network of shared bicycles. The Jamaica Plan expansion—the largest of the three proposed—is a good example of how this plays out. Most of the study area is in or near a circle buffered around a location. However, the way in which the stations were placed means that there are no bikes at any Orange Line station, and that the southern portion of the Centre Street business district is underserved as well. For anyone with more than a passing interest in Hubway—and most public commenters likely fall in to this camp—the illogic of some of these station placement is obvious.

There are three neighborhoods being studied right now: Jamaica Plain/Roxbury, South Boston and Charlestown. All of them seem amenable to bike sharing. Yet several of the locations chosen in each bear little resemblance to successful bike sharing locations. Let’s review several important factors in siting a bike share kiosk, which I’ll define as

The Five -tions of Bike Sharing

  • Population density (there needs to be someone to use it)
  • Destination (it needs to be somewhere people want to go)
  • Elevation (bike share locations on hilltops require frequent rebalancing as people take advantage of gravity in one direction only)
  • Connection (they need to be part of a dense network)
  • Transportation (bike share needs to complement existing transportation infrastructure)
While these are certainly not the only factors necessary for a successful bike sharing system, they are quite important. The proposed locations, in many cases, fail one or more of these tests. In addition, logical, and in some cases obvious, locations were overlooked. It certainly seems that they were chosen not to become part of the existing network, but instead to cover the map. This may be an unfortunate part of the planning process, but in this case it seems to just gum up the works.
Here is some short commentary on the locations:
Jamaica Plain / Roxbury is a fertile location to grow Hubway. There is significant existing bicycle infrastructure, good transit and density, and a burgeoning bicycle culture. A logical system would follow existing transit corridors—Centre Street, the Southwest Corridor (transit and bike path) and Washington Street—in JP, and similar corridors in Roxbury. (I will admit that I know less about the transportation infrastructure in Roxbury than in JP.) Instead, locations are put in some rather inconceivable locations:
  • JP-1 fails due to its location atop Mission Hill. Which is steep! It has population and destination, but would likely require frequent balancing as riders took bikes down the hill but walked up. This would be better moved to the VA Hospital on South Huntington or to Jackson Square, which inexplicably falls outside any of the circles, despite being a major transit hub with significant new development taking place.
  • JP-2 is a logical location, at a business node on a dense transit corridor.
  • JP-3 makes no sense and fails on all five of the -tions above. It is in a relatively sparsely-populated part of JP, away from any transportation infrastructure and high up on a hill. In addition, the only way to access the rest of the proposed and existing network is by navigating the bicycle-unfriendly Pond Street-Arborway corridor. This location will certainly not come to be any time soon, and it’s disingenuous to propose it.
  • JP-4 lies on the Southwest Corridor but is, for whatever reason, halfway in between the Green Street and Forest Hills Orange Line stations. Perhaps it would be a good location in the future, but the first priority should be locating bikes at the stations themselves. Furthermore, there are no locations anywhere near Centre Street through the heart of Jamaica Plain, and this location is about as far from Centre Street as any location along the Southwest Corridor.
  • JP-5 is at Upham’s Corner in Roxbury and is a decent location for a station, although it is somewhat far from other locations.
  • JP-6 is a good location in Egleston Square, but again suffers from the fact that there are no nearby stations, especially along the Orange Line. Egleston was once an elevated station, and Hubway could be a good resource for getting to and from the current Orange Line stations, but if the Orange Line is eschewed, it loses some usefulness.
  • JP-7 is similar to the location above, although at least closer to the current Hubway station at Roxbury Crossing.
South Boston is another good location for bike sharing. It is quite dense and located in close proximity to the Downtown area, but lacks rapid transit except on the western fringe. One issue is that it is surrounded by three sides by water, so connectivity to the rest of the system is a bit of an issue. And while the three stations proposed do not provide coverage for the whole of the neighborhood, they do not fall as far short as some of the locations in Jamaica Plain. It helps that there are existing Hubway stations at Red and Silver Line rapid transit stations on the north and west sides of South Boston, so these stations can act as feeders to there, and to downtown Boston as well. I don’t know Southie that well, but this chart (from Southie Bikes) is a great representation of why Hubway should do quite well there.
Charlestown‘s main issue is that the proposed stations do not complement the existing stations in Charlestown that well—let alone the rest of the system. (NB: there is a new station at the new Spaulding Hospital not shown on this map.) C-2 is a logical spot at the Charlestown Community Center. But C-1 is located between two existing stations. And there are no proposed locations at either the Community College or Sullivan Square Orange Line stations, or logical connections to the Hubway locations in Cambridge or Somerville. While C-3 is labeled as “Sullivan Square,” it is quite a distance from the actual Sullivan Square MBTA station. As the roads in Sullivan are redesigned and as the area is (hopefully) developed in to something more than an array of highways and parking lots, the station may be differently located. But for now, it should be located at the MBTA station, where it can provide connectivity not only to the new and existing Charlestown stations, but to Somerville as well.
It is good to see the City partnering with CoUrbanize to invite public comment for these location, and the comments—some of them my own—have certainly hit on where these stations should go. Hopefully the Hubway expansion steers clear of some of these less-than-desirable spots. Luckily, the stations are portable and easily moved, so, unlike most infrastructure, the system can be rejiggered if it is not optimally sited at first. But it would be even better to have picked better locations from the outset.

Hubway Data Challenge (and updated personal charts)

Back in September, I grabbed my Hubway use, cajoled it in to some charts, and posted them here for the world to see. Remember how cool those charts were, with 130ish data points?

This is what happens when you get more than 130 data points!

Well, in October, Hubway released the data from all rides taken on the system, which added another (approximately) 550 thousand data points, so I decided to rerun these data added together, for a grand total of about 550,130 data points.

(Totally off subject, but this reminds me of the old joke about significant digits the docent at the Museum of Natural History. A student asks how old the dinosaur skeleton is. And he replies “it is 68,000,038 years old.” The student asks how they know such an exact number and he says “when I started working here, they told me it was 68 million years old. And that was 38 years ago!”)

Ha ha ha. Anyway, I spent the next month dealing with this slightly larger data set, charting and mapping the data, cursing Excel (especially the Mac OS version which is so poorly designed that it will only run one one core of my four-core processor at a time, in other words, I would like my money back, Mr. Gates) and churned out an entry in the Hubway Data Challenge contest. The winner gets a free helmet, Hubway membership and t-shirt, which is slightly better than a sharp poke in the eye! You can find my entry at the above link, or go directly to it here. It has CSS! And some moderately interactive features!

Then I went and looked through all the other entries. From people who know how to make websites that work, and from people who know how to write code to do cool things. And then, I won anyway! Well, I was one of several winners. But still.

Anyway, here is my latest Hubway usage report, you can clicky to make it bigger. OH AND! If you want this treatment for your Hubway trips (and the map, too; the map is pretty cool) let me know and I will make it for you. Payment in beer is readily accepted.

Personal Hubway Report

Back in May, a month in to my Hubway membership, I analyzed bike share trip length data, and ran a quick “analysis” of my own personal trips. Since then, I’ve logged more than 100 more bike sharing trips, and put together a bit more robust of an analysis to see my trip data. Since starting with Hubway:

  • 123 trips
  • 7:29 average trip length
  • 0.96 average trip straight-line distance
  • 15:20 hours on Hubway
  • 117 miles on Hubway (straight-line distance)
  • 7.63 mph average speed (straight-line)
  • 29 unique stations used (24 unique starts, 25 unique ends)
  • 90 of 123 trips started or ended at the most frequently used station (44/46)
  • 8:1 ration of starts to ends at Charles Circle (24/3), which is much easier to bike from than to bike to.

I can also break these numbers in to charts. And I love charts! (N.B.: for all charts, the number of trips is on the vertical axis.)

Hey, that’s pretty cool! There’s some interesting data here. First—July. I think that a combination of being away most weekends and warm temperatures lowered my trip count. More importantly, Hubway didn’t launch in Cambridge (where I live) until August, so all my trips were work-based. And I rode my (own) bike to work most of July. Oh, and there was the minor issue of a bicycle accident which knocked me out of the saddle for most of the month.

As for the timing of my trips, this is a tri-modal distribution, which matches rather well with overall bike share use patterns for weekdays. There’s a peak in the morning, when I am biking to work, and another in the evening, when I’m biking home. (And since I’m supposed to be in the office by 8, I’m convinced that Hubway’s clock is off by a few minutes!) The midday bump is when I take a bike for errands, which I do relatively often at lunch. It’s nice to have a dock at my building.

And the trip lengths? These are tri-modal, too. The peak of 4-5 minute trips correlates well with my frequent multi-modal commute walking to Central Square, taking the Red Line to Charles, and biking to my office, much faster than another stop and a walk or transfer would take me. (The reverse, thanks to one-way streets, is far less speedy; I’ve started 24 trips at Charles Station and only ended 3 there; it’s particularly hard to get there by bike.) The 7-8 peak is mostly lunch trips, and the 13-17 is from when I started commuting by Hubway in August.

Trip distance (straight line) mostly parallels trip length, and speed is a pretty nice bell curve. Since this is based on straight-line distances, there is some more variation than would be expected, because more roundabout trips wind up with slower “speeds” than straight shots. (My highest speed was when I biked straight down Commonwealth Avenue and made a bunch of lights.) This is probably comparable to average straight-line traffic speeds in Boston at rush hour.

Will I keep these data updated? Is the Pope Catholic? Does a bear relieve himself in the woods? Have I been tracking every mile I’ve traveled by mode for the last year and a half daily?

To get these data, I copied (in batches of 20) and pasted the trip data from my Hubway account (from their website) in to Excel; luckily it pasted very easily. Trip lengths were calculated from latitude and longitude data grabbed from Hubway Tracker. If you copy your personal trip data in to Excel and email it to me (ari.ofsevit on the Gmails) I’d be glad to get the data to you and send you charts of your own!

Hubway Helmet Storage

I’ve been riding Hubway a lot this summer and enjoyed it’s convenience immensely (I’m at 54 trips and counting since April).

One of the issues with bike sharing, however, is helmet use. The point of bike sharing is that you can pick up and drop off a bicycle like you would get on a bus or hail a cab. To a lot of users, having to carry around a helmet is antithetical to these goals. Attempts to solve this abound: Boston sells subsidized helmets across the city (I know; I bought one in a pinch and it currently serves as my “office helmet” which I’ve offered to share with coworkers). DC does too (but they cost a bit more). Melbourne, which has mandatory helmet use, has seen its system struggle, and sells helmets for just $5, which you can return for a $3 rebate. Minneapolis is straight giving away 10,000 bright green branded helmets. Vancouver considered shipping Montreal’s mothballed Bixi system from winter storage out for the Olympics but was stymied by their province’s helmet law. The city still doesn’t have a bike sharing system.

And there’s the cool MIT helmet vending machine. Really cool. And, uh, not in production yet.

Still, all of these ideas are for origin helmet dispensing? What about those of us who have a helmet already?

Riding a clunky, heavy, stable bike for a mile in the city is not prime helmet use territory, and many casual users don’t use a helmet. For those of us who do (perhaps because of prior experience), Hubway becomes an exercise in always having a helmet handy. More than once I’ve been ready to get off the Red Line at Charles (Side note: this station earns a 4.5 star rating on Yelp.) for the four minute jaunt down Charles Street only to realize I’d left my helmet at home and jumped back on the train.

But I’ve gotten better. I almost always have a helmet with me when I want to start a trip. Helmet availability is less and less of an issue. The problem is: what do I do with my helmet when I get to my destination?

I could strap it to my belt or put it in a bag. In my line of work and the circles I travel, wandering around with a helmet is, if not a badge of honor, at least somewhat acceptable. Luckily, on Hubway, it usually stays relatively non-sweaty. But in a crowded bar, having a helmet clipped to your belt looks really dorky, and can get in the way. It’s awkward to say “excuse me” and have a helmet rub up against someone’s thigh. (But maybe it’s a good way to break the ice with the cute cyclist across the room. I digress.) Or, I ride Hubway to the train station, and then wind up taking the train, walking to a meeting, going to the meeting, walking back to the train and riding back to the city, all the while toting my helmet. It doesn’t keep me from riding Hubway, but it’s a nuisance.

So what I think bike sharing needs is helmet storage at racks. More than once I’ve considered not taking Hubway simply because I didn’t want to have to keep track of my helmet while at my destination. (I’ve never actually found an alternative, because Hubway is really damn convenient.) Here’s are a couple scenarios to consider:

  • I leave my office after work and bike a mile across town to meet a friend at a bar. I store my helmet at the bike rack, and when I come back, I grab it and bike to the T, which I take home. With my helmet.
  • I Hubway over to North Station in the morning to take a train to a meeting. I store my helmet at the station. Back a few hours later, I fetch my helmet from the helmet storage, pop it on my noggin, and ride back to the office.
So what I think Hubway needs is helmet racks. Generally, people don’t steal helmets. If you lock your bike and hang the helmet off the handlebars, it will be there when you get back. The front wheel might be gone, but not the helmet. No one steals helmets to resell because no one buys used helmets (because you have no way to know if it’s been in a crash, and it’s all sweaty, too). No one steals helmets to use them because of the aforementioned safety issue and, well, because the population that is in to wearing helmets is generally not that in to petty larceny. I’ve left a helmet unlocked myriad times and it’s always been there later on. And, also, someone else’s sweaty hair. Ew. So no one steals helmets. Except …
Except near a bike share. It’s the only place where helmetless people would think of grabbing a helmet and going. It wouldn’t be their intention to steal it, but to use it and drop it off somewhere else. Which would work great, unless someone else was counting on coming back and finding it there. If you were at a bike share station and saw a helmet just sitting there, would you take it? Quite possibly you would. Even if it quite possibly belonged to someone else. And if there were just helmets clipped to a fence near the rack, they might be seen as a public nuisance and removed and trashed before their users could fetch them. So we need a rack with some sort of security.
The design could take any number of forms. The main hurdle of access can easily be solved by limiting access to people carrying an RFID chip with a unique code, which, very conveniently, is how bike sharing users access the bikes. (Except, of course, for daily users, but they’d be less likely to have their own helmets to store and make up a small portion of the user base. Plus, they could integrate the passcode system in the helmet storage.) It could be a stack of cages with doors which could be accessed by presenting a Hubway key. It could be a set of small U-locks which could be removed, put through a helmet vent (or even strap: cutting a strap to steal a helmet renders the helmet useless) and replaced. It could even be cables which would go through helmet vents or straps. 
Time limits could be enforced: after, say, six hours the user could be charged, or the cage could simply unlock. Rarely am I somewhere for long before I come back to the rack, grab a bike (and my helmet) and go. And it could easily be integrated in to the MIT HelmetHub design. Time to give them a shout, it seems like it would be compatible.
High security would certainly not be needed. No one is going to walk around with garden shears clipping locks and stealing helmets (for the same reason no one grabs helmets off the street; see above). The issue would be keeping the helmets safe from casual, almost accidental thief (“I need a helmet. Hey, look a helmet!”) and providing infrastructure which would say “helmets belong here, don’t mess with ’em.”
I know I’d use this system. I’m not sure how many others would. However, I think the market is there. Whether it’s someone who is already using the system and would wear a helmet if she had somewhere to store it, or someone who is interested in the system but doesn’t use it because they need somewhere to store their helmet. Either way, helmet and system use would rise. Neither of which is a bad thing.
This doesn’t solve the problem. But I think it’s a piece of the puzzle.

Bike sharing trip lengths

For a transportation data junkie like me, one of the great things about bike sharing is that the system lets you log in and see your trips. I’ve been riding Hubway for about a month, and I’ve taken 21 trips. Of these trips, 20 have been ten minutes or less. The one longer trip was 13 minutes. At no time have I gotten even half way to the 30 minute cutoff. Over on the right is a chart of the trips I’ve taken. The frequent four-minute trip is when I jump on a Hubway at Charles and ride it across town to my office, docking it outside the building. It’s faster than taking the T another stop, fighting the crowd at Park Street and either walking the Common or taking the Green Line one stop to Boylston.

This will probably change once Hubway launches in Cambridge, especially if they manage to put a station in the park near my house (not that likely, since it’s a mostly residential area, although it is halfway between Central Square and the grocery stores on the river, so there might be good traffic to those areas; I’ve been lobbying Whole Foods by Twitter to sponsor a rack there). I figure a trip on a Hubway from home to work would take about 16 minutes, so I’d still be well within the limit. And if I were taking a longer trip on a shared bike, I’d probably be cognizant of the time limits and swap a bike in and out at a rack (you just have to dock and undock) to reset the clock and get another half hour. Fifteen seconds of my time is certainly worthwhile to save a few bucks, and most trips are bound to pass by a Hubway rack.

Anyway, bike sharing in New York City is getting readier to launch and there’s a bit of a hoo-rah about how high its marginal hourly rates are. It is worth noting that the 97% of rides which are under 30 minutes in DC, as quoted by this article, (and 99+% are under an hour) are rides for frequent users on a monthly or annual pass. Capital Bikeshare publishes a lot of data (*) on their website (from which the chart below was taken) and the number of trips under an hour, for annual users, is pretty staggering. The number of trips under 2 hours—at which point trip costs really get out of hand, is 99.83%.

The main impact of overage costs are on casual users. For casual users, only slightly more than half of trips are completed within the free half-hour time limit, and 25% of trips are longer than an hour. So these folks pay. This is okay with me, for the most part, since they basically subsidize the riders who pay $50 to $100 and ride the bikes for several months. (If I make 20 trips per month of 8 months, my $50 Hubway fee will divide out to about 30¢ per trip.)

There seem to be two types of casual user (someone buying a single- or multi-day pass). One are people who want to try out the system (or use the system) in a similar manner to a frequent user and understand fully how it works. These folks probably fall mainly within the time limit. The second group are the people using shared bikes in place of rental bikes (which CitiBikes encourages on their website for longer-duration trips). This is basically how carsharing and traditional car rental operate. For a short trip (a few hours) a shared car is most certainly cheaper than a rented one. For a multi-day trip, it’s probably cheaper to go with a rental car. Bicycles, not surprisingly, have shorter trip times, and more disparity between low-cost (or no-cost) shorter trips and quite expensive long ones.

And rental bikes aren’t that cheap. The first hour is $14. Half a day is $39. These rates are more expensive than bike sharing for the first 90 minutes, on par from one-and-a-half to three hours, and cheaper beyond that. So if you want to rent a bicycle to roll around Manhattan all day, bike sharing probably isn’t for you. But take a look at the number of trips in DC longer than two hours. It’s only about 5% (and casual users only account for 1/6th of all trips). So the number of users dinged for particularly long trips is rather small.

There’s obviously a learning curve to the pricing scheme, and a number of Yelpers in Boston have apparently not understood it (although, frankly, it’s not that hard to understand). Apparently Hubway could do a better job of communicating this, and maybe CitiBikes should as well. What I really am surprised by is how someone would take bike with no lock and keep it out in a city for five or six hours! It’s not like they’re riding a century on it. I’d have to assume that even an oblivious tourist would get scared off by Boston traffic after a while, or run out of room on the Charles River paths and make for a cafe or museum. And in New York, where most any bicycle parked anywhere is asking to be stolen, having a rental bike is a liability. With a shared bike, all you have to do is find the nearest dock and leave the bike there. No lock required. With well-placed kiosks, this should be relatively easy.

What will be interesting is how this affects revenue from casual users (looking at the data from DC, I doubt that more than a handful of frequent users will ever pay an overage fee). While casual users do not account for much of the ridership, they do provide a good income stream. It’s possible that the higher rental costs will drive away prospective users. Even with higher prices, the drop in ridership will result in less revenue from casual ridership.

However, we’re talking about New York. There are a lot of potential casual riders (tourists), so it might be good to have higher prices as a bit of a barrier to entry to keep casual users from usurping the transportation demand aspect of bike sharing. And New York tourists don’t seem particularly price sensitive. Visitors to the City are paying $300 a night for a hotel room, $150 for tickets to a show and $40 for a pre-show meal at a mediocre Times Square restaurant. At those rates, what is another $25 to ride a bike around Central Park for a couple of hours? The higher rates—especially for casual users—strike me as a good balance between keeping bikes in the system available and maximizing revenue.

* CaBi has CSV files with every trip taken, too. I’m drooling.

Is bike sharing the “last mile” for car sharing?

A lot of hay is made about the “last mile” in public transport. Unless you live right at a bus stop or train station, your walk to the bus is going to be further than your walk to your car. (The term last mile derives from many other applications, such as communications and logistics, where the connections from end users to the main network are the least efficient, and thus most costly, to build and keep up. In transportation it relates to moving users from their origins and destinations to the nearest transit infrastructure.)

It’s an issue for car sharing, too. Even in the densest car sharing cities, many users live a few blocks away from the nearest shared car. (In these cities, of course, owning a car is generally very expensive and inconvenient, so the marginal gains from having a car right out your door are offset by the cost of a reserved spot or the time cost of circling the block looking for an unreserved one.) A car sharing network can be seen as similar to a transport network, with various access points spread across a region. With transport, the last mile is actually on both ends—getting from your origin to the network, and from the network to your destination—while with car sharing there is only an issue getting from your origin to the network as you then drive to your destination, so perhaps it’s more of a first mile issue. Still, it’s very similar—while there’s no hard research that I know of, anecdotal evidence is such that most car sharing users are willing to walk a quarter mile to a shared car, tolerant of maybe up to a half mile, but not very interested in going much further than that (similar to transit users).

Bike sharing may help to change that, by lengthening the distance people can travel to other modes. It fits in to a rather specific niche of the transportation network, for trips of between about 0.5 and 1.5 miles—trips that would be too short to bother with transit but too far to walk quickly. If bike share access is seamless and dependable—as is its goal—it can rather well fill this piece of the transport network. So before we look at how bike sharing and car sharing may interact, we should try to imagine where, exactly, bike sharing fits in.

In Europe, bike sharing has started up in the densest of cities—Paris (which is nearly as dense as Manhattan), Barcelona, Copenhagen—as well as many others. In North America, the first cities planning bike sharing systems are not necessarily the densest. Montreal, which is home to the successful Bixi system, is about as dense (11,000 persons per square mile) as Philly, although less-so than San Francisco (17,000) or Boston-Cambridge-Somerville (14,000). Boston is planning a system this year, as are considerably less-dense Minneapolis (7000) and Denver (4000), although, of course, the networks there will focus only on the densest portions of these cities. In a Paris, or even a Montreal or Boston, bike sharing will probably replace some trips made by transit or walking (or even short bike trips), but may not be as much of a driver of providing links to different modes, as transit is generally readily available. In the other cities, however, this may not hold true.

So there are basically two levels of cities implementing bike sharing. One is the dense city (>10,000 with a major fixed-guideway transit system and a large existing car sharing network: Boston, Montreal, Washington D.C., Paris, San Francisco …). The other is a less-dense city with a small fixed-guideway system and a fledgling car sharing system (Denver and Minneapolis, so far). Portland, which will likely join the bike sharing fray in the next couple of years, would fall in between, with its maturing transit system and a rather large car sharing market.

What bike sharing is best for are trips of a relatively finite distance, and it seems to vary based on the type of city (and which other transit modes are available). For trips significantly less than half a mile, you’d walk. The extra time it takes to get a bike and return it, even if there is a station right each end of a trip, is made up by the fact that by the time you got the bike, you’d be well on your way by foot. For trips longer than two miles, you’d likely want to ride your own bike (faster and more comfortable, but with a bit more overhead of storing a bike, carrying a lock and locking the bike) or ride transit (ditto, depending on the route), or use a shared vehicle. So bike sharing’s market is between about a third of a mile and a mile and a quarter (if you don’t mind locking your own bike) or a mile and a half (if you do)—perhaps a tad longer in cities without dense transit networks. Beyond that, biking, transit, a taxi or a car make sense.

So, how does it break down. Well, I made the following assumptions:

Denser city Less dense city
Mode MPH Overhead Mode MPH Overhead
Walk 3 0 Walk 3 0
Bike share 8 4 Bike share 8 4
Bike 12 7 Bike 12 7
Transit-slow 15 10 Transit-slow 15 12
Transit-fast 25 15 Car share+BS 20 
Car (Share) 20 10 Car (Share) 20 12
Taxi 20 6 Taxi 20 6
Trans-fast+BS 25  12  Transit+BS 15 10

MPH is, of course, miles per hour once using that mode. Overhead is the amount of time it takes at the beginning and end of the trip to get to the mode from the origin and from the mode to the destination. Walking has zero overhead. Bike share was estimated to have four minutes (a minute to the kiosk and a minute getting the bike on either end; this is probably a lowball estimate). Biking seven minutes: three minutes to get your bike out of storage, two minutes to lock it at the end, and two for incidentals (shoes, helmet). Transit-slow is for local routes, which are probably a shorter walk, transit-fast for faster routes (such as a subway) which are generally further away. Car share overhead is to walk to the car and unlock it, and adding Bike share (BS) to a mode can cut down on the walking time.

Bike share only makes sense in multi-modal situations in a few scenarios:

  1. In denser cities, to access faster transit. For longer trips, riding a shared bike a mile to a faster transit mode (say, a subway instead of a bus line) can allow most of the trip to be at a faster speed, and make the overall trip faster. Since most, if not all, transit stations served by bike sharing will have kiosks, this makes sense. In addition, it may allow users to travel to another transit line of the same level of service and eliminate a transfer, but, to keep things simple, these models don’t really look at transfers.
  2. In less dense cities, car sharing, which is quite dense in large cities, is a bit more diffuse. Thus, many potential car sharers might live more than half a mile from the nearest shared car. In Minneapolis, every HOURCAR in the initial service area will be within about 100 feet of a bike sharing kiosk, so dropping off the car is easy, and it may allow people a bit further away to access the vehicles. And bike sharing is much easier, here, than riding your own bike because you don’t have to bring a lock and lock it up (and worry about it)
  3. In less dense cities with less dense transit networks, it may make sense for some people to use bike share to access slower transit routes, especially if they live far from a route with frequent service, although in areas served by bike sharing, route networks are rather well established.

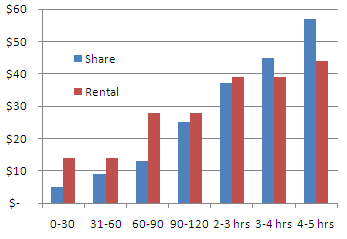
This perhaps, is best visualized by charts showing the time various trips take, based on the speed and overhead in the tables above.

The first chart is for denser cities, the second for less dense ones. For a given distance, the line nearest the bottom is the fastest mode. Cost is not taken in to account, but any orange or yellow line is a pay-per-use mode (taxi, car sharing) while any other line is a mode which is unlimited use, assuming most frequent transit and bike share users will have a monthly or yearly pass, so the marginal cost of each trip is zero. Dashed lines are variants of a mode with bike share added to the start or end of the trip to reduce overhead.

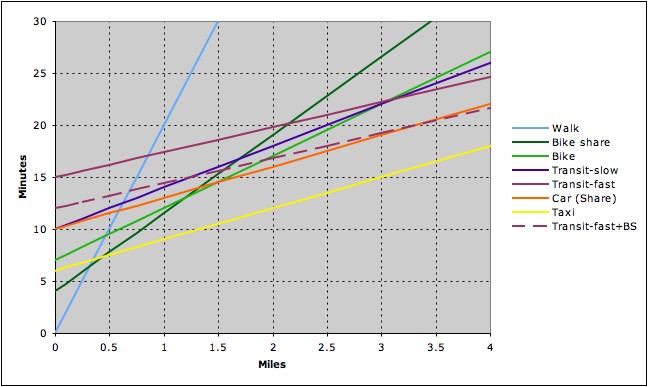
So in a dense city, where does bike sharing fit in to the picture? Well, assuming, for a minute, that we discount taxis (fast but expensive) and car sharing (expensive, fast, and not for short trips unless there is parking at the other end), bike sharing makes the most sense between about 1/3 miles and 1 mile if you have a bike of your own (or don’t mind locking said bike) and 1.5 miles if you would otherwise rely on transit. Considering that nearly half of trips are less than two miles from home, that’s a pretty big range—more tan a tad under half a mile and you’d walk, beyond two you’d take transit. However, bike sharing is generally only marginally faster than other options. Walking takes over for transit for trips much longer than 3/4 of a mile, so bike sharing will generally only ever save three to five minutes. So it better work well.

The other factor here is bike sharing and the faster transit network. What I mean by faster transit are generally grade-separated fixed-guideway modes (subway, proper light rail) but could also be express buses on highways. These lines are generally further apart than slower bus lines, so fewer people live within easy walking distance. In the chart above, for trips under three miles, it makes sense to take the bus (assuming it’s five minutes closer than the train), but if bike sharing can shave just a few minutes off the walk to the station, the train—which is more energy efficient and can more easily accommodate higher passenger loads—becomes a better option at distances of just over a mile—right about where bike sharing leaves off.

(Yes, it appears that bike sharing will actually make transit faster than driving at one point, but for very long distances, at least outside of rush hour, car sharing’s speed would be higher as drivers would access faster roads. This line should probably be curved (as should others) but that’s not really necessary for these simple simulations.)

In other words, imagine the following scenario: You live a block from a bus line, and the corner with the bus stop has a bike sharing kiosk. The bus line runs three miles to your office, or a store, or some such destination. You also live near a train station which has a line running to the same destination, but it’s a half mile walk from your house. Let’s assume that the bus and train have the same headways, that the bus runs at an average of 12 mph and the train at 25. Right now, your options are to walk to the corner, catch the bus, and ride 15 minutes to your destination; or walk ten minutes to the train, catch it and ride 7.2 minutes to your destination (17.2 total). With bike sharing, you can now ride at 8 mph 0.5 miles to the train (3.75 minutes), spend a minute at each end retrieving and returning the bike, and ride the 7.2 minutes, for a total of 12.95 minutes. So you save 2:03 versus the previous fastest mode time. It’s not a lot, but it’s a small advantage.

Of course, no transportation network is this cut and dry—but this is at least a way to imagine where bike sharing fits in. This summer, for instance, I wandered through Paris for a day with my family. We had two choices: the Metro or walking. Bike sharing was out because we didn’t have the proper credit card and my mother was scared of cycling through traffic without a helmet, and we didn’t know enough about the bus system to use it. (Taxis would have been an option, but they are expensive, slow—buses often have reserved lanes—and my family is cheap.) Had we had access to bike sharing, trips between half a mile and a mile and a half would have been easier and faster by Velib.

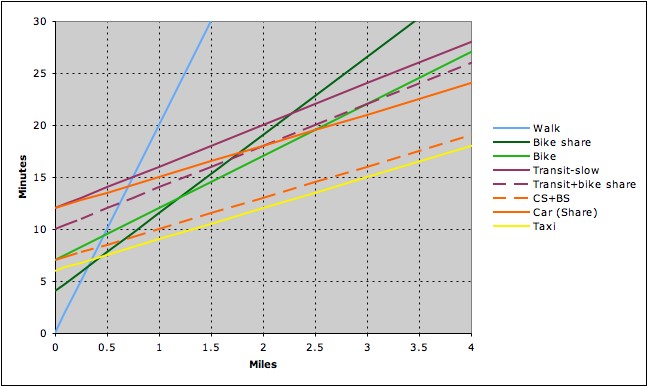
Now on to less dense cities. Here, the niche for bike sharing is similar, and maybe even larger, as we can assume that bus and transit service is a bit harder to come by. Bike sharing makes sense from about a third of a mile,  but this time is only exceeded by transit for trips greater than two miles. (This is due to the assumption that frequent bus routes are a bit less prevalent in these cities; living right near a good bus route would obviously change this equation.)

But it also shows the other advantages of bike sharing in these cities. First, bike sharing increases the utility of transit. It’s not a big difference, but with a more dispersed route network, we can assume that bike sharing allows a few more residents to live within “easy travel distance” of said routes. (Although this may be confounded by most bike sharing locations being near bus lines.) If this is the case, it makes transit faster than bike sharing around 1.5 miles—if a shared bike is used to access the bus.

Then there’s car sharing. While cities like Boston and Montreal have robust car sharing networks, Minneapolis and Denver don’t. In Boston, for example, there are entire neighborhoods where every resident is within a half mile—or often less—of not one but many shared cars. This just isn’t the case with Minneapolis and Denver. If bike sharing can be utilized heavily in these cities—and without as much competing transit there is a bit more of a market to seize—it could be the missing link to shared cars. These data assume that the time needed to access a shared car would drop from twelve minutes (±1/2 mile walking at 3 mph plus a minute to access the car) to seven (±1/2 mile biking at 8 mph, plus two minutes to get and return the bike, a minute to walk to the bike and a minute to access the car).

If there are bike share locations in locations other than car sharing locations (as is the plan, at least, in Minneapolis), they will allow people who may live a mile from a shared car to get to the car in eight or ten minutes (biking) instead of 20 or 25. This is the proverbial “last mile.” In less dense cities with higher car ownership, it is not always possible to support a shared car on every block. We’ll see if this becomes the case, but it is possible that a symbiosis will develop between the two shared transportation modes where bike sharing will allow a substantial increase in the reach of the car sharing networks in Denver and Minneapolis.