Hubway Data Visualization
Ari Ofsevit | www.ariofsevit.com | @ofsevit
Charts
It became apparent that there would be differences between registered and casual users and weekday and weekend users. First, I wondered the differences in speed based on age and gender. As would be expected, younger riders are faster than older, and men (slightly) faster than women:

I was somewhat surprised that there is only a 1.5 mph difference between the oldest riders (those born in the 1940s) and young speedsters in their 20s, and only about a half mile per hour difference between men and women.
There didn't seem to be anyting too meaty here, and I moved on. After some machinations, I charted, in the same ten minute intervals (these will recur frequently), the average speed by day of the week and trip type, as a chart where the size of the line is proportional to the number of trips taken:
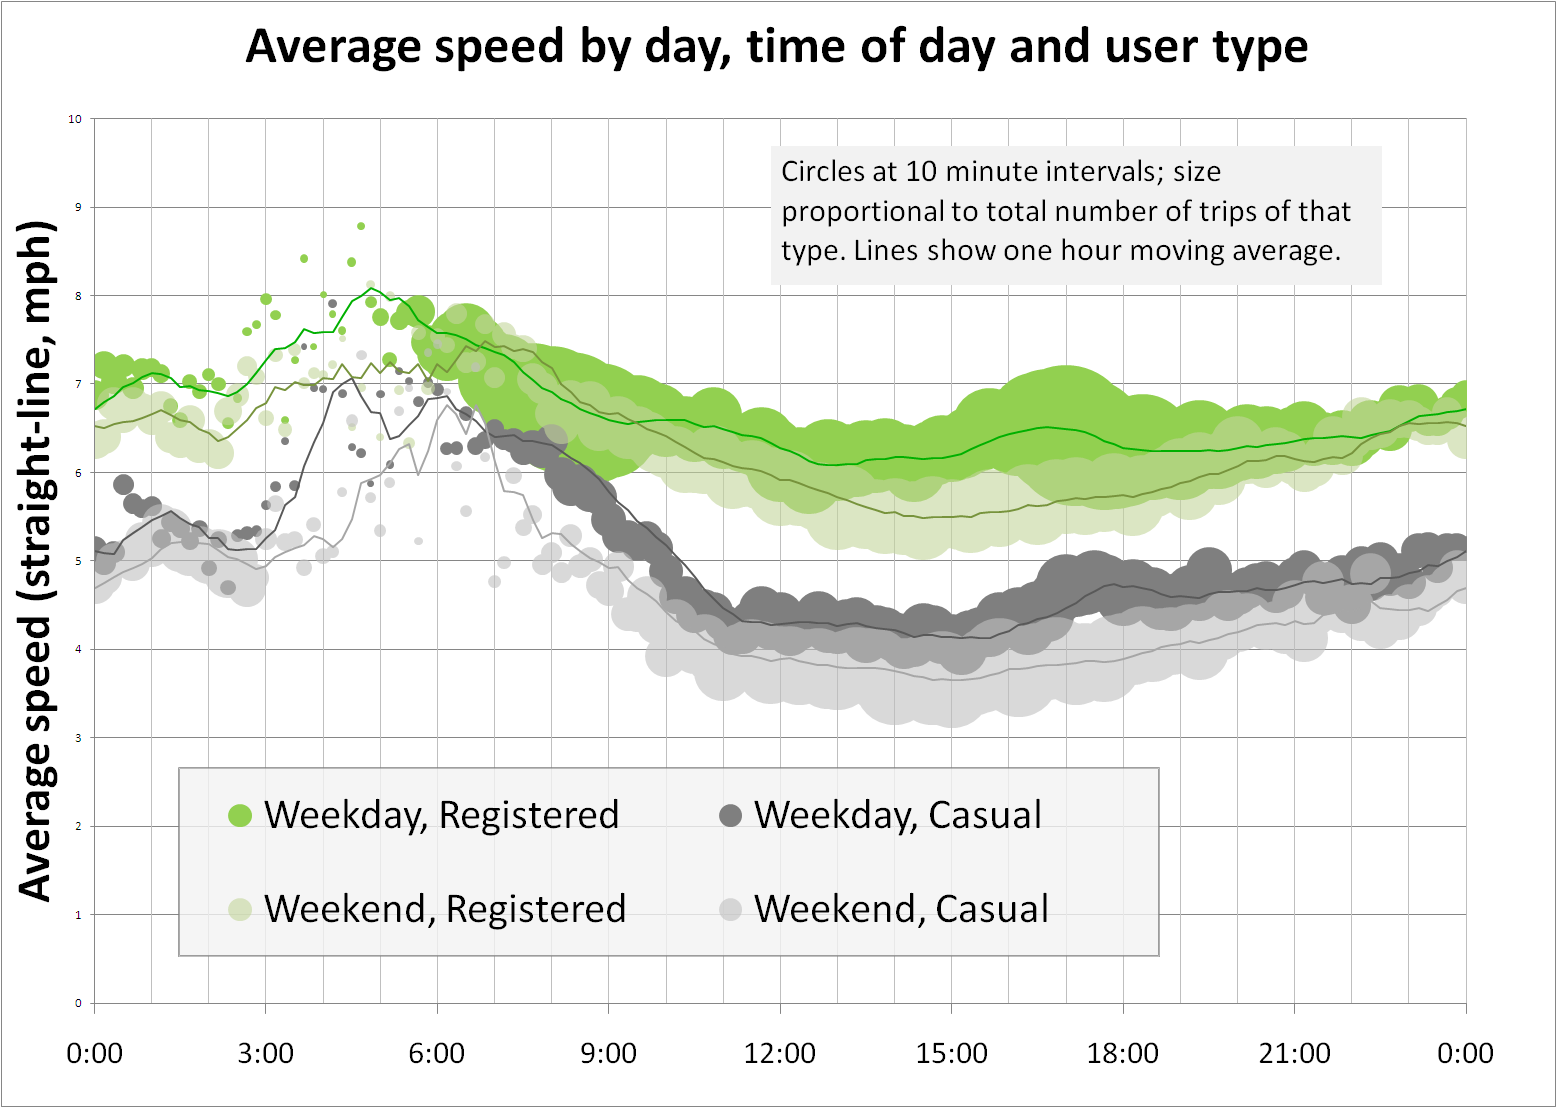
Oh, now some interesting things jump out:
- Registered users are much faster than casual users
- Everyone goes slower on the weekend, by about the same amount for registered and casual users.
- In the peak morning hour (8-9), weekend registered users are actually faster than their weekday counterparts (probably because there's far less traffic on weekends).
- The fastest travel times are overnight (no traffic), and there's less registered-casual discrepancy then (but only between 3 and 7 a.m., so apparently alcohol is not a performance-enhancing drug).
- But there's a pronounced secondary peak for weeday registered (and even casual) users around 5 p.m. I wonder if anyone is trying to get home from work, hmm?
- The average registered Hubway user's speed is about 6 m.p.h., and their average trip length about a mile, so most trips take about 10 minutes. (Only about 2% of registered trips go over 30 minutes and incur fees; about a third of casual trips do.)
- A trip from Kenmore to South Station is about 2 miles and would take the average user about 20 minutes. The same trip by car at rush hour (according to Google maps): 20 minutes. And on the T? 20 minutes. No wonder Hubway tags posts #realtransportation.
Having looked at the trips, I wanted to look at the bikes. I know that when I look for a Hubway bike, I try to test the bell, since it seems to be the only thing to break on the bikes. I also figured that the Mayor's bike might get the most rides, since, well, it looks cooler. Here's what I found:
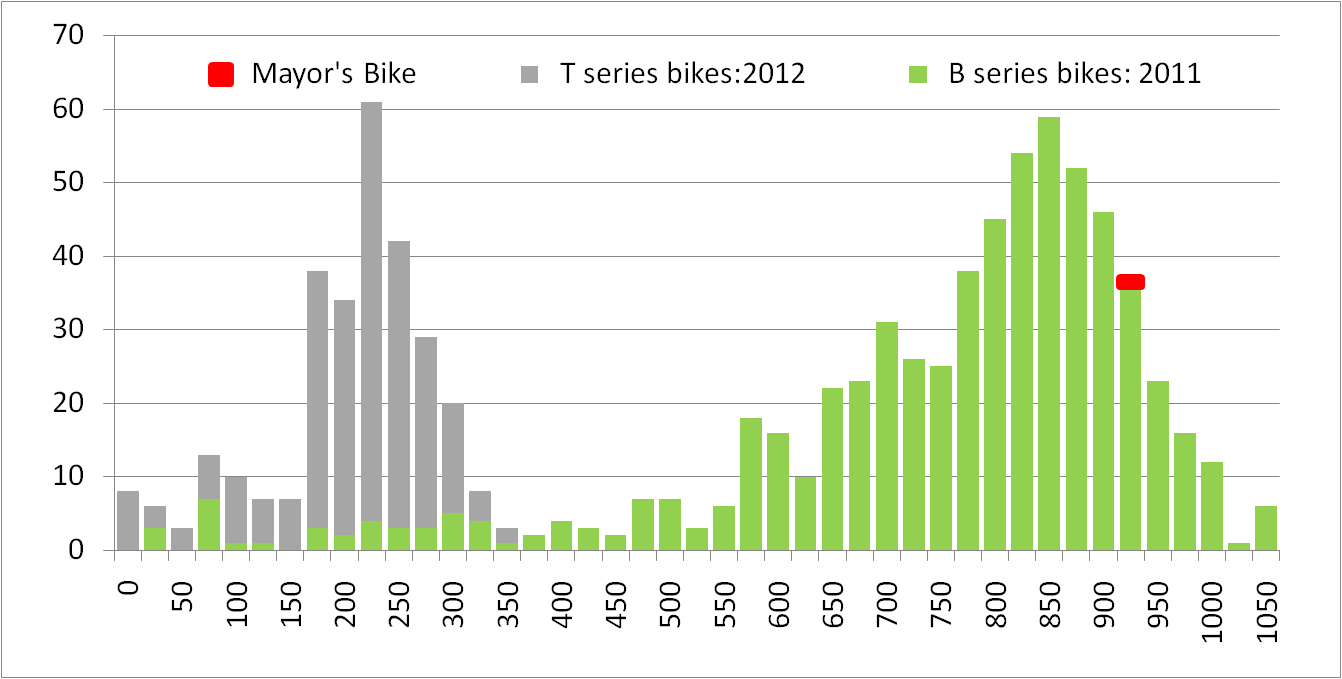
So, the Mayor's Bike (bike 00001, which I found out by comparing a trip on Strava to the trip logs but was later disclosed on Twitter) is amongst the higher-used bikes, but by no means the highest. Even if you take out casual users (who might be scared of something different) it still lags.
Having explored who is using the system, and when, the next question is to see how we can map these data.
Ari Ofsevit | www.ariofsevit.com | @ofsevit