The art and science of a short turn

This post has been a long time coming. A while back I asked people on Twitter if they would be interested in a post about bus bunching and short turns (answer: a resounding yes) and have been stewing on it for a while. I’ve gotten some feedback that this post is too long, so if you don’t care (and it’s quite possible that you don’t) feel free to skip and read something else. Thanks to my coworkers for looking this over and giving feedback, and the bus drivers on the service who executed the short turn.


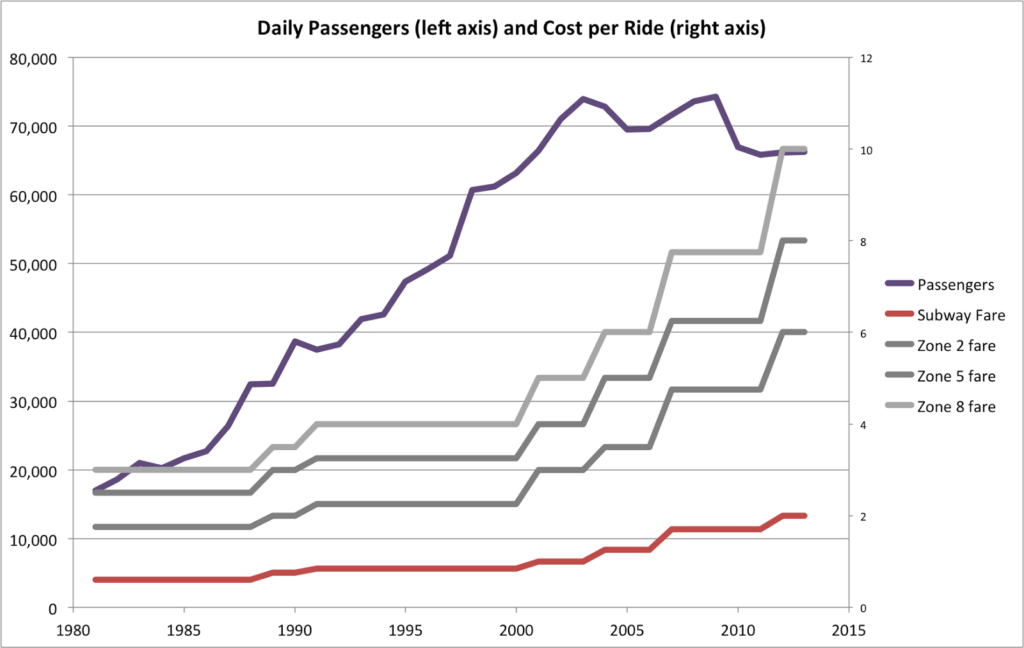
A bit of background: in my day job, I work for the Charles River TMA. One of the programs we manage is the EZRide shuttle: a small, last-mile commuter shuttle between North Station (major transit node) and Kendall Square (major employment center). The service has been around since 2002, is mostly funded by local employers and property managers, and sort of serves as another branch of the CT buses, connecting North Station, Lechmere and Kendall. We carry about 2500 passengers per day, and are near or at capacity at peak hours (7:45 to 9:00 AM, 4:15 to 5:30 PM). Most of our ridership is comprised of Commuter Rail riders who work in Kendall. The shuttle is free to corporate members and open for a cash fare to the public.


For the purpose of this blog, I am italicizing certain transity jargon and defining them at the end of the article. Our organization contracts the route to a private operator, and we both have dispatch duties. As it breaks down, they mainly deal with driver issues (broken down buses, drivers needing time off the bus, work schedules) and we keep an eye on passenger issues (loading, bunching, headways).


Our route sometimes allows us short turns, especially when there’s bad traffic, but that successfully implementing a short turn takes a lot of know-how, and a bit of magic and luck. Some short turns are relatively easy: two buses are running back-to-back, the first bus as 33 passengers and the second bus has two. (This sort of bus bunching—here’s the best resource on that from WBEZ—is all too frequent on busy routes, even when buses run at a scheduled, even headway.) If we can empty the second bus on to the first, we can turn the first bus back to fill a gap elsewhere on the route. This only works if there is a need precipitated by traffic, but that is often the case.


Since many people have asked (okay, maybe a couple people) for a description of a short turn, here is one, with way too many words, and a bunch of maps, too. A follow-on post talks about locations where the MBTA could implement short-turns.


*****


The Route


A short turn doesn’t just happen. It comes about from a unique set of circumstances, deep knowledge of the route, traffic, passenger loads, the weather, an innate, built-up sense of what the route looks like and how it will be affected by traffic and loading in to the future. Sure, there’s some luck thrown in, but most of that is self-made: a well-executed short turn should be more science than art—it just feels like luck when it works. (And it doesn’t always work; rule number one, before you even consider a short turn, is to try to at least not make things worse.) I’ll describe a recent short turn success, and the elements that go in to it. The whole of the operation, from diagnosis of the problem to the successful implementation of the turn, took about 12 minutes—likely shorter than it will take you to read this blog post.


We have separate morning and evening routes, due to passenger loading (our reverse-peak carries MIT students) and one-way streets. The route map can be found here, and our route in Nextbus’s interface here. The route requires several routes and jogs, mostly due to one-way streets, and it’s prone to traffic, especially during construction. Our evening route can be roughly divided in to four segments, each of which takes about 15 minutes, with 16 minutes of recovery time as follows:

Inbound:
Cambridgeport to Kendall Square (moderate commuter ridership, minimal traffic delays)
Kendall Square to North Station (heavy commuter ridership, moderate to heavy traffic delays)
[12 minutes of schedule recovery time (necessary due to traffic)]
Outbound:
North Station to Kendall Square (minimal commuter ridership, moderate traffic delays, although heavy recently)
Kendall Square to Cambridge (moderate student ridership, minimal to moderate traffic delays)
[4 minutes of schedule recovery time at Cambridgeport]

*****


The Situation


On Thursday, April 9, we had some operational issues. Due to traffic signal timing problems, O’Brien highway backed up, and we experienced a 10 to 12 minute delay on our outbound route (this section carries very few passengers at this time of day, but it is necessary to get our buses from the terminal back to the start of the route). On a nice day, we might have some buses operating empty outbound through Kendall Square, but with cold rain on April 9, we had no buses which were empty and could be rerouted, so we couldn’t deadhead a bus to the terminal, or an intermediate part of the route.


The scenario was to the point where we had a 15 minute service gap. This is not good for a few reasons. First, this is double our scheduled headway is 8 minutes, so this was nearly double our schedule, even if it means that waits will only be a few minutes longer. But the issues would cascade: the first bus to pick up during this gap would fill up well before the end of the route, meaning the headway for later stops would be longer and would wind up being based on the headway of the second bus, so it would wind up being more in the 18 to 20 minute range.

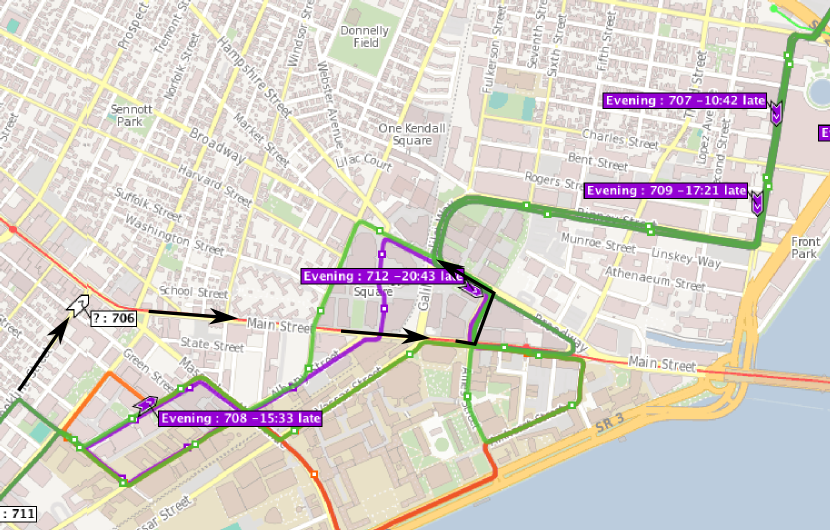
And then: the bus that was supposed to run called in with a mechanical failure. All of the sudden, 7 of our 9 buses were on the outbound route, and we were facing a 20-24 minute service gap. In other words, we were screwed. Here’s the setup:

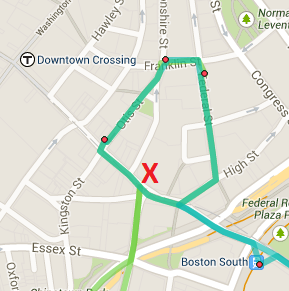
The arrows show the inbound route, and the red dots show the major passenger generators at this time of day (peak rush hour); as you can see that there are no inbound buses between the west end of the route and the eastern terminal (just off of the map) except for bus 9901, which is most of the way there. (Ignore the times “late”; we’d already had some delays to this point.) Bus 711, shown in gray, is broken down. And the driver of bus 708, at this point, got off his bus to try to diagnose the issue of 708, and due to radio traffic we were unable to tell him to get on his [goddamn] bus and drive the [goddamn] route.

So now we had a problem. 706 caught 708. We needed a bus to run the route, but expected it to fill up before it could board all the waiting passengers, especially at the three red dots. It also coincided with the peak loading time for our route, when even under normal operations buses can load to capacity and leave riders behind. We could send a double draft to run the route, but then the second bus would wind up empty behind the first bus as it boarded passengers (most of our route is too narrow to safely pass) meaning that the passengers later in the route would have a longer wait. While I was yelling at no one in particular about 708 (in our office, using curse words) my boss (who has been watching this route for more than a decade: that’s institutional memory) mentioned that we could deadhead 706. What a splendid idea—as my ire grew with 708 for attempting to fix a broken down bus and not just covering the route I hadn’t noticed this possibility. (To be fair, the driver of bus 708 probably didn’t realize the situation on the rest of the route.)


*****


The Operation, or, the Rules of the Short Turn

Rule #1 of the short turn: Don’t Make Things Worse


The first question to ask in a short turn is: will this actually make much of a difference, and might it make things worse? If you are going to move heaven and earth to get a bus somewhere 90 seconds earlier, it’s much easier to just have buses run the regular route. Unless you can solve a loading issue and a headway issue together, it’s rarely worth doing. (A service gap in a non-peak direction affects many fewer passengers than in the peak.) The second question is: will this short turn now cause more problems later? If the answer is yes (and quite often it is), you have to weigh how severe of a problem it will be, and when it will occur. Can you solve an inbound issue at 5:15 that creates an outbound service gap at 6:15? Fine, better to improve the ride for 50 riders and inconvenience a handful at a much less busy time. If you can get two people off of the second of a bunched pair and on to the first, turn the empty bus and cut the wait time for two dozen, totally worth it. But if you’re trading off a delay for three people now versus a delay for five people later, it’s not worth doing. 


In this scenario, we were not going to inconvenience anyone, really, and improve service for a lot of people (and get buses better spaced in to the future). It was a no-brainer.


Rule #2 of the short turn: Know Your Route.

If you’re running a short turn, you need to know your route. You need to know where a driver can go around a block easily, or where they might get stuck in traffic (or worse: a tight corner not suited to a 40 foot bus, a frequent problem in Boston). Before you can do this kind of active dispatching, you have to know where you can safely and expediently turn a vehicle. It helps to have twenty-plus years of dispatching in the other two members of my office (I’m the new guy): they’ve been through everything. Construction detours, full road closures (the Craigie Bridge reconstruction), never-ending blizzards (okay, that was this year) and the like.


Due to the one-way nature of Kendall Square, the route does have a bizarre loop built in, which takes a couple of minutes to traverse but accesses a major stop. So one idea would be to deadhead bus 706 and have him run out of service (and preferably off-route down Main Street to Ames: nothing makes passengers angrier than seeing an empty bus drive by without stopping) and pick up at the last red dot on Broadway. If he got there expediently, he’d be able to at least pick up at that stop—and ensuing stops—and mitigate the service gap there, and take on the passenger load the first bus, 708, would not be able to pick up.


Rule #3 of the short turn: Be Invisible.


To passengers, at least. The best short turn is one where the deadheaded bus doesn’t pass any passengers waiting, where no passengers are asked to leave the vehicle, and where, except for the driver and the dispatcher, no one knows. This could also be phrased as “don’t piss off the riders” which is always a good policy: sending an empty bus past waiting passengers is a recipe for angry calls and emails. Generally, we operate under a policy of transparency with riders (we will suggest alternate transit means during especially bad traffic, for instance—it’s beyond our control but our goal is for our passengers to get where they’re going, not to boost our ridership), but we don’t feel the need to describe every piece of our operation. In the case of a short turn, we might send out a Tweet such as “Service gap inbound due to residual traffic delays and disabled bus. We will attempt to redirect service to fill this gap” usually suffice.


Rule #4: Know your Drivers

Now at this point it is worth pointing out that that you really need to know your drivers when juggling buses in this manner. Some of the drivers on our route could dispatch themselves: they have an innate idea of where every other driver is on the route, what their scheduled times are, and what their likely traffic and passenger load impacts will be. (Another recent night, two long-serving drivers basically rerouted each other and other buses, on the fly, to avoid traffic and fill route gaps far better than I could have even while staring a map of the bus GPS locations.) Other drivers are newer to the route and may not know the vagaries of Cambridge’s off-route street grid, and need a lot more guidance across the route. In this case, the driver of 708 is somewhat newer and knows the route fine, but harder to manage: we were happy that his only instructions were to run the regular route. The driver of 706 is one of our best and has been driving the route for a while; a simple instruction like “deadhead to Main Street, left on Ames, first pickup on Broadway” would be all that he’d need.

So that’s what we did. Bus 708 would run the regular route making all stops, and would likely be full at Kendall Square. (The buses we currently run are 35 foot buses with 32 seats and a stated crush load of 45, although more passengers have been known to cram aboard.) There was no point holding 706—we had another outbound bus behind him—so we sent him to do the pick-ups beyond Kendall, but to take a direct route there, leapfrogging ahead of 708 and shortening the wait at the subsequent stops (and we expected him to fill up at those stops). 708 would then run by those stops a couple minutes after 706, so would have fewer passengers to pick up. 


Rule #5: Pay Attention.


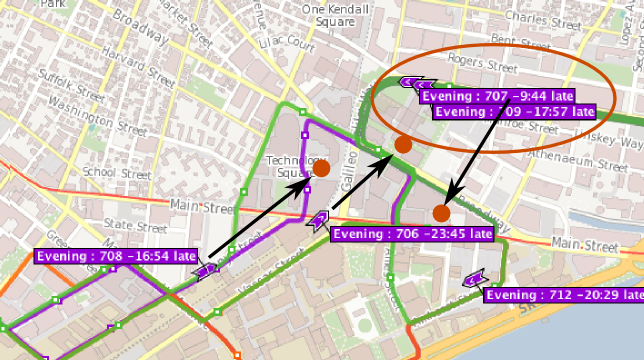
But the operation isn’t over until the buses are back on the regular route, drivers know future departure times, and they have recovery built in to get back to normal. So far, everything was going according to plan, but you have to pay attention to a short turn until it’s on its way to a logical conclusion. 706 had made good time on Brookline Street and had chosen an appropriate, off-route path for his deadhead; again, had this bus passed a group of long-waiting passengers, they’d go from irked to irate. 708 was serving some moderate-ridership stops, and headed towards Technology Square, where he’d take on many more passengers. 

#Protip: if two buses are coming together, take the second one. It’s unlikely to be any slower (it might actually pass the first bus) and you’re more likely to get a seat.

Anyway, the plan was working, rather swimmingly. And then: nirvana. See how, above, bus 707 is catching up to bus 709? While this is not a busy part of our route, but on a rainy day, there are some passengers who will take a circuitous bus ride to Kendall rather than make the walk. So while bus 709 was stopping for a rider here an there, 707 wasn’t, and he radioed in that he was behind bus 707, and was empty. Bingo. We were worried 708, upon reaching Kendall Square, would be too full for the boardings there. But 707 could conceivably balance the load between three buses as long he was slotted in before 708 reached Kendall. Each of the main passenger nodes would get its own bus, balancing the load well. If it worked. It was worth a try.


But remember: you have to know your drivers. 712 is a driver who had recently bid on to our route, and had had some issues with the route (not entirely his fault: our route flips based on the time of day—since we serve students and commuters in separate directions—and can be confusing for both riders and drivers to learn, although once familiar, it works quite well) and certainly didn’t know his way around Cambridge. In other words, if he’d been in 706 a few minutes earlier, it’s doubtful we would have sent him on the deadhead in the same way we did 706.

Somehow this worked.
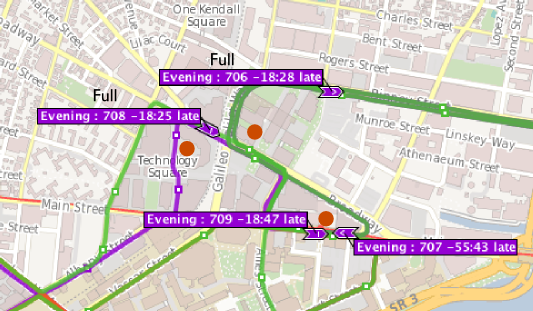
But we could coach him through it. 706 and 708 had their charges, and the radio channel was clear. So the call went out. “707: take a left on Broadway, then proceed straight down Main to Third Street. Make a right turn there, and make your first pick-up at Kendall Square.” We’d have to watch him like a hawk and keep in radio contact: if he missed the turn there, at best we’d have to coach him on to Memorial Drive, and on to the outbound route (a portion of our route uses Memorial Drive, and our drivers have never missed the turn and gotten stuck under the Mass Ave overpass). At worst, we’d lose him across the Longfellow for half an hour. (Don’t laugh. This has happened.) The short turn can be dangerous.

And it worked! 707 made the short turn in to Kendall and instead of following 709 on the outbound switched to the inbound. Astonishingly, we had evenly spaced the buses with about 3 minutes between each, which is particularly impressive since that meant that 706 was now 6 minutes—nearly a full headway‚ ahead of 708, who had left the route terminal behind him! And both 706 and 708 were nearly full, so bringing in 707 kept bus 708 from reaching Kendall, filling up there, and then reaching the next stops later, with more passengers to pick up, filling further, and perhaps leaving passengers behind. Much of the credit goes to the drivers, who let us know their situations (when they were empty and bunched) and were willing to jigger their routes in order to balance the load. The fact that such reroutings are not infrequent means that they’re used to being asked to do so, and that they execute the maneuver well.

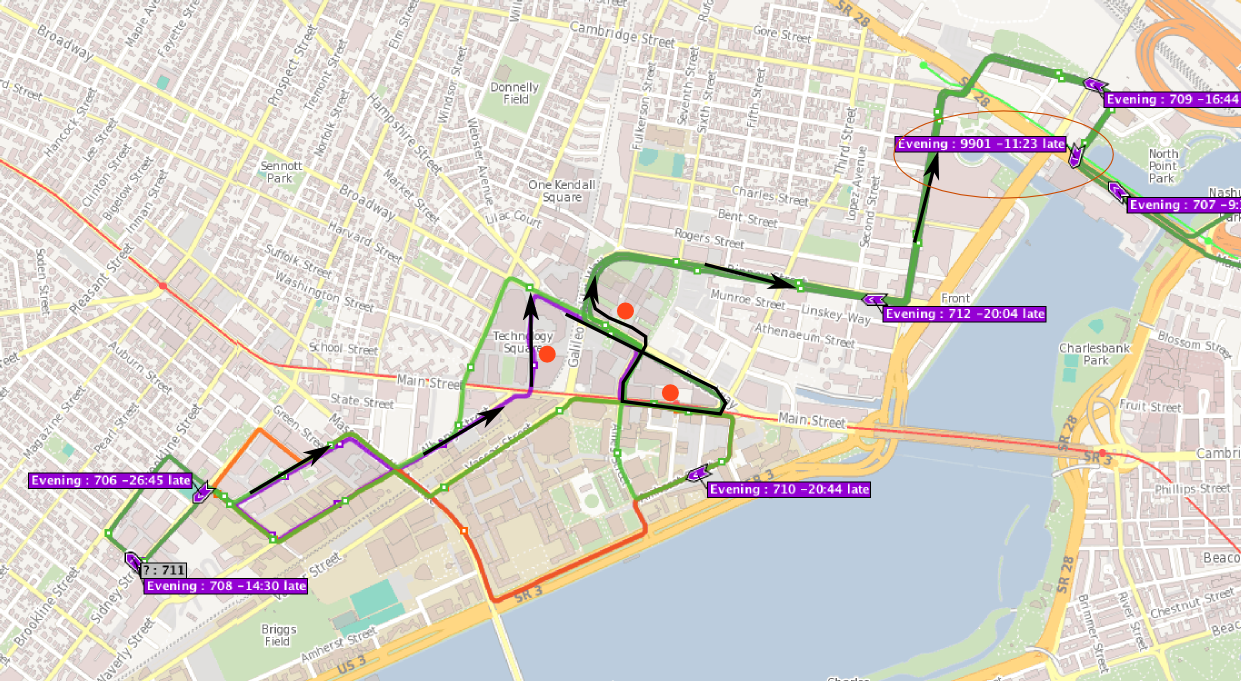
Once the buses had all made their way on route, we actually had well-spaced buses. In fact, 706 and 708 were a full headway apart at this point: had we not deadheaded and short-turned they’d both be where 708 was, and we’d have cascading issues as they both ran into and then out of the terminal late. (Often, a headway issue at 6 PM can be caused by a traffic jam at 3:30.) But the pieces of the puzzle had fallen in to place, and the short turn had been executed, successfully. 

This is pretty much what our map should look like in normal service. (Well, except that the buses were way off their originally scheduled runs, but if I look at the map and every bus is 20 minutes late, that means that we have even headways and just had some issue earlier on.)


As my boss said, it was ballet. It was all over in about 12 minutes. But the best part? We had the buses in numerical order: 706, 707 and 708. Boom.


*****


The Aftermath

Why “art and science (but mostly art)”? It’s often suggested that computers could do this better than people, and why do transit agencies employ dispatchers, anyway, since an algorithm would do a better job? But that assumption is flawed for several reasons. First of all, unless an algorithm has nearly perfect ridership data, someone familiar with the route will have a better idea of where and when stops have heavy demand. Second, an algorithm would have to be able to not only know that a deadhead route will have less traffic at a given time than the normal route, but also communicate that route to the driver (and, frankly, I don’t find Waze and its ilk that useful at the block scale). And the algorithm would have to know which buses were full and empty: passenger counters are not perfect, but a driver can pretty quickly and easily respond to a radio call of “do you have any passengers?”

But the fundamental issue is that this type of service is dealing with people, both drivers and passengers. It’s pretty easy for a person—with some knowledge of the route—to balance out which stops to serve, and in what order, and what stops to prioritize. Maybe you’re a bit less concerned with Kendall Square because it has a shelter, so a minute or two longer there isn’t a problem. Maybe you know that given the weather one stop is more likely to be used than another because it has an overhand or an alcove for people to stand at. Maybe you know one driver is able to navigate the route faster than another (we have one of these: he drives safely and smoothly, but knows the route so well he regularly covers it faster than any other driver), while another is slower. Maybe one bus is balky and you don’t want to push it lest it break down.


Certainly you don’t want to deadhead an empty bus past a full bus shelter, or incur the wrath of customers who—even if you are doing it for the benefit of the service—would be understandably upset. And it’s also important to know your drivers, know what they are capable of, and talk them through what they need to do. Because despite all the talk of autonomous vehicles and hyperloops, right now and for quite some time to come, buses are driven by people and carry people, and despite various limitations, there are certain things where the Turing Test is still yet to be achieved.


A subsequent post will discuss routes where the MBTA could potentially use short turns to mitigate the effects of bunched buses.

Glossary:

Deadhead: run an empty bus without stops, and possibly on a more direct route.
Headway: the time between buses.
Double draft: two vehicles running together; more of a train term coopted here.

How much money could All Door Boarding save?

This is sort of a post-live blog from Transportation Camp NE. One of the first sessions was regarding all door boarding on the MBTA. There are a lot of ins and outs—notably, that you have to account for all scenarios where people could access the system, for example potentially without paying a fare (Silver Line airport) or having proof thereof (boarded with a friend who paid and parted ways)—but it was a good discussion, and something that is moving forwards, but needs to move faster. I pointed out that the discussion needs to not be pushed by the small minority who complains (loudly) about fare evasion, or really by fare evasion at all, but by vehicle speed and efficiency, since 95% or more of passengers already pay their fare: we need to improve service for the vast majority.


Often, when we talk about all door boarding, we talk about the real and potential time savings. Muni, in San Francisco, started experimenting with all door boarding, and it turned out it worked really well, and they went system-wide, and it has saved passengers time. According to their final report, it saves 1.5 seconds per passenger boarding or alighting, and speeds overall vehicle speed by 2%. 1.5 seconds does not seem like a large number, but it begins to get a lot bigger when aggregated over a large number of passengers.
SF Muni and the MBTA have a similar number of surface passengers: about 500,000. (The T has about 400,000 bus passengers and another 100,000 or so surface boardings of light rail; looking at only surface lines, the T and Muni are actually quite similar in terms of size.) So, if we can save 1.5 seconds per person—we’ll look only at boardings, since many trips either end at a terminal station where all doors are used or are surface Green Line boardings that end in a tunnel—we wind up with 750,000 seconds saved per day. This is, rounded down a bit, 200 hours saved. The cost of operating an MBTA bus is about $163 per hour, and for a light rail vehicle $250 per hour. Let’s assume that half of that is direct operating cost: operator wages and such. Assuming the lower bound, it would save $16,000 per day. Even if there were no savings on non-weekdays, in 250 weekdays it would equate to operational savings of $4 million
Savings add up, quick.
Let’s look at it a different way. A full, two-car Green Line train in the morning carries approximately 300 passengers. On the B or the D lines, the surface portion of the route takes 32 to 34 minutes to run at peak rush hour (according to the T’s scheduled time). Saving 1.5 seconds on each of these boardings, would equate to 450 seconds, or 7.5 minutes: more than a 20% savings for the above ground route. With the addition of signal priority on the B line, you could be looking at speeding the route by 30% or more—a game changer for one of the slowest—and most heavily-used—surface lines.
The transit planners will say “well, these savings will probably just be added in to headway recovery time.” First of all, if you actually do realize a 7 minute saving, you’re talking about an entire rush hour headway, so I doubt it will all disappear, unless you are going to be lining up multiple vehicles at rush hour. But second of all, if these wind up making headway recovery times much more even, that’s great. That means you’ll have the same capacity without having to dispatch a train as soon as it arrives, but rather on even headways. This is likely to reduce the number of vehicles that wind up bunching, overloading and slowing down.
But let’s run with the $4 million figure. There are, on buses and the Green Line, probably about 1500 doors that would need car readers. If a pole-mounted reader costs $4000, the system could be paid for in a year and a half. Or if the system were assumed to last five years, you’d have $20 million to put towards the cost of the readers ($6 million) and additional enforcement ($12 million, or $2.4 million per year).
Oh, and customers? They’d get a faster ride. It’s a win-win, for everyone. Except the few curmudgeons who are less concerned with how the vehicles run, and more about the anecdote about the person they once saw jump a fare gate.

Downtown Boston is Busmageddon? Really?!

Update: A shortened far less ad hominem version of this has been published in Commonwealth Magazine.

Every so often an article comes along which is so inane, so poorly researched and so utterly stupid that it requires a line-by-line refuting.

The article in question, which has a dateline of March 31 so I’m assuming it’s not an April Fools joke, is:

End downtown Boston’s busmageddon Add reworking bus routes to the MBTA’s to-do list

Oh boy.

The first four paragraphs go on about how people are taking public transit in Boston. Fine. Then you get to paragraph 5:

We need a comprehensive policy regarding usage of the public way. 

Good! We agree. We do need a comprehensive policy regarding usage of the public way. Right now, approximately 75% of the roadways in Downtown Boston are dedicated to automobiles. Another 20% are sidewalks, and 5% are bike lanes. Yet the number of cars is decreasing (to quote the author two paragraphs earlier), and the majority of people coming to Boston don’t use cars. So why do cars (as usual) get the vast majority of space? Why should they get all the real estate if they only account for a minority of travelers? Who knows.

Loading must be done during limited hours, as is the case in other great cities.

Loading? Fine. That’s a halfway-decent point. Care to elaborate? (Apparently not.)

To keep the city from devolving into perpetual gridlock, we also must address tour buses and MBTA buses downtown.

Boston has no through bus routes through downtown, the only city in the country to do so. Perpetual gridlock? How much of the gridlock downtown is caused by buses at Haymarket (in their own terminal, mind you), the Franklin-Federal loop, the Silver Line and a few other sundry routes, as opposed to, say, tens of thousands of cars trying to ply narrow streets downtown? Tour buses? Sure, get rid of those space-hogging menaces. But getting rid of a few MBTA buses? Please.

And what of these other great cities? What do they have in common? London? Bus lanes. New York City? Bus lanes. Minneapolis? Double bus lanes. Boston? Well, we have the Silver Line, but it barely has bus lanes downtown.

Let’s get the buses off of our streets so that pedestrians and bicyclists can be safe.

Red herring! Red herring! Red mfing herring! T Buses account for, oh, maybe 2% of traffic downtown. Maybe. Probably less. Certainly far less than any other city in America. Take a look at Bostonography’s great bus speed map (a screen capture to the right). Notice that there is actually a gap in Downtown Boston with no bus service. Compared to nearly any other city in the country, Boston has less bus service in its downtown. Other top bicycling cities like Minneapolis, Seattle, San Francisco and Portland have many more buses, yet no one is demanding that buses be pushed to the outskirts there.

Yet buses are menace to pedestrians and bicyclists? Should we consider doing something about the other 95% the traffic downtown? The cars? Or are pedestrians and cyclists somehow immune to them?

As Doug Most reminded us in The Race Underground, Boston constructed the first subway tunnel in the late 1890s to get trolleys off the street; we can certainly do likewise today by making good on the commitment to a tunnel connecting South Station with the Silver Line spur that heads to Dudley Square.

Oh, good lord. Yes, we could spend $2 billion to build the Silver Line Phase III tunnel. Somehow this would solve all of our transportation problems. Except for the buses going to Haymarket, South Station and all of the express buses. It wouldn’t really get any cars off the street (although by his logic, cars on the street aren’t the problem). It would create a low-capacity, slow route that could be replicated for 1/100th of the cost with signal priority and bus lanes. But that might impact cars and their drivers dense enough to think the best way to Downtown Boston is to drive.

There is also no reason why people wanting to go to Salem should have an express bus waiting for them around the corner from Macy’s …

Most people going to Salem don’t wait by Macy’s: they wait at the Haymarket bus station. (Also, if you’re actually from Boston, it’s Jordan Marsh. But I digress.) It’s not perfect, but it’s covered, and the buses pull in to a busway to load and discharge passengers. But so what if they do? Downtown Crossing is right in the center of the city. If we make people from Salem walk ten minutes, or squeeze on to an already-over capacity subway train, they’re more likely to say “the hell with it” and drive. Do cars cause congestion? Or just the 16 buses per day that run from Salem to Downtown Crossing?

… nor should city street patterns necessitate that a bus make a left turn from a right lane to meander through downtown streets to get to the Mass Pike.

The 500-series buses do load on narrow streets and have to reach the Mass Pike. Why? Because they are basically the replacement for the other two tracks of the Boston and Albany railroad. When the tracks were paved over for the Turnpike, the 500-series buses replaced local service there. There were proposals in the ’40s to run service similar to the Highland Branch from Park Street, out the Tremont Street portal, on to the tracks parallel to the current Worcester Line, and out to Allston, Brighton and Newton (huge file here). Instead, we had got the Turnpike, which express bus service, which is express until it sits in Turnpike traffic. If you hadn’t built the city for cars, you wouldn’t have to worry about the buses; the streetcars could be underground in that aforementioned tunnel.

Large buses making wide turns on narrow downtown streets, even more narrow because of mounds of snow, clog the streets and imperil the safety of the public. 

Large buses clog the streets? What about parked cars? What about moving cars in traffic? How about we eliminate downtown on-street parking and give the buses their own lanes, and make sure the mounds of snow are removed from them. And do only the buses imperil public safety? No pedestrian has ever been killed by a car, right?

We should eliminate bus lines which make no sense and relocate the terminus of lines now heading downtown to South Station and North Station …

We have an intercity bus terminal at South Station. It’s at capacity. There’s no way to add T buses in to it. And it’s a five minute walking transfer to the already-over capacity Red Line.  The current routes that could conceivably go to South Station aren’t perfect, but they seem to work. Maybe we should create a network of downtown bus lanes instead? Cyclists and pedestrians would know where the buses would be, and it would help buses move through downtown more quickly.

And North Station? That’s why we have the Haymarket bus station. It has room for buses and easy connections to the Orange and Green lines. Perhaps when the Government Center Garage is rebuilt, it will include a better bus terminal and connections, and bus lanes across the bridge to rebuilt bridge to Charlestown.

… where there is access to underground transit, commuter rail and the interstate highway system.

Yes, there is access to underground transit. That’s all well and good. Except that underground transit is growing faster than other parts of the system, while struggling with decades-old equipment and overcrowding. Most downtown buses operate like commuter rail: they go from the suburbs to the city. There’s little need for passengers to transfer to commuter rail, rather they want to transfer to their place of work. Instead of dropping people at the outskirts of downtown, we should have more central bus routes that balance operational efficiency with getting people where they want to go. Give as many people a one-seat ride and a comfortable place to wait, and they’ll be more likely to ride.

Even as we eagerly await the Red Sox return to Fenway Park, and the melting of the last mounds of snow (most likely in that order), we should be thinking – and planning – ahead.

If you really want to encourage safer streets, getting rid of transit is certainly not the way to go. Planning ahead will certainly be important, but let’s plan the right way. The right way might be a congestion charge, to get cars off the streets at peak times. The right way might be to build bus lanes so that bus riders have seamless trips through downtown to their destinations. The right way might be to require tour buses, an actual menace to pedestrians and cyclists which provide no actual public good, to stick to certain streets, routes and times.

Or the right way may be to raise the goddamn parking tax. Right now, Boston has one of the lower parking taxes around. Because parking is very much constrained, it is not subject to the whims of supply and demand: a daily tax on parking spaces would likely not even affect the consumer price much, but move some of the profit from the property owners to the city. Given the negative externalities of cars on city streets, and the fact that most people utilizing parking spaces are from out of town, the city should raise taxes and use the money to improve public transportation, perhaps starting with, that’s right, buses.

So the right way is not to demonize public transit and couch it in the guise of pedestrian and bicycle safety is disingenuous at best. Ignoring the fact that nearly all traffic downtown is made up of cars driving on subsidized roadways and offering debunked solutions is a farce. Note the red X on the map to the right. It shows the location of the author’s office in relation to the 448/449/459 and 500-series bus routes in Boston. What are the chances he’s just rubbed the wrong way by seeing a bunch of buses outside of his office? You know, buses that make it really convenient for people to get there?

Let’s build better bus facilities. Lincoln Street and the Surface Artery which all the 500-series routes follow have plenty of room for a bus lane (Lincoln Street has two lanes of traffic and two of parking). Federal has parking on both sides. Why not take some of that space which is making the streets narrow and dangerous and use it for buses? It might make it a little less convenient for Mr. DiCara to drive there. That’s probably his real beef.

And Commonwealth Magazine should be on the hook, both for not fact-checking this article, and for letting someone with no actual expertise in the industry write it in the first place. Just because he saw a lot of buses at Lincoln and Summer one morning doesn’t mean that they’re the problem. I wonder how he gets to work, anyway?

Mapping Gov on the T

There’s a great grassroots group which is pushing for Massachusetts state legislators, who live within an hour (*) of the State House, to take the T to work on March 19, called Gov on the T. They have a list of members of the General Court, and have asked for commitments as to whether the will take the T to work. I decided that this begged to be mapped, so I did.

First, a couple of words (and the asterisk above). I have no idea how they calculated an hour, but it doesn’t make much sense, and there’s a fragmented area that is represented by the officials they’ve asked. For instance, the representative from Billerica is not listed, but lawmakers from Lowell are. The Senator from Gloucester is on the list, but not the representative. The representative from Bridgewater is on the list, but the one from Hingham is not. I think it would make much more sense to apply this test to any Senator or Representative who serves constituents in a town within the MBTA’s service district, which I’ve outlined on my maps.

(GovOnTheT, if you are reading, this, I am happy to select these districts and give you a list.)

Anyway, here is a map of House members who have pledged to take the T:

And here is a map of the Senate:

I think this is great, and partially because it is very grassroots: it’s not being pushed by a lobbying group, but by a couple of people who are pissed off that their legislators all drive because they have free parking on Beacon Hill. I hope that Gov on the T becomes a regular happening, and that legislators are held accountable. Those who don’t take the T—and vote accordingly—ought to get primary challenges, especially in districts where many of their constituents depend on transit. Take a look at some of the districts where representatives aren’t taking the T. There’s Lynn, Revere, Winthrop and the South Shore. And districts where the representatives are MIA, for instance: much of Cambridge’s Senate representation and house members in Newton, Brookline and most of Boston. Let’s hold our representation accountable.

ONE NIGHT ONLY! The T will provide 24 hour service this Saturday

It’s kind of gimmicky, but this Saturday, the good ol’ MBTA will be pretty darned close providing 24 hour service on some routes. The reason? Well, to start, late night schedules, but mostly because it’s the beginning of daylight savings time. Here’s the alert from the T:

Saturday: Despite the start of Daylight Savings Time, the number of available Late Night trips will remain the same Sunday morning (March 8). Last trains will depart from downtown at 3:30 a.m. with outer connections following later.

At 2 a.m. on Saturday, the clocks will magically advance to 3 a.m. The MBTA services running will not magically disappear in to the ether, but the T will basically assume that the time change won’t take place until the end of service. So some of the latest-running trains and buses, which normally don’t finish their runs until about 3:00, will actually not reach their terminals until 4:00. Notably, the last 28 bus will reach Mattapan at 4:05 a.m., the last Mattapan trolley will arrive around the same time, and several other lines will operate until about then.

Most T service doesn’t begin until 6 a.m. on Sunday mornings, but a couple of lines, notably the aforementioned 28, operate early airport service. (There should be a discussion that better service should be provided to the airport, which has expensive and limited parking, many low-wage jobs, and many early shifts, and which is completely inaccessible from most of the city by walking or bicycling, because ocean.) So service at Mattapan this Saturday will include:

3:00: inbound 28 bus departs *
3:15: outbound 28 bus arrives
3:20: inbound 28 bus departs ‡
3:40: outbound 28 bus arrives
3:45: inbound 28 bus departs *
3:59: inbound 28 bus departs †
4:05: outbound 28 bus arrives
4:45: inbound 28 bus departs †

* Saturday late night service   † Sunday AM service   ‡ Trip scheduled on both Saturday late night service and sunday AM service (!)

Now, it’s worth noting that there is a service gap of nearly three hours in outbound service: the first outbound bus on Sunday isn’t scheduled to arrive in Mattapan until 6:40. But what I find most intriguing is the fact that for nearly an hour, the Saturday and Sunday service actually overlaps (on a normal weekend, the last outbound arrival comes in just 15 minutes before the first inbound departure). Most interesting: the 3:20 a.m. inbound trip can be found on both the Saturday schedule (the 2:20 inbound trip bumped an hour) and the Sunday schedule (the regular 3:20 departure). Will the T run two buses inbound from Mattapan simultaneously, one on a Saturday schedule and one on a Sunday? It’s almost worth venturing down to Mattapan to see.

These are strange times we live in indeed.

Bus efficiency: Passengers per Bus

I’ve been intrigued by a few statements and metrics regarding buses recently. The first is that Beverly Scott recently said (on the radio, I think) that the T really should have many more buses than it does; she’d expect an agency the size of the T to be running 1500 buses, instead it has only about 1000. The second is that the T can not add any buses to the fleet, not only because of the cost of acquiring and operating new buses, but because there is physically nowhere to store and service them: the current bus yards are maxed out. And with proposals floating around for post-Sandy-New-York-style bus bridges, there would need to be a lot more buses in the fleet for that to happen.

My question was how heavily used the T’s buses are, especially compared to other systems. For every [fill in the route number here] bus that is jammed full of passengers, there’s a late-evening 350 with just a few riders. I decided to look at the ridership and fleet sizes for large bus fleets in the US, and see how many daily passengers there are per bus in the system. (Note that most fleets carry a 20% spare ratio, so the actual number of passengers a bus will carry in a day is 20% higher.) The short answer is that the T falls in to the normal range of major systems, if even at the lower end. The longer answer is that each system is different, and comparing them is all comparing apples to oranges.
You came here for charts, right? Here’s one. On the right axis are US bus systems with more than 200,000 riders per day. On the bottom axis, the number of riders per bus. I’ll get to the colors below.
So note that the systems in San Francisco and Chicago perform way ahead of anywhere else. The reason there is twofold. One is that in both systems, buses are the backbone of the system: they carry more passengers than the cities’ rail systems, so that many of the busiest corridors are served by buses. In fact, of the top tier of transit cities (there’s a big drop from Seattle, with 390,000 riders, to Baltimore, with 250,000), Boston, New York and DC are the only cities with more rail riders than bus riders. The MBTA’s bus system really operates as a transit feeder system (and always has); the only “Key” bus route in Boston which serves Downtown Boston—other than the Silver Line—is the 111. Most of the busiest bus routes—the 1, 28, 39, 66 and so forth—are either crosstown routes or feed a transit line.
The other difference on the above list is that in several cases, the bus systems primarily—or only—serve the city, with a separate system (or systems) serving outlying areas. For the top-eight systems (in red), only the MBTA, SEPTA, WMATA (DC) and King County Metro (Seattle) serve the whole area, the rest are augmented by suburban systems (Pace in Chicago, several agencies in LA, New York and the Bay Area). For Chicago and San Francisco, I added in other agencies (Pace in Chicago, AC Transit, Golden Gate Transit and SamTrans in San Francisco, since all serve the City there; shown in orange) and it brings their passengers per bus rate in line with other systems.
In fact, it’s interesting that once this adjustment has been made, there are no high outliers: the top systems fall between 375 and 460 riders per bus. There are outliers on the lower end. WMATA is lower by quite a bit, and Seattle lower still; it’s possible the fleet size data there I am using isn’t perfect, or that they have different utilization rates. In DC, there are poor transfers between buses and trains, and rail service carries the bulk of passengers. I’m not sure about Seattle, but it has a very small rail system relative to any other system on the list.
In any case, it’s all apples to oranges because Boston is relatively unique among these systems. The buses are mainly set up as rail transit feeders (this is the case really nowhere else, at least to the extent that BERy was built on subway-surface stations), the system is region-wide, so lower-ridership suburban routes skew the numbers and buses do not carry the majority of riders. If this was a Venn Diagram of cities with more rail than bus passengers and a single region-wide bus and rail provider, only the T and DC would be in the middle. And the T does far better at bus utilization, it seems, than DC, and while Boston’s system was mostly built to integrate surface and subway lines, DC’s Metro was built long after the bus lines had already been established (mostly as streetcar lines, of course). So with the nearest we can get to an apples-to-apples comparison (apples-to-pears, perhaps?), Boston is far more efficient.
So, the T needs more buses. Except for San Francisco, the T, at ±1000 buses, has by far the smallest bus fleet of these top-8 cities (and San Francisco—with 800 buses—only has a 50 square mile service area; about the size of Boston proper; AC Transit alone has another 550). Cities outside the top-8 don’t have the same sort of capacity constraints the T (and other major bus systems) see on a daily basis. In Minneapolis, for example, the busiest bus route runs every 6 minutes. In Boston, several routes—the aforementioned 111, the not-even-key 7—run every 3 to 4 minutes at rush hour, and they’re packed. 
Having more buses would allow more operational flexibility: a route like the 70, which could see many of its problems solved with a couple of extra buses, could see such service without worrying about where to put them. But that’s easier said than done: finding land for a new or expanded bus depot isn’t an easy proposition, especially when existing land, in many cases near transit nodes, has high value. Still, ordering new buses is faster than new rail cars (one year lead time instead of half a decade) and having enough vehicles would have a positive impact not only during irregular operations, but on routes which are overcrowded right now. Buses can be procured off the shelf for $500,000 each. A $50 million capital investment for 100 buses—plus the cost of space to service new buses, of course—could have a quick but lasting impact.

Go to public meetings

A chart that looks conspicuously like one which has
appeared on this page.

I went to a public meeting tonight regarding the 70 bus. I go to a decent number of public meetings, and this one piqued my interest because of my interest (and use) of the 70. So I trudged out in the 5˚ temperatures to Watertown to talk bus schedules.

So did a couple dozen other people. But, of course, they didn’t want to talk about the nitty gritty of bus schedules. They wanted to air their completely unrelated concerns. Melissa Dullea, who manages to not roll her eyes back when people yell at her about completely unrelated topics, was great, and the conversation was steered slightly in the direction that it needed to go. She also gave me a shout-out and used a modified version of my 70 bus post to illustrate the headway issue on the route.

But we also got to discuss such important items as:

  • Whether the T was going to eliminate stops at senior housing
  • How the straps on the buses aren’t low enough and that’s why there isn’t enough capacity
  • That people don’t move to the back of the bus and could drivers please make announcements more often (why people don’t take initiative and ask themselves is beyond me)
  • It would be great if there was a device that would tell you when the next bus was coming that didn’t require a smart phone. We have those. They’re called smart phones. (The best exchange was when one guy said “it would be a big seller” and someone else said “no, it wouldn’t.)
  • That those straps sometimes are missing completely and what can you do about it. (Why not tell the T the bus number.)
Just another day riding the 70. Or, as I like to call it, the 140.
What I’m trying to point out here is that if you don’t go to a public meeting, these people will. It’s not that their concerns aren’t valid, but they’re noisy, and completely uneducated. It’s kind of like NIMBYism: they care only about what directly affects them, with no concern for the greater good. And then when there’s actually an issue: a poorly-timed bus route, like the 70, they service planners will think that no one actually cares, because all they hear about are bus strap heights. I’m serious. Go to public meetings. 
There was a great presentation later about an app (busreport.com) which will allow people to report bus issues to a central database. Right now it is Watertown-specific, but I think it would be portable to the whole system. I love user-generated feedback like this. Now if there was only a device which would let you find out when your bus was coming that wasn’t a smart phone.
I left a few minutes early to catch the 70. And of course, two buses came at the same time.

Banned in Boston: a graduated income tax.

WBUR ran a poll asking about the MBTA. They asked how people rated the MBTA (78% fair or poor; or what it’s worth, I’d rate it “fair”) and how often it was a reliable means to get around (61% “most of the time” or “always”). Nearly everyone (85%) thinks that fixing the T should be a priority, and most blame the outdated system rather than management (66%, although Republicans are more likely to blame management).

They then asked people if they would support additional taxes or fees to help fund the T. 48% said they would. 48% said they would not. (Those who supported it split between somewhat and strongly support, although opposition is skewed towards strongly oppose.) The party crosstabs are somewhat interesting: even 30% of Republicans would support new taxes or fees, more than half of those strongly.

Most of the poll’s crosstabs don’t show anything particularly interesting, and I think the pollsters made a mistake by not asking people how they typically commuted, as that would have been a very interesting crosstab (I talked to the pollster and it may be forthcoming). However, what stands out is how the spread in responses varies. I expected it to vary by geography: people in Boston or “inner core” areas would support more taxes, or be more likely to blame an old system rather than wasteful management. But that’s not the case. Instead, the responses to these questions varies by income and education, which I assume are well-correlated.

For instance:

Q: “Which of the following do you think is most responsible for the issues this winter?”
A1: Old system and Maintenance
A2: Poor management

     Overall  under 25k  25-75k  75-150k   150k+
A1:     66        53      65       72       74
A2:     17        22      17       16       10

Wealthy voters are far more likely to blame the old system than poor management. For low-income respondents, they’re only a bit more than twice as likely to blame the system than the people. For higher income respondents, they’re seven times as likely. There are similar trends when you ask about funding shortfalls:

Q: What is responsible for the system’s financial shortfall?
A1: Not enough legislative funding
A2: Waste and mismanagement
A3: Prioritizing expansion over maintenance

     Overall  under 25k  25-75k  75-150k   150k+
A1:      30       19       25       35      39
A2:      36       41       36       39      32

A3:      23       31       29       22      18

Here, a high-income respondent is twice as likely to blame the legislature than a low-income one.

Q: Would you support paying more taxes/fees for better transit?
A1: Strongly/somewhat support?
A2: Strongly/somewhat oppose?
     Overall  under 25k  25-75k  75-150k   150k+

A1:     48        40       44       50      63
A2:     48        51       55       48      35

Here’s where I think it’s interesting. Wealthier respondents are far more likely to support more taxation. By a nearly two-to-one margin, people making more than $150,000 a year support more taxes, while people making less than half that much are against it. Herein lies the problem: how do you tax the people who make more—and are willing to pay more—without raising taxes on people struggling to get by.

The obvious answer is a progressive income tax. Massachusetts is one of few states without one. The problem with changing the tax structure is that progressive taxation is explicitly forbidden by the state constitution. Oh.

(Update: here’s a good primer on the state income tax with more up-to-date numbers.)

Right now, the standard deduction of $8800 for a family makes the tax structure is slightly progressive. I’ve calculated the tax paid under the current system and a proposed progressive system for various incomes (5.15% after the standard deduction). On the left are the median incomes for each quintile of earners in Massachusetts (from 2006, but the numbers haven’t changed too much since then). On the right are what would happen if you raised the standard deduction to 10,000 and had the following graduated rates: 4% to $25000, 6% to $75000, 8% to $150,000 and 10% on income above $150,000.

Income       Tax       Rate     New Tax    New Rate
$20,000      $577      2.8%     $400       2.0%
$48,000      $2019     4.2%     $1580      3.3%
$75,000      $3409     4.5%     $3200      4.3%
$105,000     $4954     4.7%     $5600      5.3%

$175,000     $8559     4.9%     $11700     6.7%
Total/Avg*   $19518    4.2%*    $22480     4.3%*
(* Average of five rates here, not the average rate paid for the total)

Taxpayers in the lowest two quintiles of earners would see dramatic decreases in their taxes: $200 to $500 (25-35%), which, for lower earners, is likely to be spent, boosting the economy. The middle quintile would also see a small tax break: someone earning $75,000 would get a $200 tax break (5% decrease). Upper earners would see their rates increase, but the change would not be more than $1000 until it was well in to six figures (a million dollar earner would see their tax rate increase from 5.1 to 9.4% and pay an extra $43,000, but I think they’ll still get by).

For the Commonwealth, it would mean new revenue. Based on just these numbers, there would be an increase of 15% from income taxes. But the math is much more complicated than that involving calculus I’m not about to do here since the long tail of high income earners would pay more while the decreases at the lower end of the scale are more minimal, so the revenue increase would likely be a bit higher. So, most Massachusetts residents would get a tax break, and the Commonwealth would have more money to improve services for everyone. And according to the survey, higher income residents would be willing to pay more. It’s a win-win-win, but it can’t be implemented without amending the constitution.

There are two ways to get this on the ballot. One involves a majority of state legislators and is probably a non-starter: Beacon Hill types are notably averse to doing, well, anything. The other way is for 3% of Massachusetts voters would need to sign an initiative petition, and then 25% of two consecutive legislatures would have to approve it. 25% of two consecutive legislatures might actually have a chance. Then it would go to the voters.

The last attempt to make this change in 1994 (a Republican wave year) failed by a wide margin, but an attempt to end the income tax all together in 2008 failed by a wider margin. The political hurdles would be large, but it is clear that the state needs more money to invest, and it is clear that higher earners are willing to pay more taxes. Convincing everyone to vote for this—even if it would be a tax cut for most—would be the hardest part.

And to the naysayers who crow that it will drive away jobs, look at Minnesota. There, the governor raised the top scale of the income tax and turned a deficit in to a budget surplus, which is being reinvested in schools and infrastructure and targeted tax breaks for the working poor. Too bad that it’s a well-educated, progressive state that happens to get a lot of snow: does that sound familiar?

Tallying snow and cold in Boston

I’ll update this scorecard for the next few weeks.
Follow @ofsevit on Twitter for the latest version

A few weeks ago, I wrote about how unprecedented the weather has been in Boston, and how it affects the transportation system. How unprecedented is this February? It is the confluence of two 500-year events: temperature and precipitation have both experienced anomalies at least 3 standard deviations from the mean. It is without parallel.

We covered snowfall in the last post, here we’ll focus more on the cold temperatures.
There has been one month, in the recorded climatological history of Boston, where the average temperature was below 20 degrees. 1934. It was unprecedented cold: the all-time record-low was set in Boston at -18 (a temperature which, with the observation station being moved to Logan Airport in 1936, will likely never be matched; the airport has only recorded three days below -10, the most recent in 1957). The average temperature in February 1934 was 17.5˚. The next highest months were Januarys in the late 1800s when the temperature averaged 20.1 (records date to 1872). Winter temperature records are very nicely normally distributed (69/96/99.7; other months are similarly distributed but there is much less nominal variability in the summer), and there has only once been a a month more than 3 standard deviations from the mean out of more than 400 winter months. 1934.

It is quite likely that eight decades later, 2015 will be the second. The dreaded polar vortex last year gave us departures from the mean of 2 to 3 degrees. (To be fair, we were on the edge of the vortex last year, and the Upper Midwest had similarly anomalous weather.) This year, we’re likely to run more than 10 degrees below normal. The average high for mid-February is 40˚. We haven’t seen that temperature in nearly a month, one of the longest stretches on record.

Thus far, temperatures in Boston have averaged 18.2 degrees, and if the forecast for the next week holds up, the average will actually fall below the 1934 record. With five days beyond then in the month, even if we revert to seasonal climatology normals (unlikely, given the current pattern and modeling), we’d set the second coldest month on record. If the weather stays cold, as is advertised, we’ll see the second winter month more than three standard deviations from the mean. And we might break the all time coldest monthly record. Which, given climate change (mean temperatures have risen 3-4 degrees since 1872), is particularly impressive.

Apparently it has snowed quite a bit as well. And, yes, the seven feet in three weeks has never happened before (and may well never happen again), and the past month has already outpaced any winter season in Chicago, New York or DC (and is one storm away from topping Minneapolis). But without the cold temperatures, it wouldn’t have had the same effect: some snow would have melted even with a few days over 40˚. In 1978, days in the 40s and 50s helped reduce the snowpack to 4″ before The Blizzard. In 2013, a week in the 40s reduced a major blizzard to a few inches of crust. This year, we haven’t seen 40˚ since MLK Day. The snow combined with the temperatures is really a double-whammy: two once-in-500-year events, at the same time.

From Sam Lillo @splillo

It’s something no one could have planned for, and something we’ll never see again. And I do need to update one of the charts in that first post: the 28 day snowfall. The current chart is here. But it may increase.

Update: According to Sam Lillo, who has some great posts like this one, Boston has had more snow in the past month that Buffalo ever has. Will try to confirm (confirmed).

Commuter Rail Ridership and Fares

A Twitterer recently found a 1972 plan for transit-level service along many of Boston’s rail corridors and was floored that ridership on what we now know as Commuter Rail at that time was only 16,000 per day (it was 80,000 in the ’40s and now hovers around 70,000). It has indeed grown, especially the South Side lines: in 1972, only 600 people rode the Worcester Line daily (the then-speedy Mass Pike having recently opened); many single Worcester Line trains now carry that many; the line has grown more than 15-fold over the past 40 years.

But the time of impressive growth is even more impressive: in 1981, ridership on Commuter Rail still hovered around 17,000. And then it began to grow. By 1990, it had more than doubled. And during the 1990s, it more than doubled again, so that by 2000 there were more than four times as many riders as there had been two decades before. Some of this is attributable to extensions after service cuts in the ‘70s, and new service on the Old Colony Lines. But a lot is due to the revitalization of downtown Boston following the growth of the 128 corridor, worsening traffic, and higher parking costs.

For 22 years, from 1981 to 2003, Commuter Rail traffic grew every year but one: 1991, after the collapse of the “Massachusetts Miracle.” But it took off again thereafter, peaking at 74,000 daily riders in 2003.

It hasn’t been that high since.

At first, flat ridership could be blamed on the early-2000s recession. But in the past 15 years, ridership has stagnated. If ridership growth had continued, linearly, at the 1981-2003 rate, it would be poised to cross the 100,000 threshold this year. Instead, the numbers of riders has barely budged, fluctuating up and down as the economy, traffic, and the price of gas has ebbed and flowed, none of them seeming to dramatically affect ridership.

Except for fares. Take a look at the chart. It certainly seems that, once fares started to rise dramatically, ridership flattened out. In the last fifteen years, commuter rail fares have gone up 250%, while they didn’t rise that much in the 20 previous years (despite higher inflation). Subway fares have risen as well, but the nominal amount the fares have risen is very different.

In the ’80s and ’90s, a ride on the T cost 60 or 85 cents (that’s a token, by the way) while Commuter Rail fares ranged from $1.75 to $3, rising to $2.25 to $4. The ratios were similar to today (the highest Commuter Rail fare about five times a subway fare), but the difference only $3. Now? The difference between a tap of a Charlie Card and a punch of a ticket is $8, which is a much greater difference.

There are two salient bits here. First, subway ridership, despite the same relative rise in fares, has seen dramatic increase in passenger counts in recent years, despite the increases in fares. At issue here is the fact that Commuter Rail and urban rail are different populations: Commuter Rail passengers have more options. Most own cars. If the cost of driving and parking is not much more than commuter rail—and parking and driving costs haven’t more than doubled in the past 10 years—they are more likely to abandon the rails and head for the highways. If the MBTA provided excellent rail service, with fast speeds and reliability, this would be less of an push factor. But with old equipment and slow track, it is.

The second piece is that outside of peak travel times, the train generally can’t compete with vehicles on travel time, and on weekends, on ease or cost of parking. And while many trains at rush hour are near capacity, there is plenty of capacity on off-peak and weekend trains. It’s possible that if the T offered off-peak savings—say, $2 off all fares beyond zone 1A, or half off, or something—they could drive enough additional ridership to cover the lost fare revenue, all the while taking cars off the road, which is good for everyone. As would having sensible, clockface midday schedules. And it might even help ridership trends.

It’s rather obvious that Commuter Rail ridership is more elastic than subway ridership: when fares go up, ridership might not go down, but previous trends level off. Since urban riders would cry foul if local fares rose faster than Commuter Rail fares (the subsidy per ride is higher for Commuter Rail riders, although the subsidy per mile is about even), increasing Commuter Rail ridership would require better service. Given the recent performance of the Commuter Rail, this may be a tall order. But it should be a goal.