Longfellow bus-bike illogic

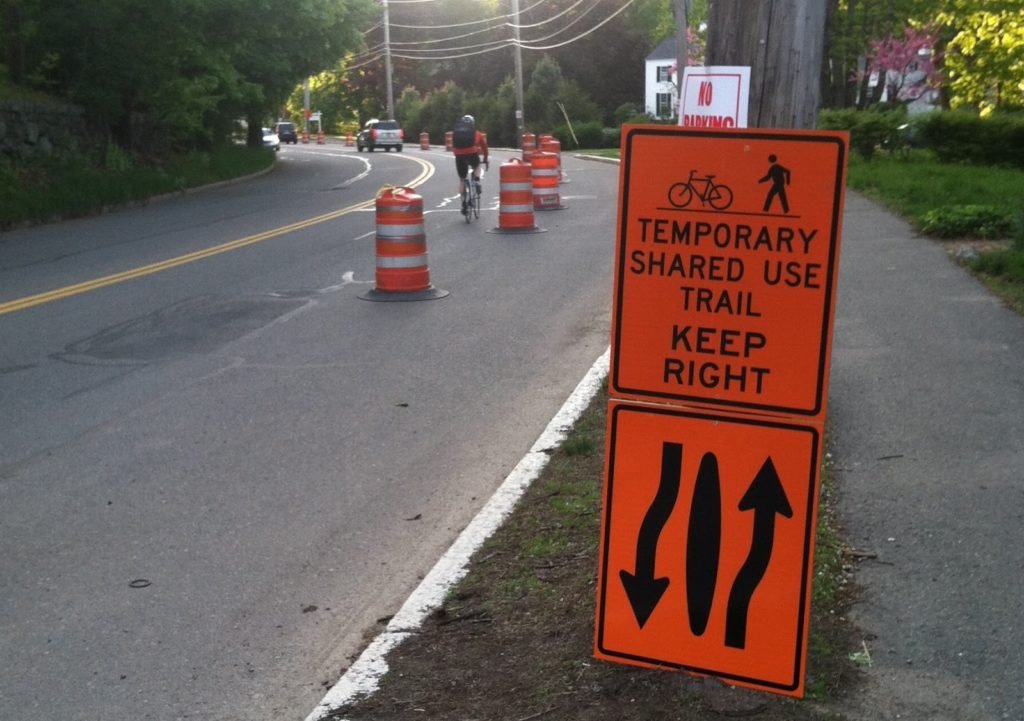
The Longfellow project is set to begin next week—signs have been flashing across the city advertising the multi-year lane closure—and at a meeting last week (documentation here), concerns were aired about traffic, gridlock, and banning bicycles from the roadway when the T is closed and buses traverse the bridge.

Wait, when the T is closed and transit riders are shunted on to a bus shuttle, were going to prohibit cyclists from crossing the bridge? When there are Hubway stations on either end? When buses will be packed with weekend travelers and trip lengths will be 10 or 20 minutes longer than usual? When taking a few people out of the system would reduce crowding and speed up trips for everyone else?

Yup.

MassDOT and the MBTA had been cagey about this, never outright saying that bikes were verboten until very recently, when their language was challenged (what does “emergency bike/bus lane” mean, anyway?) by cycling advocates.

In a recent email to stakeholders, MassHighway administrator Frank DePaola wrote:

There have been recently a few tragic incidents between Busses [sic] and bicyclists one common factor has been tight clearances and the bicyclist on the right hand side of the bus. During a red line bus diversion the frequency of busses [sic] between Kendall and Park Street will be quite high the probability of an incident on the tight quarters of the bridge, especially at the approaches is too high and safety is a big concern.

Let me attempt to rephrase:

There have been multiple crashes where buses have hit cyclists when passing them. If we get rid of the bikes, we won’t have to worry about these any more.

Never mind the fact that these bicycle-bus incidents have occurred with buses in normal operation, on roads with other vehicles, many distractions, and with buses pulling in and out of bus stops. The Longfellow, while narrow, won’t have any of this. There are no bus stops on the Longfellow. There will be no other cars on the Longfellow at this time. When a bus pulls out of a stop, the driver has to worry about cyclists passing on the right and cars going around on the left, while at the same time worrying about the rider running up and tapping on the door to try to get on the bus. None of this will take place on the Longfellow. Yet the default policy is to ban bikes.

While this is dismaying to the cycling community, it seems to be almost insulting to MBTA drivers. It almost says to them that the T and MassDOT don’t have faith in them to successfully pass cyclists—something they do thousands of times per day in heavy traffic—on an otherwise closed roadway. I’m sure that experienced MBTA bus drivers can drive across the Longfellow and pass cyclists at the same time.

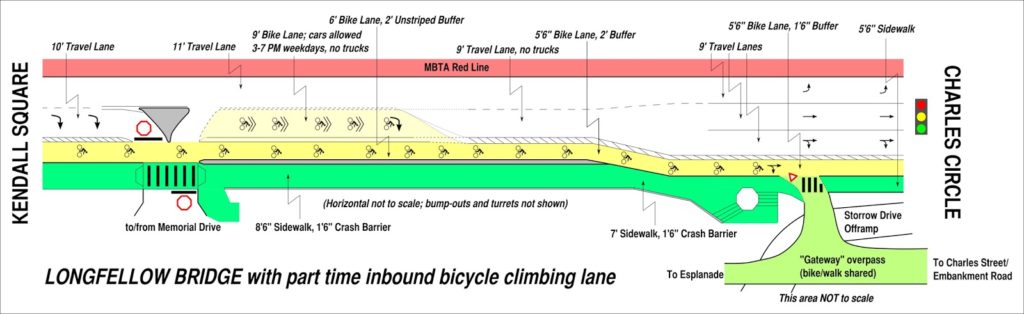
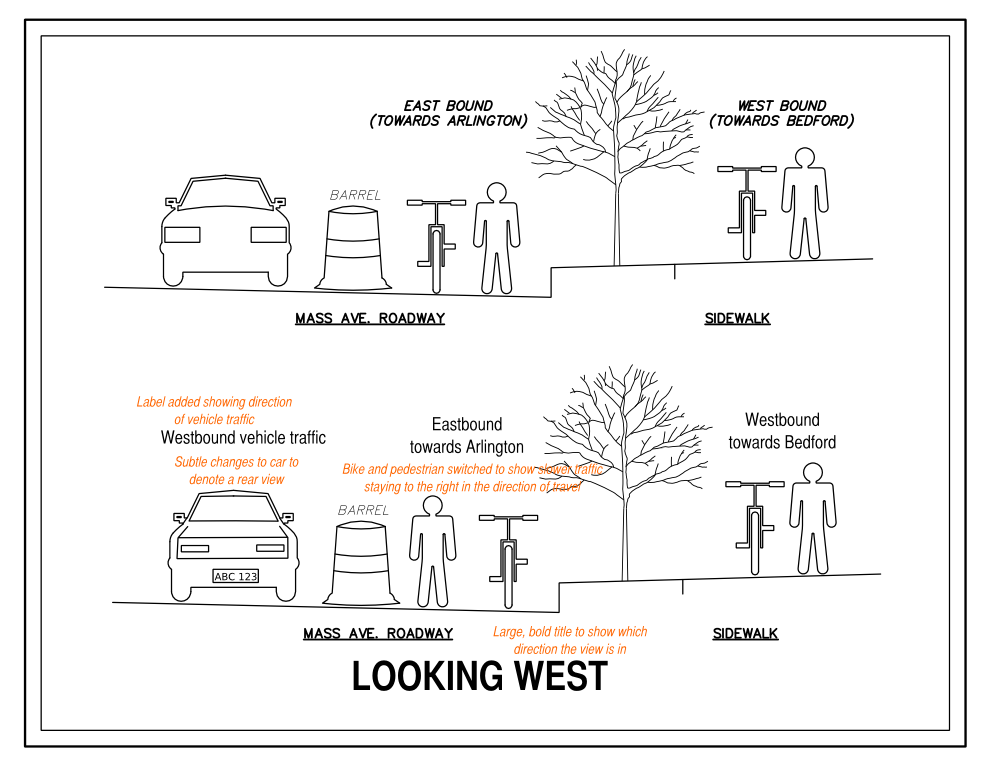
A salient issue is the pinch point at the Boston end of the bridge, where the width reduces from 29 feet to 22 feet for a 300 foot stretch. This is of concern, but could be remedied with a simple instruction to bus drivers: do not pass cyclists on this section of bridge. There is no need to erect signage to get this point across; MBTA supervisors could remind drivers of the policy before each shift crossing the bridge. (The narrowness of this portion of the bridge is another reminder that two-way vehicle traffic at any other time should be a total non-starter, especially since bicycle counts have actually increased since the new bridge configuration.)

Yes, this will result in some measurable delay for bus passengers. But these delays, I think, would be minimal. Let’s run some (estimated) numbers:

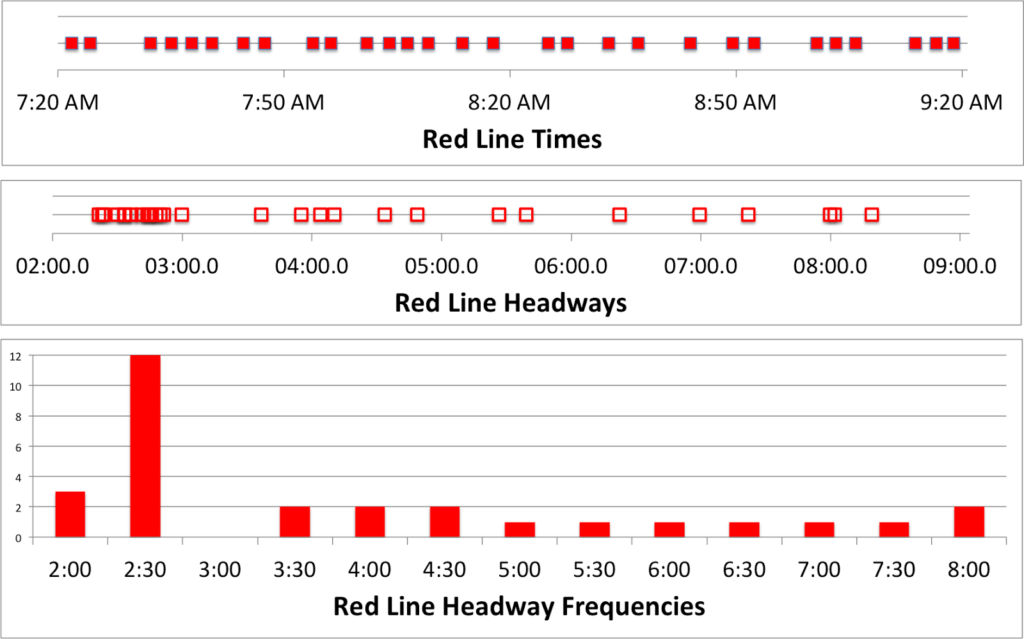
  • The MBTA will have up to 15 buses on the Red Line loop to serve passengers. Assuming the route takes 15 minutes (it will likely take slightly longer) this is an average of 1 bus per minute.
  • Each bus will carry 50 passengers (35-40 passengers plus standees).
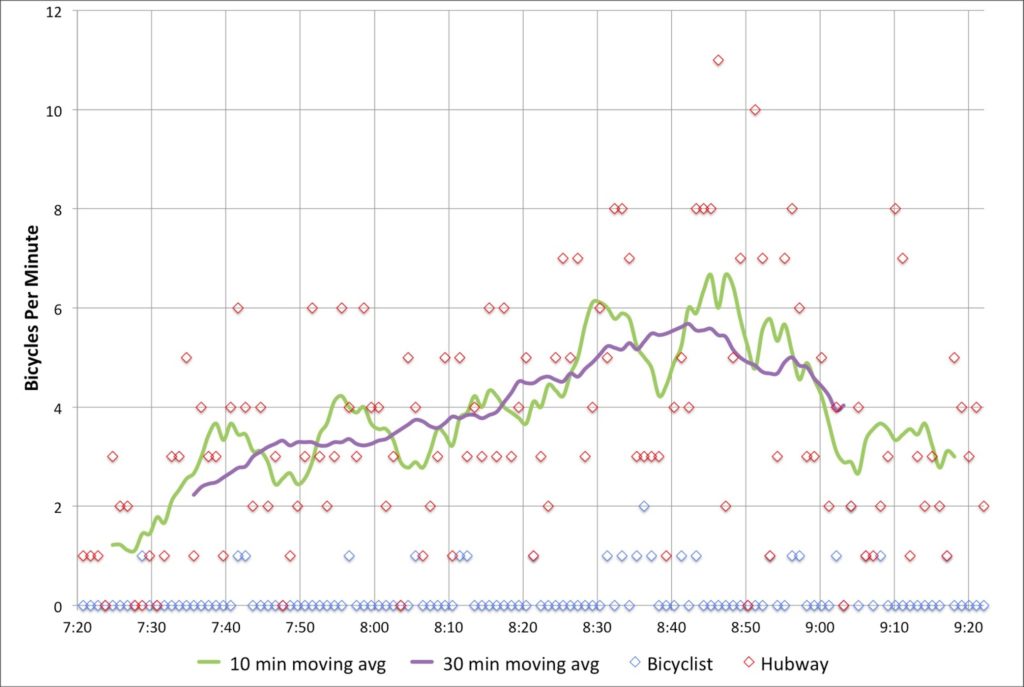
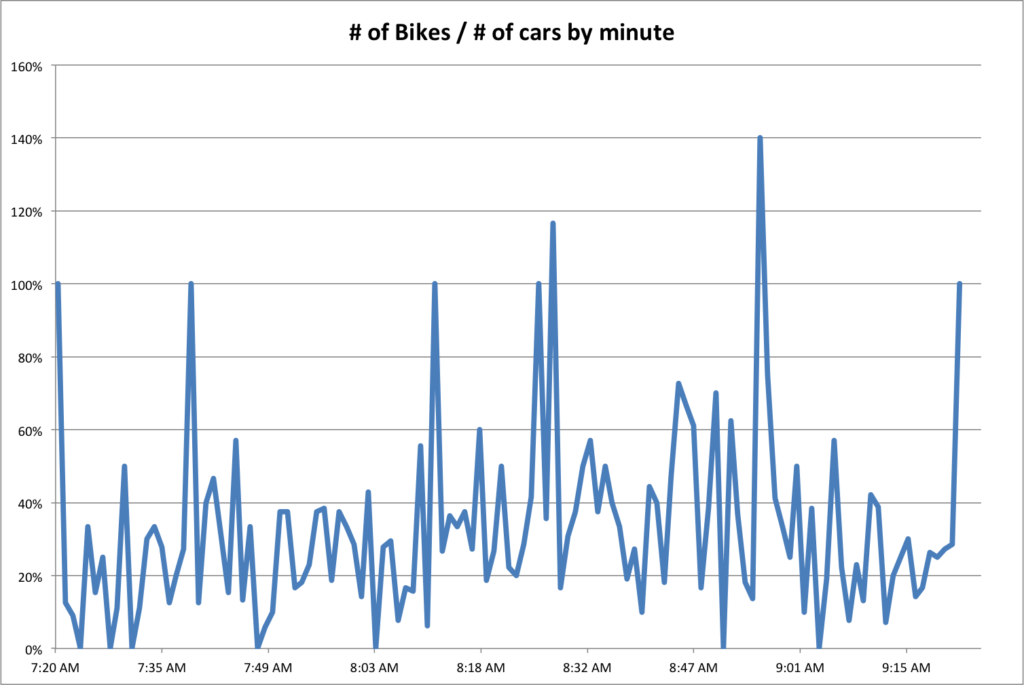
  • The 2011 bicycle/pedestrian counts found an average of 30 bikes per hour in each direction crossing the Longfellow midday on weekends. While numbers may have climbed since, some cyclists will choose other routes due to the construction, so this is a fine estimate.
  • Cyclists on this section will average 8 mph going towards Cambridge (uphill) and 16 mph towards Boston (downhill).
So let’s run some scenarios. A bus traveling at 20 mph will traverse the 300 foot narrow section in approximately 10 seconds. Thus, an inbound bus which would have to slow behind a cyclist going 16 mph would lose 3 seconds. An outbound bus would have more of a time penalty; following a cyclist for 300 feet through this pinch would take 25 seconds to cover 300 feet, a delay of 15 seconds. 
But how often would there be any conflict between a bus and a cyclists in this section of roadway anyway? It is not like there will be a constant line of buses or a constant stream of cyclists. Let’s assume a buffer for both buses and cyclists regarding any bus/bike road conflict of double the actual time needed to traverse the segment. For buses, it would mean that the would occupy these 300 feet of roadway 33% of the time (20 seconds every minute). For inbound cyclists, they would occupy the roadway 22% of the time (26 seconds every two minutes). Outbound cyclists would occupy the roadway 42% of the time (50 seconds every two minutes).
Let’s do some math. For inbound traffic, there would be a potential conflict 7.5% of the time. This would delay 4.5 buses per hour an average of 3 seconds each, for a total of 13.5 seconds per hour. Assuming 50 passengers per bus, this would be a total of 675 seconds of delay per hour. (Although this might be even less as buses would slow to cycling speed or lower to navigate the turns at Charles Circle.)
For outbound traffic, there would be a potential conflict 14% of the time. This would delay 8.4 buses per hour for an average of 15 seconds each, for a total delay of 118 seconds per hour. Again, if we assume 50 passengers per bus, this is a total of 5880 seconds of delay per hour. (This too might be less as buses accelerate up the bridge approach at a slower average speed.)
This is a total of 6555 seconds of delay for bus passengers per hour. However, this is actually a pretty small number. If there are 50 passengers per bus in each direction, and one bus crossing the bridge every minute, there will be 6000 passengers per hour. Thus, the total delay per bus passenger by allowing cyclists on the bridge (and having buses not pass them in the narrow section) will be just 1.1 seconds per passenger. Considering that the total delay due to Red Line closures will amount to 10 to 20 minutes, this will just 1/500th to 1/1000th of the total detour. In other words, any delay caused will be negligible.

We can also attempt to quantify the delays for cyclists who would be rerouted around the bridge. There are many fewer cyclists, but the potential detours result in a much longer delay. Requiring cyclists to use the Harvard or Craigie Bridge will add 2 to 4 minutes to a trip from Park Street to Kendall. With 60 cyclists per hour, this would equate to 180 minutes—or 10,800 seconds—per hour, far higher than the total delay for bus passengers.

In addition, there are two temporary signs which, I think, would be perfectly acceptable to the bicycling community and which will help mitigate potential conflicts further: First, on each side of the bridge, there should be a sign reading

BICYCLES KEEP SINGLE FILE

This will remind cyclists that there are buses passing on the bridge. The second sign, approaching the outbound side in Boston, would read:

BICYCLES YIELD TO BUSES

This would mean that if a bicyclist and a bus approached the choke point at the same time, the bus would go ahead, and the bicyclist would then be able to navigate the narrow section before the next bus enters the bridge. This would reduce potential conflicts, as well as reducing the need for buses to pass cyclists in this narrow section.

A better policy than hoisting “no bikes” signs would be to allow bikes, and evaluate any issues which arise. This is the policy they are taking towards Mass General, TD Bank and other institutions which are insisting than closing the road to traffic will result in so much gridlock the people won’t be able to get home from sporting events or concerts (seriously) or home from the hospital (a major reason the inbound direction was selected to be kept open was to allow emergency access to MGH). If we are going to make concessions to these groups, we should do the same for cyclists who will actually help to alleviate congestion during the closure times.

The wrong way and wrong time to do a bike count

At some point, I might get off my high horse regarding bicycle counts on the Longfellow Bridge. But for now, I’m staying on. Why? Because I did my bike count on a Wednesday morning in June, to get a “typical” commute count (although, to be fair, with colleges out for summer it may have been a bit less traffic than some of the year). And I think I’m collecting better data than the established counts. Going through this process, I’ve found out more information about the National Bicycle and Pedestrian Documentation project, which is used as a basis for counting by local transportation agencies across the country, including the CTPS locally.


And I have not been particularly pleased with what I’ve found.


I think I originally buried the lede here, so I’ll add a bit here that I reiterate in the final paragraph: the bicycle and pedestrian count methodology treats bicyclists and pedestrians more as leisure users rather than treating them as using viable modes of transportation. We don’t take typical auto counts during vacation periods, and we shouldn’t do this for bicyclists, either. We should count bicyclists and pedestrians during normal use times, and design facilities based on this usage, especially in urban areas where bicycling and walking are important not only as transportation modes but as congestion mitigation resources

So what’s wrong with the national bike counting standards? First of all, the survey methods seem to come from about 15 years ago. From the directions:

Each counter should bring counting sheets, two writing utensils, a watch or cell phone for keeping time, and a clipboard or other device to write on. Counts are conducted in 15-minute intervals, and comprise the total volume of pedestrians and bicyclists traveling in both directions passing a given point. 

Here we are, in 2013, when everyone has an iPad and an iPhone and a laptop, and we’re taking counts with paper and pencil, and then admonishing people to make sure they don’t lose the paper because it is irreplaceable until it has been entered in to the database. Great. When I went to do my count, I didn’t even consider using paper and pencil, because it just didn’t make sense. I thought about writing a python script, but settled on Excel because it was easier to write and easier to test. But for a national program, how hard would it be to have an iPad app? Nothing fancy, just something where you tap a button every time you see a pedestrian or cyclist (it would be easy to have these buttons be customizable) and then directly upload the time-stamped data. 


Is there an up-front cost? Yes. Although my only overhead was the power to charge my computer’s battery and about 30 minutes on Google to figure out how to set up the Excel spreadsheet.


Second, why on earth would you survey typical use on July 4 weekend? I can not get over this. Their explanation is that it is selected because “The 4th of July period … will afford both a typical summer weekday and what is typically the busiest holiday period and activity period for recreational facilities and activities.” Three points. First, July 4 is not a typical holiday. You are likely to wind up counting a lot of people walking or bicycling to parades and fireworks. Are there a lot of parades on Columbus Day? So with one of the four annual counts, you’re collecting data which is unusable every other day of the year. Second, and excuse the italics, but in what universe is July 5, the Friday after July 4, is going to be a typical weekday? Half of my office is taking it off. Half of the country has vacation bounce messages on their emails this week. Third, while it is a busy time, so many people are traveling that it is not representative of many other weekends. I would contend that you’d get much more useful data by surveying a typical weekend in July rather than focusing on July 4. We’re spending all of this time and money to sample bicycle use, and we’re collecting just bad data.


Third, while uniformity is sometimes good, bicycle and pedestrian use is highly localized, so what works in one city may not work in another. In other words, there’s not a very good argument for standardizing bicycle count dates across the country other than to increase awareness. Awareness is a good thing. But it shouldn’t trump good data.


Harrumph.


You’d think that the NBPDP would at least be consistent in their data collection documentation, but this is not the case at all. This current survey is planned for a Thursday, Friday and Saturday. Their instructions document (available here) states that “Weekday counts should always be done Tuesday through Thursday, and never on a holiday.” Now, I understand that this is in relation to the national count in September, but, uh, guys? July 4-6 is a Holiday, Friday and Saturday. You’re 1-for-3. That might work in baseball, but it’s not a passing grade elsewhere.


Finally, in Boston this is an especially fraught issue. Why? Because on July 4, many of the city’s highest-use bicycle facilities are being closed. The Esplanade will be closed to bicyclists all day. The Longfellow and Harvard bridges are closing at 4 p.m. So any bicyclists after that point wishing to travel from Cambridge to Boston will have to either cycle across the Charles River Dam, or go up to the BU Bridge. Does it make any sense to take bicycle counts on this day? 


I’m not saying that my methodology was perfect, but it’s hard to comprehend how the current counts make much sense. If we go around collecting shoddy data and wind up undercounting bicyclists, we have only ourselves to blame when we get underdesigned facilities. It seems like high time to assess both the overall efficacy of the NBPDP, and especially whether Boston should participate in the program.


And a larger, and perhaps more important point: by prioritizing non-commuting periods, we are treating bicyclists as recreational users, not as a viable mode of transportation. Would we count cars during July 4 week? Of course not. AASHTO even says that such periods are “atypical” and would not have valid data. By counting traffic at these times, we are doing a severe disservice to bicycle advocacy.

Longfellow Bike Count

One of the issues I’ve touched on in the Longfellow Bridge series is the fact that there as no bicycle count done at peak use times—inbound in the morning. The state’s report from 2011 (PDF) counted bicyclists in the evening, and shows only about 100 cyclists crossing the bridge in two hours. Anecdotally, I know it’s way more than that. At peak times, when 10 to 20 cyclists jam up the bike lane at each light cycle, it means that 250 to 500 or more cyclists are crossing the bridge each hour. So these numbers, and bridge plans based on them, make me angry.

But instead of getting mad, I got even. I did my own guerrilla traffic count. On Wednesday morning, when it was about 60 degrees and sunny, I went out with a computer, six hours of battery life and an Excel spreadsheet and started entering data. For every vehicle or person—bike, train, pedestrian and car—I typed a key, created a timestamp, and got 2250 data points from 7:20 to 9:20 a.m. Why 7:20 to 9:20? Because I got there at 7:20 and wanted two hours of data. Pay me to do this and you’ll get less arbitrary times.

But I think it’s good data! First of all, the bikes. In two hours of counting, I counted 463 bicyclists crossing the Longfellow Bridge. That’s right, counting just inbound bicyclists, I saw more cyclists cross the Longfellow in one direction than any MassDOT survey saw in both directions. The peak single hour for cyclists was from 8:12 to 9:12, during which time 267 cyclists crossed the bridge—an average of one every 13.4 seconds. So, yes, cyclists have been undercounted in official counts.

Are we Market Street in San Francisco? Not yet. Of course, Market Street—also with transit in the center—is closed to cars. [Edit: Market Street is partially closed to private vehicles, with plans being discussed for further closures.] And at the bottom of a hill, it’s a catchment zone for pretty much everyone coming out of the heights. They measured 1000 bikes in an hour (with a digital sensor, wow!), but that was on Bike to Work Day; recent data show somewhat fewer cyclists (but still a lot).

I also counted vehicles (1555 over two hours; 700 to 800 per hour, including three State Troopers and one VW with ribbons attached that passed by twice), inbound pedestrians (about 100, evenly split between joggers and walkers, although there were more joggers early on; I guess people had to get home, shower and go to work) and even inbound Red Line trains (30, with an average headway of 4:10 and a standard deviation of 1:50). I didn’t count outbound pedestrians, or the exact number of people I saw stopping to take pictures (at least three on my little nook of the bridge).

But did you come here for boring paragraphs? No, you came for charts! Yay charts! (Also, yay blogging at 11:20 p.m. when I should be fast asleep. Click to enlarge.)

First, bikes. Cyclists crossing the bridge started out somewhat slow—the moving average for the first 20 minutes was only one or two per minute. But the number of cyclists peaks around 8:40—people going in to the city for a 9:00 start—before tapering off after 9. I’ve written before about seeing up to 18 people in line at Charles Circle which is backed up by these data; the highest single minute saw 11 cyclists, and there were four consecutive minutes during which 36 bikes passed. At nearly 6 bikes per minute for the highest half hour, it equates to nearly 360 bikes per hour—or 10 per 100 second light cycle. Too bad we’re all squeezed in to that one little lane. (Oh, here’s a proposal to fix that.) If anything, these numbers might be low—the roads were still damp from the overnight rain early this morning.

What was interesting is how few Hubway bikes made it across the bridge—only 25, or about 6% of the total. With stations in Cambridge and Somerville, it seems like there is a large untapped market for Hubway commuters to come across the bridge. There are certainly enough bikes in Kendall for a small army to take in to town.

Next, cars. The official Longfellow traffic counts show about 700 cars per hour, which is right about what my data show. What’s interesting is that there are two peaks. One is right around 8:00, and a second is between 8:30 and 9:00. I wonder if this would smooth out over time, or if there is a pronounced difference in the vehicular use of the bridge during these times. In any case, 700 vehicles per minute is not enough that it would fill two lanes even to the top of the bridge, so the second lane—at this time of day, anyway—is not necessary on the Cambridge side.

I also tracked foot traffic. I did my best to discern joggers and runners from commuters. Joggers started out strong early, but dwindled in number, while commuters—in ties and with backpacks and briefcases—came by about once every minute. I was only counting inbound pedestrians, and there were assuredly more going out to Kendall. Additionally, I was on the subpar, very-narrow sidewalked side; the downstream sidewalk is twice the width (although both will be widened as part of the bridge reconstruction).

And I counted when the trains came by. In the time that 2500 bikes, pedestrians and cars crossed the bridge, 30 trains also did. Of course, these were each carrying 500 to 1200 people, so they probably accounted for 25,000 people across the bridge, ten times what the rest of the bridge carried. Efficiency! The train times are interesting. The average headway is 4:10, with a standard deviation of 1:58. However, about half of the headways are clustered between 2 and 3 minutes. That’s good! The problem is that the rest are spread out, anywhere from 3:30 to 8:30! Sixteen trains came between 7:20 and 8:20, but only 14 during the busier 8:20 to 9:20 timeframe. I wonder if this is due to crowding, or just due to poor dispatch—or a combination of both.

In any case, what Red Line commuter hasn’t inexplicably sat on a stationary train climbing the Longfellow out of Kendall? Well, after watching for two hours, I have an answer for why this happens!  It is—uh—I was lying. I have no idea. But I say no fewer than a half dozen trains sit at that signal—and not only when there was a train just ahead—for a few seconds or even a couple infuriating minutes. I was glad I wasn’t aboard.

Finally, we can compare the number of bikes as a percentage of the number of cars crossing the bridge each minute. Overall, there were 30% as many bikes as cars. But seven minutes out of the two hours, there were more bikes across the bridge than vehicles. Cars—due to the traffic lights—tend to come in waves, so there’s more volatility. Although bikes travel in packs, too. Anyway, this doesn’t tell us much, it’s just a bunch of lines. But it’s fun.

Is a part-time bike lane appropriate for the Longfellow?

So far in our irregular series on the Longfellow Bridge we’ve looked at the difficulty accessing the bridge from the south, the usage of the bridge compared to the real estate for each use and how many bikes are actually using the bridge at morning rush. While my next step is to actually go out and count bikes (maybe this Thursday!), I’ve been thinking about what sort of better inbound bicycle infrastructure could be implemented for the bridge.

Here’s a graphic. I’ll make more sense of it below (Click to enlarge):

Here are the issues at hand:

  • Peak bicycling occurs between 7:30 and 9:00 a.m., when bicyclists traveling from Cambridge, Somerville, Arlington and beyond converge on the Longfellow to commute to work in downtown Boston. For nearly any destination in Back Bay and Downtown, it is by far the easiest access.
  • There is much less cycling outbound at rush hour because of mazes of one-way streets combined with heavy vehicular traffic on the other access roads (i.e. Cambridge Street).
  • Thus, the highest bicycle use at any time on the bridge is during the morning rush hour inbound, but while plans indicate a wide, buffered bike lane going outbound, the inbound lane will barely be widened.
  • Since the bridge has a noticeable incline from the Cambridge side, there is a wide spread of cyclist speeds, and it is reasonable to expect cyclists to want to overtake during heavier use times.
  • With improvements to Beacon Street in Somerville as well as the access through Kendall Square, even more cyclists will crowd the bridge in the morning.
  • With the expansion of Kendall Square and its reliance—to a degree—on bus shuttles, it can not be allowed to gridlock over the bridge during peak periods (generally evening rush hour).
In other words, bikes need more room in the morning. And cars need more room in the evening (a single lane on the Longfellow would only accommodate somewhere along the lines of 50 vehicles, and might quickly queue in to Kendall). Luckily, these needs are not necessarily mutually exclusive, and a part-time bike lane would be a possible solution to give bikes the room they need at peak times, while not piling traffic in to Kendall at other times.
In general, part-time bike lanes have been created when parking is allowed at some times and not others (here’s an example from the Embarcadero in San Francisco). The Longfellow is unique in that it has dramatically different usage rates between motor vehicles and bicycles (there are probably twice as many bikes in the morning than the evening, and twice as many cars in the evening than the morning). Bridge real estate is obviously limited—in a perfect world there would be two lanes for traffic and a wide, buffered bike lane, and a pedestrian promenade. So it would be a engineering, logistical and educational challenge to implement such a program.
Here’s the thing: the bridge will be effectively shut down for three years. Traffic will be shifted around for long enough that drivers won’t well remember the previous infrastructure, so it would be a good time (perhaps the only time) to try something drastically new. Here’s a sketch of an idea:

Between Kendall Square and Memorial Drive, Main Street will merge from two lanes to one, to the left. The right lane will be for turns on to Memorial Drive only, and will be set off from straight-ahead traffic with bollards or a median.

Past the Memorial drive ramps:

The left inbound lane is kept at 11 feet and all non-Memorial traffic merges in to it before the bridge. The constriction for the Longfellow traffic is throughput at Charles Circle, so this shouldn’t dramatically affect traffic, especially since Memorial Drive traffic would exit in a dedicated lane. This will allow traffic to comfortably travel in it at all times. The lane would be signed as Vehicle Traffic, All Times. It would be separated from the right lane by an unusual marking such as a double broken white line. 

The right inbound lane should be narrowed to 9 feet in width. Height restrictions (chains hanging from an overhead support) could be hung at intervals to discourage trucks and buses but signage would likely suffice. It would be signed as Bikes Only Except Weekdays 3 PM to 7 PM. No Trucks or Buses. It would be marked with diamonds or some other similar feature as well as “Sharrows” and separated from the bike lane by two solid white lines with no painted buffer in between, potentially with infrequent breaks.  

The bike lane would be 6 feet wide and the two lines would serve as a 2 foot buffer at evening peak. It would be signed as a regular bike lane.

This will extend to the top of the bridge where the grade evens. Beyond that point, there is less need for a “climbing lane” for cyclists, and the bike lane will taper to one, buffered lane. The left lane stay 11 feet, and the right lane 9, but it will be open to cars at all times, with a continued buffered bike lane. Having the right lane closed to trucks and buses will dramatically increase the comfort level for bicyclists who are often squeezed by large vehicles, who will have no business in the right lane.

At the Cambridge End of the bridge, the merge to one lane before the Memorial Drive will funnel all Cambridge-origin traffic in to the left lane (this is the only origin for trucks and buses which can not fit under the Memorial Drive bridges). During non-peak afternoon hours, the Memorial Drive intersection would then join this traffic in a short merge lane after crossing the bicycle facility. At peak hours, it would continue in the right lane. This means that for a truck or bus to use the right lane, it would have to actively change lanes, meaning that even during rush hour, bicyclists would not be pinched by frequent tall tour buses and delivery vehicles. And at other times, most of the origin traffic from Cambridge would already be in the left lane, and only the Memorial Drive traffic—which already stops at a stop sign—would have to be signed in to the lane based on the time of day. The irregular lane markings will clue most drivers in to the fact that there is something different about the bridge, as will signage placed on the bridge approaches.

At the Boston end of the bridge, just before “salt/pepper shaker” the bridge could be widened (for instance, see this older image) to allow bicyclists to stay in a buffered bike lane and cars to sort in to three full (if narrow) lanes. However, two lanes might be preferable to allow trucks and buses to get from the left lane on to Charles Street (or such vehicles could be forbidden from this maneuver and forced straight on to Cambridge or left on to Embankment Road). In this case, enough room for side-by-side cycling in a bike lane—at least 7 or 8 feet—should be allowed (this is not showin the above schematic).

The potential for a flyover bike ramp to the unused portion of Embankment Road should not be discounted, either, as it would siphon much of the bicycle traffic away from the congested Charles Circle area. I called this the “Gateway Overpass” as a lower, gentler and wider bridge could span from the Embankment Road area across Storrow Drive to the Esplanade and allow easy egress to Charles Street across the Storrow offramp. The current bridge is narrow, steep and congested, and provides far more clearance over Storrow Drive than necessary. A new bridge is proposed (see page 10 of this PDF) but I think a level bicycle facility would be very helpful to help bikes avoid the congestion at Charles Circle.

If this project were found to be either dangerous for cyclists or a major impediment to traffic in Cambridge, it could be changed simply by restriping existing lanes, so there would be no major cost involved. If it constricted traffic enough, the lanes could be restriped with a buffer to allow a wider cycling facility inbound at all times.

I think it’s worth study, if not a try.

6000 Bikes Per Hour

A few weeks ago, a sea of cyclists pedaled (slowly) through Cambridge. The city has two annual recreational rides, complete with police escorts, where hundreds of bicyclists take to the streets. I took a video of the procession through Inman Square and it got lost in my phone for a while, but recently resurfaced and made it to Youtube.

It’s not that much to watch, unless you really like watching chatty cyclists at low speed, but it is illustrative how space-efficient cyclists are. The video lasts a bit shy of three minutes, and for about 2:30 of that (give or take) the swarm of cyclists passes by. I happen to know that there were about 250 (actually 258, according to the website). But let’s use round numbers—even at low speed there were 100 cyclists passing by per minute.

Which is extremely efficient.

On a freeway, a lane of traffic can only carry at most 2000 vehicles per hour—beyond that the roadway devolves quickly in to gridlock (and the number of vehicles drops). Yet one lane of bicyclists can accommodate three times as many people—you’d have to have three or four people in every car on a freeway to have the same level of service. Want to fill buses? Fine, but you better be able to get a full bus through every 30 seconds to match a lane of cyclists. Rail can surpass this capacity—at rush hour the Red Line in Cambridge peaks over 10,000 people per hour, and some lines in New York go past 20,000—but you need a bit more infrastructure to run such rail routes.

Since bicycles take up far less space than vehicles, they use road space much more efficiently than vehicles. Even if a rate of 6000 per hour necessitates a police escort, it’s still a testament to the efficiency of the bicycle.

Hubway Expansion Station Locations Not Always Optimally Located

Boston Bikes and Hubway are in the midst of a public input process for adding shared bicycle stations to several neighborhoods in Boston. Not only are these additions welcome for the general public, but the city has decided to use a local start-up, CoUrbanize, to solicit input. CoUrbanize has a map- and tag-based comment database, and seems like a good, simple platform in the often-confusing public comment sphere. So all systems are in place to get some good comments, and get the stations on the street, right?

Not really, because instead of putting the stations in thoughtful locations where they will do the most good, they are scattered across the study area and located in places where they make no sense (while leaving out obvious locations like major commercial corridors and transit stations). So instead of having a good discussion about the merits and detractions of various locations, the public is now discussing how some of these locations make no sense at all as bike sharing locations (at least in the current iteration of bike share), and why other, disparate locations, would work much better. This seems less productive than would be desirable.

An issue seems to be that the station maps were created to cover as much of the map as possible without much thought to whether the locations were best of bike sharing. This seems like a political play to keep constituents happy, but seems to assume that constituents will be content if their neighborhood is covered by a circle on a map, but not care whether or not there is a useful network of shared bicycles. The Jamaica Plan expansion—the largest of the three proposed—is a good example of how this plays out. Most of the study area is in or near a circle buffered around a location. However, the way in which the stations were placed means that there are no bikes at any Orange Line station, and that the southern portion of the Centre Street business district is underserved as well. For anyone with more than a passing interest in Hubway—and most public commenters likely fall in to this camp—the illogic of some of these station placement is obvious.

There are three neighborhoods being studied right now: Jamaica Plain/Roxbury, South Boston and Charlestown. All of them seem amenable to bike sharing. Yet several of the locations chosen in each bear little resemblance to successful bike sharing locations. Let’s review several important factors in siting a bike share kiosk, which I’ll define as

The Five -tions of Bike Sharing

  • Population density (there needs to be someone to use it)
  • Destination (it needs to be somewhere people want to go)
  • Elevation (bike share locations on hilltops require frequent rebalancing as people take advantage of gravity in one direction only)
  • Connection (they need to be part of a dense network)
  • Transportation (bike share needs to complement existing transportation infrastructure)
While these are certainly not the only factors necessary for a successful bike sharing system, they are quite important. The proposed locations, in many cases, fail one or more of these tests. In addition, logical, and in some cases obvious, locations were overlooked. It certainly seems that they were chosen not to become part of the existing network, but instead to cover the map. This may be an unfortunate part of the planning process, but in this case it seems to just gum up the works.
Here is some short commentary on the locations:
Jamaica Plain / Roxbury is a fertile location to grow Hubway. There is significant existing bicycle infrastructure, good transit and density, and a burgeoning bicycle culture. A logical system would follow existing transit corridors—Centre Street, the Southwest Corridor (transit and bike path) and Washington Street—in JP, and similar corridors in Roxbury. (I will admit that I know less about the transportation infrastructure in Roxbury than in JP.) Instead, locations are put in some rather inconceivable locations:
  • JP-1 fails due to its location atop Mission Hill. Which is steep! It has population and destination, but would likely require frequent balancing as riders took bikes down the hill but walked up. This would be better moved to the VA Hospital on South Huntington or to Jackson Square, which inexplicably falls outside any of the circles, despite being a major transit hub with significant new development taking place.
  • JP-2 is a logical location, at a business node on a dense transit corridor.
  • JP-3 makes no sense and fails on all five of the -tions above. It is in a relatively sparsely-populated part of JP, away from any transportation infrastructure and high up on a hill. In addition, the only way to access the rest of the proposed and existing network is by navigating the bicycle-unfriendly Pond Street-Arborway corridor. This location will certainly not come to be any time soon, and it’s disingenuous to propose it.
  • JP-4 lies on the Southwest Corridor but is, for whatever reason, halfway in between the Green Street and Forest Hills Orange Line stations. Perhaps it would be a good location in the future, but the first priority should be locating bikes at the stations themselves. Furthermore, there are no locations anywhere near Centre Street through the heart of Jamaica Plain, and this location is about as far from Centre Street as any location along the Southwest Corridor.
  • JP-5 is at Upham’s Corner in Roxbury and is a decent location for a station, although it is somewhat far from other locations.
  • JP-6 is a good location in Egleston Square, but again suffers from the fact that there are no nearby stations, especially along the Orange Line. Egleston was once an elevated station, and Hubway could be a good resource for getting to and from the current Orange Line stations, but if the Orange Line is eschewed, it loses some usefulness.
  • JP-7 is similar to the location above, although at least closer to the current Hubway station at Roxbury Crossing.
South Boston is another good location for bike sharing. It is quite dense and located in close proximity to the Downtown area, but lacks rapid transit except on the western fringe. One issue is that it is surrounded by three sides by water, so connectivity to the rest of the system is a bit of an issue. And while the three stations proposed do not provide coverage for the whole of the neighborhood, they do not fall as far short as some of the locations in Jamaica Plain. It helps that there are existing Hubway stations at Red and Silver Line rapid transit stations on the north and west sides of South Boston, so these stations can act as feeders to there, and to downtown Boston as well. I don’t know Southie that well, but this chart (from Southie Bikes) is a great representation of why Hubway should do quite well there.
Charlestown‘s main issue is that the proposed stations do not complement the existing stations in Charlestown that well—let alone the rest of the system. (NB: there is a new station at the new Spaulding Hospital not shown on this map.) C-2 is a logical spot at the Charlestown Community Center. But C-1 is located between two existing stations. And there are no proposed locations at either the Community College or Sullivan Square Orange Line stations, or logical connections to the Hubway locations in Cambridge or Somerville. While C-3 is labeled as “Sullivan Square,” it is quite a distance from the actual Sullivan Square MBTA station. As the roads in Sullivan are redesigned and as the area is (hopefully) developed in to something more than an array of highways and parking lots, the station may be differently located. But for now, it should be located at the MBTA station, where it can provide connectivity not only to the new and existing Charlestown stations, but to Somerville as well.
It is good to see the City partnering with CoUrbanize to invite public comment for these location, and the comments—some of them my own—have certainly hit on where these stations should go. Hopefully the Hubway expansion steers clear of some of these less-than-desirable spots. Luckily, the stations are portable and easily moved, so, unlike most infrastructure, the system can be rejiggered if it is not optimally sited at first. But it would be even better to have picked better locations from the outset.

Poor signage harms viability of the temporary cycletrack in Lexington

Two cyclists correctly using the temporary “cycletrack” along
Massachusetts Avenue in Lexington.

Biking through Lexington a few weeks ago, I noticed that the Minuteman Bikeway was set to close for most of May for construction work related to a collapsed culvert. And at an opportune time: the first day of construction would coincide with Bay State Bike Week‘s start, and it would last through the rest of the month, Memorial Day included. The Minuteman is certainly a recreational asset, but is also heavily used for commuting; the site of the construction is only five miles from the Alewife MBTA station, where many cyclists transfer to the Red Line or other bicycle facilities.

The only logical detour? Massachusetts Avenue, a.k.a. Routes 4, 225 and 2A. In other words, it’s not a quiet country lane. While some cyclists are comfortable riding the road (and it can be faster cycling than the bike path), many are not. Ideally, there would be a detour around the construction work. But with a narrow right-of-way and heavy construction equipment, this is not possible. So the town of Lexington, to its credit, did something remarkable: they banned parking along Mass Ave and “barreled off” a lane of traffic to create a contraflow cycletrack for a half mile around the closure. As far as I know, it is the first such facility in the state.
And if you want to see it, you better act fast: it will be gone in two weeks.
As well-intentioned as this temporary infrastructure is, the communication to the public could be better: signage both at the site and even online is confusing to cyclists who will already be thrown out of their comfort zone. The crux of the issue is that when you are implementing a new and different infrastructure plan, you need to be clear to the users what they should do. Unfortunately, both signage at the start and end of the lane and at the project’s website (description and sketch; both pdf) is ambiguous, and thus users were unclear as to how to traverse this section of roadways. It seems that highway engineers created a good plan, but the signage was not properly thought through and vetted. 
According to the detour notice (pdf), the following detours occur:
  • Westbound bicycle traffic will take a left on to the Seasons Four driveway, and a right on to the Mass Ave sidewalk, following the sidewalk to Woburn Street and taking a left to get to the trail crossing and proceed up the trail.
  • Eastbound bicycle traffic will take a right on to Woburn Street. It will then turn left across Woburn Street and proceed on the far-left (north) side of Massachusetts Avenue between a row of barrels and the curb—this is the (temporary) protected, contraflow cycletrack. At the end of this facility, they will take a left on to the Seasons Four driveway, and proceed as normal along the path. 
  • Any cyclists who wished to use the roadway along Mass Ave should use the traffic lanes as usual but should note that lane width will be constricted by the construction.
In other words, a cross-section of Mass Ave looking westbound would look something like this:

Simple right? Well, not really. Here are the problems with the communication:
  • The project notice is buried on a town website. It’s easy enough to find with a Google search but not well publicized. Once you find it, however, it is a poorly-formatted word-doc-turned-PDF. I don’t want to toot my own horn (or, pardon me, ring my own bell), but the bulleted section I wrote above is much more informative than trying to parse the information from this document.
  • The sketch which accompanies this notice (but is not linked from it) is clean and simple, but unfortunately leaves out important information to show users how to use the facility. It shows what appears to be the front of a car in the westbound travel lanes, when in fact this should be the rear of a vehicle. This is a fine engineering mock-up, but this is a case where more detail is necessary. It also is too simplified to show the direction of travel, and would be well-supplemented by an overhead sketch as well. It even lacks a proper title, such as “Mass Ave looking westbound” for user orientation. You certainly don’t want information overload, but in this case, important information is left out.
  • The signage onsite is abundant, but lacks important information. In a case such as this one, it is not enough to use uniform highway signage: you are dealing with a different user group, and with a situation which is unique. And even then, the signage is ambiguous. Imagine showing up as a cyclist and trying to make heads or tails of the picture below. Kind of difficult.
  • The written sign shows a picture of a bicycle and pedestrian (fine) and then the text “Temporary shared use trail. Keep right.” Keep right of what? Is this referring to the sidewalk or to the “cycletrack” lane? Does it mean “keep to the right of the sidewalk” or “keep to the right of the cycletrack” or “of the sidewalk and cycletrack, use whichever is furthest right”? 
  • Good idea, poor signage. This sign makes very little sense.
    Do they mean keep to the right of the on-street lane, or
    keep to the right of the sidewalk? Who knows!
  • Below this sign is a which shows two directional arrows (which bend for no particular reason) around a center island. This is also very ambiguous. Does the island refer to the area between the sidewalk and the “barreled off lane”? Or does it refer to the barrels? Is it telling westbound cyclists to use the “cycletrack” and eastbound cyclists to use the roadway (presumably with traffic on the other side)? Coupled with the signage above, it is no closer to making any sense.
What it needs is more of a cross-section, with words and pictures (see above). Yes, it might be a larger sign, but it would also make it much clearer who was to use the trail, and where. Many trail users take the path daily, so a clear sign on the first day would allow them to properly use the facility during the entirety of the construction. This was, unfortunately, not the case.

As for the sketch, a few minor tweaks could make it more usable. Here is the original sketch, and below my retouched sketch with some annotation regarding changes. It’s still not perfect, since it doesn’t show the whole road, but it at least leaves less room for confusion and interpretation.

Site/app idea: Citizen Summons

I just almost got killed by taxicab. Again.

This is an exaggeration (I was able to brake in plenty of time after the cab cut in front of me, and then called me and the female coworker I was biking with faggots, because yeah that makes sense), but not much of one. I’ve found that taxicabs in Boston are frequently the ones hurling invective at cyclists, blocking bike lanes, dooring cyclists (oh, no, wait, the City found that), failing to yield to pedestrians, driving with their lights off at night, and generally driving in ways that endanger the public, and especially vulnerable road users.

And while every car has a license plate, cabs are particularly well-adorned with identifying markings: they have the medallion number on the front and rear, and frequently on top of the cab, and their license plate also frequently matches the medallion. In addition, taxicabs have (or at least should have) more scrutiny regarding their driving habits, as they are on the road constantly, and have more of an opportunity to be the cause of accidents (or conversely, by driving well, part of the solution). Driving a taxicab is certainly a difficult and low-paying job, but that is no reason that taxicab drivers should not be safe and courteous. With thousands of taxicabs hurtling around the area, there are certainly dozens of near-misses a day, where dangerous, reckless and even malicious behavior by a taxicab driver results in a situation where a vulnerable user is put at risk. Yet there seems to be no easy way to report these behaviors, and therefore there is little accountability.

In other words, there is certainly not an app for that.

Yet.

So here’s the idea: a website and app that would allow for the collection of data by bicyclists, pedestrians and other standers-by about the driving behavior of taxicabs. This would include a variety of features and the data could be used in several ways:

  • The data from this could be used to match poor behavior to certain cabs or operating companies, as well as to find particularly problematic locations. 
  • The program could easily send reports to the various taxi licensing agencies in local cities and towns, and to the appropriate police contacts. 
  • It would allow citizens—the ones who are almost bumped when cabs pull in to crosswalks at red lights, or the ones who see cabs lined up neatly in bike lanes awaiting fares or nearly mow down pedestrians because they can’t be bothered to turn their lights on at night—to easily send a report to the right authorities. 
  • It would allow anyone interested to view reports and find dangerous areas or medallions with particularly abhorrent safety records. 
  • It could be scaled in to a full-scale reporting system based on license plates, and focused on dangerous urban driving habits. It’s one thing to yell at the guy who honks at you and then cuts you off. It’s another to publicly shame him.

Cabs in particular seem to operate with some amount of impunity from police enforcement, but that’s no reason we shouldn’t try to gather data and hold them accountable. Plus, such a site could also allow bicyclists, pedestrians and even cab passengers to laud good driving in cabs which were courteous to bicyclists and yielded right-of-way to pedestrians in crosswalks. If nothing else, we—people who walk and bike—account for much of their customer base. We should demand accountability.

If anyone is interested in helping set this up, let me know. I’ve created some simple user-generated content sites (this and this), but this might be a bit beyond my technical expertise.

The one rule I always follow on a bike: Yield to Pedestrians

It’s big bike time, with Bike Days/Weeks/Months sprouting up across the land (some are in June; Minnesota moved theirs after we all froze our behinds off in 2009). And it’s time for bellyaching about bike sharing in New York, apparently. Oh, and for arguing about whether or not cyclists should have traffic laws enforced to the same degree as motorists.

I fall in to the “not” camp, with several exceptions. This is mainly because bicyclists and motorists are orders of magnitude apart in terms of kinetic energy, and thereby damage. Consider:

Bicycle:
Average weight (rider, bicycle, accessories): 180 pounds
Average speed (in city riding): 12 mph
Top speed (in city riding): 25 mph
Average potential energy: 1175 joules
Top potential energy: 5099 joules

Automobile:
Average weight: 4000 pounds
Average speed (in city traffic): 25 mph
Top speed (in city driving): 45 mph
Average potential energy: 113310 joules
Top potential energy: 367120 joules


In other words, the average vehicle has—give or take—100 times more kinetic energy than the average bicycle. I think we’d all agree that if the fines fit the potential kinetic energy (they’d be akin to jaywalking fines, which are $1 in Boston and $2 in New York) they’d be tolerable, if laughable. (And this page is on the record as being opposed to the concept of jaywalking being illegal.) But increasingly, policies towards bikers are moving in to the “fine first, ask questions later” camp.

When it comes to red lights and stop signs, the only person a bicyclist is really endangering is him or herself. No one has ever heard about a bicyclist running in to a vehicle and injuring the occupants inside. If I go through a red light (I should say “when …”), you can be sure I’ve checked the intersection to assure that it is clear of all traffic. And much of the time in such situations I am going through so that I can get on to the next stretch of roadway ahead of—and visible to—traffic behind me.

But the one traffic rule I always do my best to follow? Yielding right-of-way to pedestrians. First, it sets a really good example. Drivers have a tough time being all high-and-mighty when they blow by a cyclist who’s stopped to yield to a pedestrian (especially when said cyclists then meets them at a red light and chastises them for their behavior, but I digress). But it’s also important because pedestrians are, in relation to cyclists, orders of magnitude less energetic. In the vulnerability hierarchy, they have much less ability to cause damage:

Pedestrian:
Average weight: 150 pounds
Average speed: 3 mph
Average potential energy: 61 joules

Here’s a simple Excel chart to illustrate (Except that the top blue bar should be about half-again as long, it broke Excel. Well not really, but it’s illustrative.):

It’s not the same differential: a bicyclists only have one order of magnitude more energy than a pedestrian; vehicles have two more than bicycles (and three more—more than 1000 times more—energy than a walker). And while it’s rare, bicyclists have killed pedestrians. (To be fair, the cyclists are generally injured in such accidents, which rarely happens when a car does something like plowing through people on to a crowded sidewalk.) But when I’m cycling, I always try to stop for pedestrians.

Am I successful? Most of the time. There are times when I’m paying too much attention to traffic and don’t see the pedestrian waiting to cross. There area few times—and I feel bad about this—when I’ve had a close call with a pedestrian walking through stopped traffic as I passed on a shoulder or a bike lane (I usually try to apologize, something difficult to do from a vehicle). But much more often, I slow down, and wave a pedestrian across. Quite often, they are surprised at the courtesy, even though they have full right of way. I often extend my arm out to warn passing cars to slow down, and have more than once weaved in front of a car to get them to slow down.

From a practical standpoint, I can usually keep enough momentum that I don’t come to dead stop, since once the pedestrian clears my bike I can start moving again (and since I can bob and weave around the pedestrian with more ease than, say, a six-foot-wide car). From a bike advocacy standpoint, it shows courtesy amongst bicyclists to more vulnerable users. (When I see a guy in a full kit on a $4000 carbon frame whipping by pedestrians in Cambridge, I get upset; I’ll defer to the inimitable Colin on this.) And from a safety standpoint, it is safer for cyclists and much safer for pedestrians.

So for red lights for me? Stopping is optional. But crosswalks? It’s mandatory.

Longfellow Bike Traffic

I usually cross the Longfellow Bridge by bicycle around 7:30 a.m. It’s before the peak of the rush hour, and while I’m not alone on two wheels, it’s not too crowded. Twice this week, however, I’ve been crossing the bridge eastbound around 8:30. And both times, when I’ve reached the light at the end of the bridge, there was a veritable traffic jam of bicyclists, with a lineup of 10 two-wheelers waiting to turn right on to Charles or go straight up Cambridge. We’ve had a long string of great cycling weather (sunny, dry and cool), Hubway is in full swing, and we’re recovering from the marathon fiasco. So there are a lot of bicyclists.

From this small sample, I’m going to make some big extrapolations. I sleuthed out the traffic counts from the intersection from a Red Line / Blue Line connector document (pdf) and sussed out that it is a 100 second light cycle—that it repeats 36 times per hour. Assuming a constant ten cyclists per light cycle for an hour, this would equate to 360 bicycles across the Longfellow in an hour. Is this a big number? I think so. Here’s why:

  • This is more than half as many bicyclists as vehicles. Peak morning eastbound car traffic is 707 vehicles per hour. Now, the Longfellow is mainly a transit bridge, and at peak hour the Red Line carries more than 10,000 vehicles. Plus, vehicle traffic decreases (as it has in the Kendall area) and bicyclists’ numbers continue to climb.
  • Bicyclists have a sub-optimal facility on the Longfellow. In other words, the bike lane kind of sucks. It’s bumpy, narrow and squeezes down at the Boston end of the bridge (although it is better-paved there). The future lane will be a bit wider, although to preserve two lanes of inbound traffic it won’t have a buffer built in. Still, it won’t be as squeezed as it is now. (MassDOT pdf)
  • This illustrates the importance of keeping the bridge open to cyclists during construction, as is the plan. Even as traffic is limited to one direction, bicyclists and pedestrians will be allowed to cross the bridge in both directions. With hundreds of bikes per hour, it’s a vital link in the regional bicycle infrastructure.
  • Finally, the roadway is currently more efficient at carrying bicycles than motor vehicles. 707 vehicles use two lanes per hour, at a rate of 354 per hour. Bicycles use one lane, and there are (by my assuredly crude calculations) 360 bicyclists. But wait! Aren’t traffic lanes a lot wider than bike lanes? Yes. 360 bicyclists traverse the Longfellow in only 5 feet of bridge width, at a rate of 72 vehicles per foot. The 707 cars have 24 feet of bridge width, a rate of only 29 vehicles per foot. Even if we assume 1.25 people per car, bicycles are still twice as efficient at transporting people. (And, yes, the Red Line inbound, in 14 feet of bridge width, transports more than 10,000 people, making it ten times as efficient as the bike lane.)
Of course, the bike lane is certainly not at capacity (neither are the vehicle lanes; although the Red Line is quite crowded). Leaving two lanes for vehicular traffic in the new bridge design is contentious, and a single-lane design with a wider, buffered bicycle facility—akin to the outbound side of the bridge—would do more to encourage cycling. Even narrower lanes—and a wide bike lane—would help cyclists (and slow speeding motorists, as well). But even without that encouragement, bicyclists don’t seem to be shunning the Longfellow.