Longfellow Bike Count Update

I’ve been counting bikes on the Longfellow for … a while (although apparently not in 2015, slacker). In any case, with the layout of the bike lane changed appreciably over the past several months, I decided to count again. Here’s a quick breakdown of the Longfellow’s bicycle facilities in the past few years:

  • 2013: “Normal” pre-construction travel: bike lanes on both sides, two lanes of general traffic.
  • 2013–early 2015 construction: all traffic on the downstream side, one lane of traffic inbound, inbound bike lane, outbound contraflow lane with a buffer.
  • Early 2015–Late 2015: Inbound bike lane unchanged, but sections of outbound lane routed on to the sidewalk to accommodate work on the salt and pepper shakers.
  • Late 2015–Early 2016: Inbound bike lane eliminated for approximately 100m at the Cambridge end for Red Line shoo fly trackage; outbound lane eliminated entirely, cyclists asked to walk bikes across the bridge.
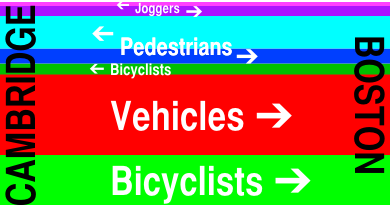
  • Early 2016–present: all cyclists on upstream sidewalk, pedestrians asked to use downstream sidewalk, outbound cyclists asked to loop under bridge to access Kendall. (The netting which broke free from the barriers in high winds has partially been removed, at least.) 
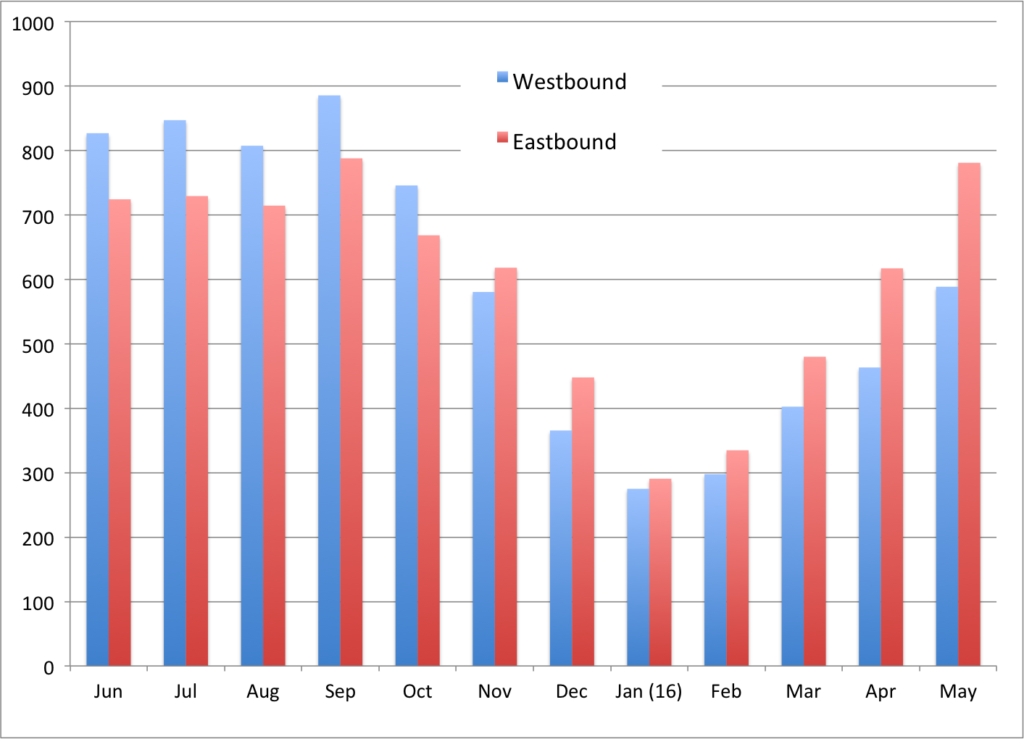
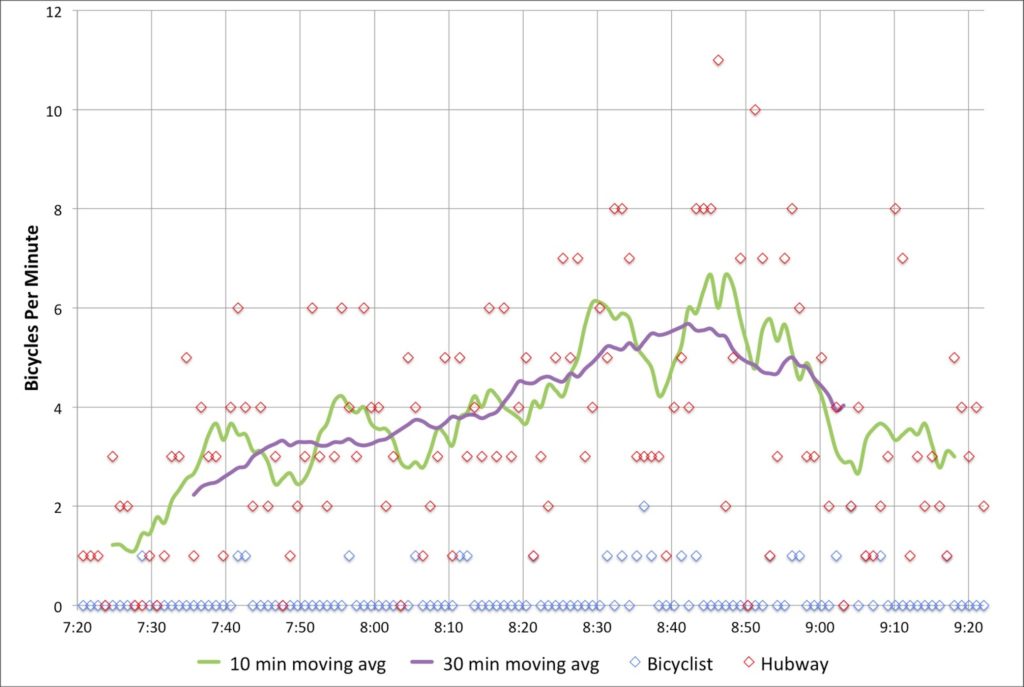
Average bicycle traffic on Broadway. The westbound
Longfellow lane has been impacted since Nov 9 2015.
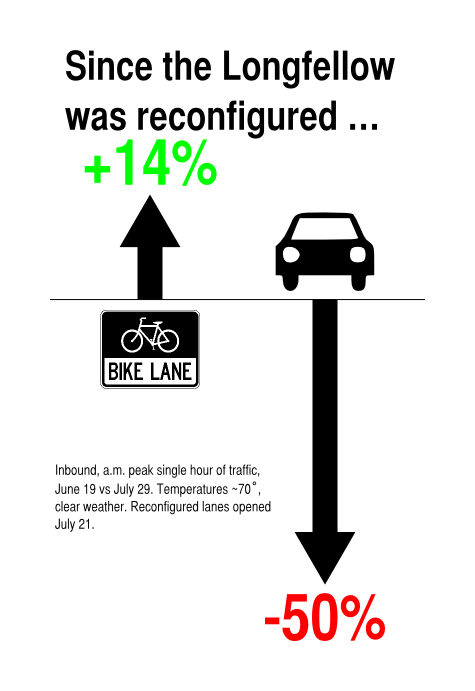
Back in 2014, nearly 400 cyclists used the bridge during the peak inbound commuting hour. Since then, there have been significant disruptions to the bicycling facility, so some traffic may have chosen alternate routes. When the outbound bike lane was closed in November, there was a marked drop in westbound cyclists on Broadway; this persists this spring as many cyclists seem to be avoiding the suggested loop-the-loop under the bridge. Yes, there’s data. See if you can tell when cycling west on the bridge was made more difficult?
This spring, eastbound cycling traffic in Cambridge has reached new heights, surpassing even last September’s average (although this could be due to the number of weekdays and weekend days averaged). Westbound traffic has dropped, owing to the bridge construction. Has eastbound traffic?
Yes. Slightly. The count on May 18 tallied a peak of 358 cyclists between 8:02 and 9:02. This corresponds to 392 cyclists counted at the Eco-Totem on Broadway between 8:00 and 9:15, or 314 per hour. (In other words, there are a few more cyclists crossing the Longfellow than there are at the Eco-Totem; i.e. more join the flow from Main Street and elsewhere across the bridge than leave Broadway after the Eco-Totem, or miss the counter entirely.) This drop could be due to a variety of factors, from construction to noise in the data. Hard to know.
This count was different than others since to see both sides of the bridge required sitting in an office high above the bridge. This meant, however, that I was able to see whether cyclists were using the upstream sidewalk, the roadway (sans bike lane) or, in a few cases, the downstream sidewalk (intermixed with pedestrians and some very narrow passageways under the turret reconstruction). The answer? Most cyclists use the upstream sidewalk. For Boston-bound cyclists, 95% used the upstream facility. For those coming to Cambridge, only 88% used the facility, but the absolute numbers were much lower, so that meant that only about 10 riders per hour were using the downstream sidewalk. While I wasn’t counting pedestrians, it seemed that most were using the downstream sidewalk, although this was the morning commute, which is not prime sightseeing time. Many of the upstream users seemed to be joggers, so at least their pace was better matched.
Westbound commuter counts were about even with the last count in 2014, although bizarrely the 2014 count peaked in the 8:15 range while the current count was highest around 8:45 (this could be noise in the data). There would probably be more marked differences looking at evening data; the Cambridge data suggests that many outbound commuters are avoiding the Longfellow in its current configuration.
What does this all mean? It means that most cyclists will roll with the punches as infrastructure changes, although the Cambridge data suggest that if it is too hard to use, cyclists will find other routes. It will be interesting to see how the upcoming phases change cyclist behavior as facilities are twice again shifted around the bridge prior to the final configuration. Finally, the Cambridge data is a great supplement to these counts, as it can give us a good idea of whether we counted on a high-use day or low, and such automated counts are obviously much more data-rich than simple eyes on the street, although it will take some time to build a multi-year data set to look at definitive trends. For instance: I counted more bikes in 2014, but there is no similar Cambridge data to compare that count to since the counter was only installed in 2015. 
But next year’s count, well, that will have data. And the bridge might be shifted around. Again.

Bridge costs and subsidies

Driving east on Route 2 today (carpooling!) we crossed through the Route 2 construction zone over 128. The 60-or-so-year-old bridge is decaying and is being fully rebuilt. 

Average daily traffic: 104,000, give or take.
Length of the bridge: 340 feet.
Cost: $50 million.
Cost per linear foot: $147,000
Cost per linear foot per person*: $1.18
(* assumes 1.2 passengers per car)

A bit closer to the city, there’s another bridge which whisks commuters in and out of Boston every day. It’s twice as old as the Route 2 bridge, and carries more people (but fewer vehicles). I speak, of course, of the Longfellow.

Average daily traffic: 130,000, give or take (20,000 cars, 100,000 Red Line, 10,000 bikes & peds)
Length of the bridge: 1850 feet.
Cost: $255 million.
Cost per linear foot: $138,000
Cost per linear foot per person*: $1.04

From Andy Singer.

The Longfellow Bridge, which is in a dense urban environment (harder to access with materials), over water (necessitating floating in many materials), includes significant historic elements (so it can’t be replaced with an off-the-shelf box-girder design), and is longer and higher than the Route 2 bridge, is actually cheaper to rebuild overall, and even moreso when you factor in the number of daily users. Sure, you could get five Route 2 bridges for the cost of one Longfellow, but those five bridges, end to end, wouldn’t reach across the Charles. So when we talk about transit subsidies versus highway subsidies, we should remember that, at least in this case, it’s cheaper to rebuild a multi-modal bridge than one used just by cars.

I’m not saying that we shouldn’t rebuild the Route 2 bridge. We can’t let our infrastructure crumble. But when it comes to rebuilding infrastructure, it’s important to know that every time you see cones on the side of the road, there’s a real cost involved. I would not be surprised if there are a lot of people who look at the Longfellow as a bloated project—a quarter billion dollars!—and don’t give a second thought driving by the orange barrels on Route 2.

Yet if we measure return on investment by how much new bridge we get per person traveling on it, it’s the little bridge replacement project out in Lexington that costs us more. And while the Longfellow is one of only a few transit-centric replacement projects (and even it contains a majority asphalt), there are scores of bridge replacement projects across the Commonwealth that chew up a lot more money. No one ever blinks an eye at a proposal to rebuild a decaying highway bridge. That’s necessary maintenance. But more transit projects are a much harder sell, even if they’re more efficient.

I counted bikes again

I’ve now counted bikes on the Longfellow five times, with the following results for the peak hour (generally 8:10 to 9:10, give or take a couple of minutes):

2013:
June: 267
July: 308
October: 298

Average: 291

2014:
June: 384
September: 391

Average: 388

Annual increase: 33%

The September count is new. I Tweeted about it and then let it go by the wayside. Sure, this confirms that bicycling on the Longfellow is up 33% over the year before, but this is barely news. Sure, there are more bikes across the Longfellow at rush hour than cars, but we knew that already.

It’s just another data point showing that the number of people riding bikes—for transportation, at rush hour (not a single roadie in spandex) continues to rise.

See you in the winter.

Longfellow Bike Count: Year 2

It’s kind of hard to believe that it’s been more than a year since my first Longfellow Bridge bike count, but it has. I’ve posted just a few times since then about the bridge, and seen the inbound lanes deconstructed, the towers come down, and, arch-by-arch, the bridge is now being rebuilt. I even went out in the middle of winter (and by out, I mean in to someone’s office with a view of the bridge) and counted about 90 bikes per hour: 30% of the previous summer’s crossings. (I think I tweeted this during the winter but didn’t write a whole post.)

So it was high time for a new count. I waited for a morning with good weather (and when I wouldn’t miss November Project) and set off for the bridge. After chatting with the DPW workers on my street about Hubway, I didn’t make it on to the bridge until 7:45, but that meant I was there in plenty of time to hit the peak morning bike rush hour, which (still) occurs from approximately 8:10 to 9:10 on the Longfellow. While at first the bike counts seemed flat or even down, once the rush got cranking, it became clear that there are more bicyclists this year than last.

Just to review, here are the bike counts for the peak hour from last year:

Wednesday, June 19, 2013: 267 bicyclists (8:12 – 9:12)
Tuesday, July 30, 2013: 308 bicyclists (8:08 – 9:08)
Tuesday, October 15, 2013: 298 bicyclists (8:11 – 9:11)

Here’s what I found this June (on the 24th, a Tuesday). The counts today peaked from 8:07 to 9:15 (that is to say, the 8:07 – 9:07 hour and the 8:15 – 9:15 hour saw the same counts). And the number of cyclists during those 60 minute blocks?

384

That’s one bike every nine seconds for an hour. Compared with the highest count last year in July, it’s an increase of 25%. Compared with the average of the three counts last year, it’s an increase of 32%. In a single year.

I can’t think of any single factor that would have increase bicycle usage by that much, other than more people riding bikes. So, contrary to any mitigating factors, I’m operating under the assumption that bicycling eastbound across the Longfellow is up by at least 25% this year. Between 8:30 and 9:00, there were 221 cyclists crossing the bridge and only 187 vehicles: 18% more bikes than cars. There were a few moments where the bridge looked downright Copenhagenish. With more bicyclists than vehicles crossing the bridge at peak times, perhaps it’s time to revisit the design and give bikes more than 20% of the road’s real estate.

Come see the StreetTalk 10in1 Wednesday!

This Wednesday, in beautiful Central Square, there is a thing called the 10-in-1 StreetTalk. The folks at LivableStreets solicit 10 presentations of no more than 7 minutes, and gather people to hear them.

And guess who’s presenting? This guy. And guess what I’m presenting about? This. Of course.

Find out more information here. And come for the other presentations!

The weather is cooler. The Longfellow is the same.

Twice this summer, we counted vehicles on the Longfellow. Between June and July, when the lanes of the bridge were shifted and constricted, bicycle traffic was level (well, actually, it rose slightly) while vehicular traffic decreased. I was otherwise occupied this September and didn’t get a chance to do a comparable bike count until last week, when I eked out an hour to sit on the bridge.

And the results are so mundane they aren’t even worthy of charts and graphics. Basically, the numbers were within a thin margin of error of those from July:

(All values for peak-hour of the count, note that the Longfellow runs east-west; Eastbound towards Boston, Westbound towards Cambridge)

Eastbound Bikes: 308 (July: 298)
Westbound Bikes: 63 (July: 68)
Eastbound Pedestrians: 65 (July: 83)
Westbound Pedestrians: 191 (July: 201)
Inbound Vehicles: 411 (July: 415)

So the bridge, even after two months of people getting used to the traffic patterns, has seen no major changes. Any drop in non-motorized use might be attributable to cooler weather (in the mid 50s rather than the upper 60s) or to random variance. And assuming a normal traffic day, there has been no significant increase in traffic since the bridge has opened.

It’s the last piece that I find most interesting. It really speaks to the concept of “induced demand.” With the wider Longfellow, we say 800 vehicles per hour traversing the bridge in June. Once the bridge was narrowed, that number fell to 400. There were weeks with dozens police directing traffic, but the number of cars very quickly hit a new equilibrium. People do not seem to need a major education campaign to figure out where to go. If the new roads are gridlocked, they’ll find alternate routes. The system has not ground to a halt (although inbound at the evening rush often backs up the length of the bridge). There are too many variables to find out if people have switched to other routes or modes or just not made the trip, but traffic in the morning across the Longfellow has not been the apocalypse.

One chart shows the change in Longfellow traffic

Boston’s massive reconstruction of the Longfellow Bridge
began this month. Over the next three years, traffic will be severely
restricted, bicyclists mostly accommodated, and rail traffic mostly maintained
across a major link in the transportation system which carries 100,000 transit
riders as well as several thousand bicyclists and pedestrians across the
Charles River (and some vehicular traffic, too).

In late June, I took a baseline, pre-construction count of
morning, inbound traffic across the bridge. With the new traffic configuration
in place (an inbound bike lane, a travel lane, a pylon-lined buffer and an
outbound bike lane, plus the sidewalk) I decided to take a new snapshot of the
bridge traffic. Had traffic declined with fewer lanes available? Are cyclists
shying away from the new configuration?
Here’s what I found, summed up in one chart:
Bicycle counts stayed about the same (they actually rose,
overall, and the peak hour saw 308 cyclists, an increase 14%). Vehicle counts, however, showed a dramatic drop, declining by 50% from 840 to 400 during the peak hour of use! It’s interesting that this is
not due, necessarily, to restricted capacity (the one lane of traffic didn’t
back up beyond the midpoint of the bridge at any time when I was counting,
although the afternoon is a different story) but perhaps the perception of
traffic, and the fact that the single lane reduces traffic speed quite a bit.
No lack of praise should be given to MassDOT for this
iteration of the Longfellow traffic pattern. The bicycle facilities are, if
anything, improved over the bridge before, especially considering the much lower vehicular traffic speeds and
volume. And there is no lack of cyclists—even on one of the quietest weeks for
traffic midsummer, there were more bikes than a day with similar weather in
June.
A few other tidbits:
  • Bicyclists and Pedestrians accounted for 60% of the traffic on the bridge. Cars transported fewer people than human power. (See diagram below.)
  • Between 8:30 and 8:45, there were actually more bicyclists
    crossing the bridge than vehicles.
  • Pedestrians of all types outnumber cyclists (although this
    includes both joggers and “commuters”—as defined by me—in both directions).
  • The flow of “commuting” pedestrians is a mirror image of
    bicyclists. There are four times as many Boston-bound cyclists as
    Cambridge-bound, but more than twice as many Cambridge-bound Pedestrians as
    Boston-bound. (There are fewer joggers, but they exhibit a preference towards
    running eastbound across the bridge, differing from the other foot traffic.) Overall there are more bicyclists going towards Boston and more pedestrians towards Cambridge.
  • While 24 Hubway shared bikes accounted for only 5% of
    inbound bicycle trips, the 20 outbound Hubways made up 18% of the
    Cambridge-bound bicyclists.
  • Only four cyclists used the sidewalk, and only one rode the wrong way in the contraflow lane. (I yelled at him.)
And one more diagram showing bridge use (for the record, one chart, one diagram and one infographic, and one annoying and slightly misleading title):

Longfellow bus-bike illogic

The Longfellow project is set to begin next week—signs have been flashing across the city advertising the multi-year lane closure—and at a meeting last week (documentation here), concerns were aired about traffic, gridlock, and banning bicycles from the roadway when the T is closed and buses traverse the bridge.

Wait, when the T is closed and transit riders are shunted on to a bus shuttle, were going to prohibit cyclists from crossing the bridge? When there are Hubway stations on either end? When buses will be packed with weekend travelers and trip lengths will be 10 or 20 minutes longer than usual? When taking a few people out of the system would reduce crowding and speed up trips for everyone else?

Yup.

MassDOT and the MBTA had been cagey about this, never outright saying that bikes were verboten until very recently, when their language was challenged (what does “emergency bike/bus lane” mean, anyway?) by cycling advocates.

In a recent email to stakeholders, MassHighway administrator Frank DePaola wrote:

There have been recently a few tragic incidents between Busses [sic] and bicyclists one common factor has been tight clearances and the bicyclist on the right hand side of the bus. During a red line bus diversion the frequency of busses [sic] between Kendall and Park Street will be quite high the probability of an incident on the tight quarters of the bridge, especially at the approaches is too high and safety is a big concern.

Let me attempt to rephrase:

There have been multiple crashes where buses have hit cyclists when passing them. If we get rid of the bikes, we won’t have to worry about these any more.

Never mind the fact that these bicycle-bus incidents have occurred with buses in normal operation, on roads with other vehicles, many distractions, and with buses pulling in and out of bus stops. The Longfellow, while narrow, won’t have any of this. There are no bus stops on the Longfellow. There will be no other cars on the Longfellow at this time. When a bus pulls out of a stop, the driver has to worry about cyclists passing on the right and cars going around on the left, while at the same time worrying about the rider running up and tapping on the door to try to get on the bus. None of this will take place on the Longfellow. Yet the default policy is to ban bikes.

While this is dismaying to the cycling community, it seems to be almost insulting to MBTA drivers. It almost says to them that the T and MassDOT don’t have faith in them to successfully pass cyclists—something they do thousands of times per day in heavy traffic—on an otherwise closed roadway. I’m sure that experienced MBTA bus drivers can drive across the Longfellow and pass cyclists at the same time.

A salient issue is the pinch point at the Boston end of the bridge, where the width reduces from 29 feet to 22 feet for a 300 foot stretch. This is of concern, but could be remedied with a simple instruction to bus drivers: do not pass cyclists on this section of bridge. There is no need to erect signage to get this point across; MBTA supervisors could remind drivers of the policy before each shift crossing the bridge. (The narrowness of this portion of the bridge is another reminder that two-way vehicle traffic at any other time should be a total non-starter, especially since bicycle counts have actually increased since the new bridge configuration.)

Yes, this will result in some measurable delay for bus passengers. But these delays, I think, would be minimal. Let’s run some (estimated) numbers:

  • The MBTA will have up to 15 buses on the Red Line loop to serve passengers. Assuming the route takes 15 minutes (it will likely take slightly longer) this is an average of 1 bus per minute.
  • Each bus will carry 50 passengers (35-40 passengers plus standees).
  • The 2011 bicycle/pedestrian counts found an average of 30 bikes per hour in each direction crossing the Longfellow midday on weekends. While numbers may have climbed since, some cyclists will choose other routes due to the construction, so this is a fine estimate.
  • Cyclists on this section will average 8 mph going towards Cambridge (uphill) and 16 mph towards Boston (downhill).
So let’s run some scenarios. A bus traveling at 20 mph will traverse the 300 foot narrow section in approximately 10 seconds. Thus, an inbound bus which would have to slow behind a cyclist going 16 mph would lose 3 seconds. An outbound bus would have more of a time penalty; following a cyclist for 300 feet through this pinch would take 25 seconds to cover 300 feet, a delay of 15 seconds. 
But how often would there be any conflict between a bus and a cyclists in this section of roadway anyway? It is not like there will be a constant line of buses or a constant stream of cyclists. Let’s assume a buffer for both buses and cyclists regarding any bus/bike road conflict of double the actual time needed to traverse the segment. For buses, it would mean that the would occupy these 300 feet of roadway 33% of the time (20 seconds every minute). For inbound cyclists, they would occupy the roadway 22% of the time (26 seconds every two minutes). Outbound cyclists would occupy the roadway 42% of the time (50 seconds every two minutes).
Let’s do some math. For inbound traffic, there would be a potential conflict 7.5% of the time. This would delay 4.5 buses per hour an average of 3 seconds each, for a total of 13.5 seconds per hour. Assuming 50 passengers per bus, this would be a total of 675 seconds of delay per hour. (Although this might be even less as buses would slow to cycling speed or lower to navigate the turns at Charles Circle.)
For outbound traffic, there would be a potential conflict 14% of the time. This would delay 8.4 buses per hour for an average of 15 seconds each, for a total delay of 118 seconds per hour. Again, if we assume 50 passengers per bus, this is a total of 5880 seconds of delay per hour. (This too might be less as buses accelerate up the bridge approach at a slower average speed.)
This is a total of 6555 seconds of delay for bus passengers per hour. However, this is actually a pretty small number. If there are 50 passengers per bus in each direction, and one bus crossing the bridge every minute, there will be 6000 passengers per hour. Thus, the total delay per bus passenger by allowing cyclists on the bridge (and having buses not pass them in the narrow section) will be just 1.1 seconds per passenger. Considering that the total delay due to Red Line closures will amount to 10 to 20 minutes, this will just 1/500th to 1/1000th of the total detour. In other words, any delay caused will be negligible.

We can also attempt to quantify the delays for cyclists who would be rerouted around the bridge. There are many fewer cyclists, but the potential detours result in a much longer delay. Requiring cyclists to use the Harvard or Craigie Bridge will add 2 to 4 minutes to a trip from Park Street to Kendall. With 60 cyclists per hour, this would equate to 180 minutes—or 10,800 seconds—per hour, far higher than the total delay for bus passengers.

In addition, there are two temporary signs which, I think, would be perfectly acceptable to the bicycling community and which will help mitigate potential conflicts further: First, on each side of the bridge, there should be a sign reading

BICYCLES KEEP SINGLE FILE

This will remind cyclists that there are buses passing on the bridge. The second sign, approaching the outbound side in Boston, would read:

BICYCLES YIELD TO BUSES

This would mean that if a bicyclist and a bus approached the choke point at the same time, the bus would go ahead, and the bicyclist would then be able to navigate the narrow section before the next bus enters the bridge. This would reduce potential conflicts, as well as reducing the need for buses to pass cyclists in this narrow section.

A better policy than hoisting “no bikes” signs would be to allow bikes, and evaluate any issues which arise. This is the policy they are taking towards Mass General, TD Bank and other institutions which are insisting than closing the road to traffic will result in so much gridlock the people won’t be able to get home from sporting events or concerts (seriously) or home from the hospital (a major reason the inbound direction was selected to be kept open was to allow emergency access to MGH). If we are going to make concessions to these groups, we should do the same for cyclists who will actually help to alleviate congestion during the closure times.

The wrong way and wrong time to do a bike count

At some point, I might get off my high horse regarding bicycle counts on the Longfellow Bridge. But for now, I’m staying on. Why? Because I did my bike count on a Wednesday morning in June, to get a “typical” commute count (although, to be fair, with colleges out for summer it may have been a bit less traffic than some of the year). And I think I’m collecting better data than the established counts. Going through this process, I’ve found out more information about the National Bicycle and Pedestrian Documentation project, which is used as a basis for counting by local transportation agencies across the country, including the CTPS locally.


And I have not been particularly pleased with what I’ve found.


I think I originally buried the lede here, so I’ll add a bit here that I reiterate in the final paragraph: the bicycle and pedestrian count methodology treats bicyclists and pedestrians more as leisure users rather than treating them as using viable modes of transportation. We don’t take typical auto counts during vacation periods, and we shouldn’t do this for bicyclists, either. We should count bicyclists and pedestrians during normal use times, and design facilities based on this usage, especially in urban areas where bicycling and walking are important not only as transportation modes but as congestion mitigation resources

So what’s wrong with the national bike counting standards? First of all, the survey methods seem to come from about 15 years ago. From the directions:

Each counter should bring counting sheets, two writing utensils, a watch or cell phone for keeping time, and a clipboard or other device to write on. Counts are conducted in 15-minute intervals, and comprise the total volume of pedestrians and bicyclists traveling in both directions passing a given point. 

Here we are, in 2013, when everyone has an iPad and an iPhone and a laptop, and we’re taking counts with paper and pencil, and then admonishing people to make sure they don’t lose the paper because it is irreplaceable until it has been entered in to the database. Great. When I went to do my count, I didn’t even consider using paper and pencil, because it just didn’t make sense. I thought about writing a python script, but settled on Excel because it was easier to write and easier to test. But for a national program, how hard would it be to have an iPad app? Nothing fancy, just something where you tap a button every time you see a pedestrian or cyclist (it would be easy to have these buttons be customizable) and then directly upload the time-stamped data. 


Is there an up-front cost? Yes. Although my only overhead was the power to charge my computer’s battery and about 30 minutes on Google to figure out how to set up the Excel spreadsheet.


Second, why on earth would you survey typical use on July 4 weekend? I can not get over this. Their explanation is that it is selected because “The 4th of July period … will afford both a typical summer weekday and what is typically the busiest holiday period and activity period for recreational facilities and activities.” Three points. First, July 4 is not a typical holiday. You are likely to wind up counting a lot of people walking or bicycling to parades and fireworks. Are there a lot of parades on Columbus Day? So with one of the four annual counts, you’re collecting data which is unusable every other day of the year. Second, and excuse the italics, but in what universe is July 5, the Friday after July 4, is going to be a typical weekday? Half of my office is taking it off. Half of the country has vacation bounce messages on their emails this week. Third, while it is a busy time, so many people are traveling that it is not representative of many other weekends. I would contend that you’d get much more useful data by surveying a typical weekend in July rather than focusing on July 4. We’re spending all of this time and money to sample bicycle use, and we’re collecting just bad data.


Third, while uniformity is sometimes good, bicycle and pedestrian use is highly localized, so what works in one city may not work in another. In other words, there’s not a very good argument for standardizing bicycle count dates across the country other than to increase awareness. Awareness is a good thing. But it shouldn’t trump good data.


Harrumph.


You’d think that the NBPDP would at least be consistent in their data collection documentation, but this is not the case at all. This current survey is planned for a Thursday, Friday and Saturday. Their instructions document (available here) states that “Weekday counts should always be done Tuesday through Thursday, and never on a holiday.” Now, I understand that this is in relation to the national count in September, but, uh, guys? July 4-6 is a Holiday, Friday and Saturday. You’re 1-for-3. That might work in baseball, but it’s not a passing grade elsewhere.


Finally, in Boston this is an especially fraught issue. Why? Because on July 4, many of the city’s highest-use bicycle facilities are being closed. The Esplanade will be closed to bicyclists all day. The Longfellow and Harvard bridges are closing at 4 p.m. So any bicyclists after that point wishing to travel from Cambridge to Boston will have to either cycle across the Charles River Dam, or go up to the BU Bridge. Does it make any sense to take bicycle counts on this day? 


I’m not saying that my methodology was perfect, but it’s hard to comprehend how the current counts make much sense. If we go around collecting shoddy data and wind up undercounting bicyclists, we have only ourselves to blame when we get underdesigned facilities. It seems like high time to assess both the overall efficacy of the NBPDP, and especially whether Boston should participate in the program.


And a larger, and perhaps more important point: by prioritizing non-commuting periods, we are treating bicyclists as recreational users, not as a viable mode of transportation. Would we count cars during July 4 week? Of course not. AASHTO even says that such periods are “atypical” and would not have valid data. By counting traffic at these times, we are doing a severe disservice to bicycle advocacy.

Longfellow Bike Count

One of the issues I’ve touched on in the Longfellow Bridge series is the fact that there as no bicycle count done at peak use times—inbound in the morning. The state’s report from 2011 (PDF) counted bicyclists in the evening, and shows only about 100 cyclists crossing the bridge in two hours. Anecdotally, I know it’s way more than that. At peak times, when 10 to 20 cyclists jam up the bike lane at each light cycle, it means that 250 to 500 or more cyclists are crossing the bridge each hour. So these numbers, and bridge plans based on them, make me angry.

But instead of getting mad, I got even. I did my own guerrilla traffic count. On Wednesday morning, when it was about 60 degrees and sunny, I went out with a computer, six hours of battery life and an Excel spreadsheet and started entering data. For every vehicle or person—bike, train, pedestrian and car—I typed a key, created a timestamp, and got 2250 data points from 7:20 to 9:20 a.m. Why 7:20 to 9:20? Because I got there at 7:20 and wanted two hours of data. Pay me to do this and you’ll get less arbitrary times.

But I think it’s good data! First of all, the bikes. In two hours of counting, I counted 463 bicyclists crossing the Longfellow Bridge. That’s right, counting just inbound bicyclists, I saw more cyclists cross the Longfellow in one direction than any MassDOT survey saw in both directions. The peak single hour for cyclists was from 8:12 to 9:12, during which time 267 cyclists crossed the bridge—an average of one every 13.4 seconds. So, yes, cyclists have been undercounted in official counts.

Are we Market Street in San Francisco? Not yet. Of course, Market Street—also with transit in the center—is closed to cars. [Edit: Market Street is partially closed to private vehicles, with plans being discussed for further closures.] And at the bottom of a hill, it’s a catchment zone for pretty much everyone coming out of the heights. They measured 1000 bikes in an hour (with a digital sensor, wow!), but that was on Bike to Work Day; recent data show somewhat fewer cyclists (but still a lot).

I also counted vehicles (1555 over two hours; 700 to 800 per hour, including three State Troopers and one VW with ribbons attached that passed by twice), inbound pedestrians (about 100, evenly split between joggers and walkers, although there were more joggers early on; I guess people had to get home, shower and go to work) and even inbound Red Line trains (30, with an average headway of 4:10 and a standard deviation of 1:50). I didn’t count outbound pedestrians, or the exact number of people I saw stopping to take pictures (at least three on my little nook of the bridge).

But did you come here for boring paragraphs? No, you came for charts! Yay charts! (Also, yay blogging at 11:20 p.m. when I should be fast asleep. Click to enlarge.)

First, bikes. Cyclists crossing the bridge started out somewhat slow—the moving average for the first 20 minutes was only one or two per minute. But the number of cyclists peaks around 8:40—people going in to the city for a 9:00 start—before tapering off after 9. I’ve written before about seeing up to 18 people in line at Charles Circle which is backed up by these data; the highest single minute saw 11 cyclists, and there were four consecutive minutes during which 36 bikes passed. At nearly 6 bikes per minute for the highest half hour, it equates to nearly 360 bikes per hour—or 10 per 100 second light cycle. Too bad we’re all squeezed in to that one little lane. (Oh, here’s a proposal to fix that.) If anything, these numbers might be low—the roads were still damp from the overnight rain early this morning.

What was interesting is how few Hubway bikes made it across the bridge—only 25, or about 6% of the total. With stations in Cambridge and Somerville, it seems like there is a large untapped market for Hubway commuters to come across the bridge. There are certainly enough bikes in Kendall for a small army to take in to town.

Next, cars. The official Longfellow traffic counts show about 700 cars per hour, which is right about what my data show. What’s interesting is that there are two peaks. One is right around 8:00, and a second is between 8:30 and 9:00. I wonder if this would smooth out over time, or if there is a pronounced difference in the vehicular use of the bridge during these times. In any case, 700 vehicles per minute is not enough that it would fill two lanes even to the top of the bridge, so the second lane—at this time of day, anyway—is not necessary on the Cambridge side.

I also tracked foot traffic. I did my best to discern joggers and runners from commuters. Joggers started out strong early, but dwindled in number, while commuters—in ties and with backpacks and briefcases—came by about once every minute. I was only counting inbound pedestrians, and there were assuredly more going out to Kendall. Additionally, I was on the subpar, very-narrow sidewalked side; the downstream sidewalk is twice the width (although both will be widened as part of the bridge reconstruction).

And I counted when the trains came by. In the time that 2500 bikes, pedestrians and cars crossed the bridge, 30 trains also did. Of course, these were each carrying 500 to 1200 people, so they probably accounted for 25,000 people across the bridge, ten times what the rest of the bridge carried. Efficiency! The train times are interesting. The average headway is 4:10, with a standard deviation of 1:58. However, about half of the headways are clustered between 2 and 3 minutes. That’s good! The problem is that the rest are spread out, anywhere from 3:30 to 8:30! Sixteen trains came between 7:20 and 8:20, but only 14 during the busier 8:20 to 9:20 timeframe. I wonder if this is due to crowding, or just due to poor dispatch—or a combination of both.

In any case, what Red Line commuter hasn’t inexplicably sat on a stationary train climbing the Longfellow out of Kendall? Well, after watching for two hours, I have an answer for why this happens!  It is—uh—I was lying. I have no idea. But I say no fewer than a half dozen trains sit at that signal—and not only when there was a train just ahead—for a few seconds or even a couple infuriating minutes. I was glad I wasn’t aboard.

Finally, we can compare the number of bikes as a percentage of the number of cars crossing the bridge each minute. Overall, there were 30% as many bikes as cars. But seven minutes out of the two hours, there were more bikes across the bridge than vehicles. Cars—due to the traffic lights—tend to come in waves, so there’s more volatility. Although bikes travel in packs, too. Anyway, this doesn’t tell us much, it’s just a bunch of lines. But it’s fun.