Longfellow Bike Count Update

I’ve been counting bikes on the Longfellow for … a while (although apparently not in 2015, slacker). In any case, with the layout of the bike lane changed appreciably over the past several months, I decided to count again. Here’s a quick breakdown of the Longfellow’s bicycle facilities in the past few years:

  • 2013: “Normal” pre-construction travel: bike lanes on both sides, two lanes of general traffic.
  • 2013–early 2015 construction: all traffic on the downstream side, one lane of traffic inbound, inbound bike lane, outbound contraflow lane with a buffer.
  • Early 2015–Late 2015: Inbound bike lane unchanged, but sections of outbound lane routed on to the sidewalk to accommodate work on the salt and pepper shakers.
  • Late 2015–Early 2016: Inbound bike lane eliminated for approximately 100m at the Cambridge end for Red Line shoo fly trackage; outbound lane eliminated entirely, cyclists asked to walk bikes across the bridge.
  • Early 2016–present: all cyclists on upstream sidewalk, pedestrians asked to use downstream sidewalk, outbound cyclists asked to loop under bridge to access Kendall. (The netting which broke free from the barriers in high winds has partially been removed, at least.) 
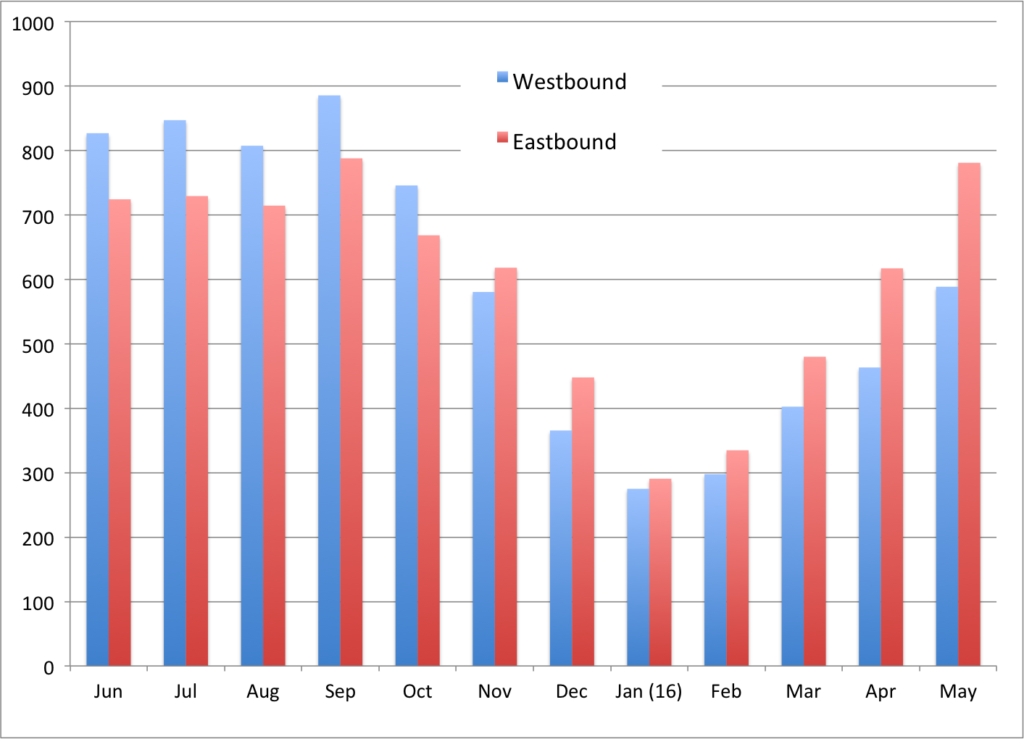
Average bicycle traffic on Broadway. The westbound
Longfellow lane has been impacted since Nov 9 2015.
Back in 2014, nearly 400 cyclists used the bridge during the peak inbound commuting hour. Since then, there have been significant disruptions to the bicycling facility, so some traffic may have chosen alternate routes. When the outbound bike lane was closed in November, there was a marked drop in westbound cyclists on Broadway; this persists this spring as many cyclists seem to be avoiding the suggested loop-the-loop under the bridge. Yes, there’s data. See if you can tell when cycling west on the bridge was made more difficult?
This spring, eastbound cycling traffic in Cambridge has reached new heights, surpassing even last September’s average (although this could be due to the number of weekdays and weekend days averaged). Westbound traffic has dropped, owing to the bridge construction. Has eastbound traffic?
Yes. Slightly. The count on May 18 tallied a peak of 358 cyclists between 8:02 and 9:02. This corresponds to 392 cyclists counted at the Eco-Totem on Broadway between 8:00 and 9:15, or 314 per hour. (In other words, there are a few more cyclists crossing the Longfellow than there are at the Eco-Totem; i.e. more join the flow from Main Street and elsewhere across the bridge than leave Broadway after the Eco-Totem, or miss the counter entirely.) This drop could be due to a variety of factors, from construction to noise in the data. Hard to know.
This count was different than others since to see both sides of the bridge required sitting in an office high above the bridge. This meant, however, that I was able to see whether cyclists were using the upstream sidewalk, the roadway (sans bike lane) or, in a few cases, the downstream sidewalk (intermixed with pedestrians and some very narrow passageways under the turret reconstruction). The answer? Most cyclists use the upstream sidewalk. For Boston-bound cyclists, 95% used the upstream facility. For those coming to Cambridge, only 88% used the facility, but the absolute numbers were much lower, so that meant that only about 10 riders per hour were using the downstream sidewalk. While I wasn’t counting pedestrians, it seemed that most were using the downstream sidewalk, although this was the morning commute, which is not prime sightseeing time. Many of the upstream users seemed to be joggers, so at least their pace was better matched.
Westbound commuter counts were about even with the last count in 2014, although bizarrely the 2014 count peaked in the 8:15 range while the current count was highest around 8:45 (this could be noise in the data). There would probably be more marked differences looking at evening data; the Cambridge data suggests that many outbound commuters are avoiding the Longfellow in its current configuration.
What does this all mean? It means that most cyclists will roll with the punches as infrastructure changes, although the Cambridge data suggest that if it is too hard to use, cyclists will find other routes. It will be interesting to see how the upcoming phases change cyclist behavior as facilities are twice again shifted around the bridge prior to the final configuration. Finally, the Cambridge data is a great supplement to these counts, as it can give us a good idea of whether we counted on a high-use day or low, and such automated counts are obviously much more data-rich than simple eyes on the street, although it will take some time to build a multi-year data set to look at definitive trends. For instance: I counted more bikes in 2014, but there is no similar Cambridge data to compare that count to since the counter was only installed in 2015. 
But next year’s count, well, that will have data. And the bridge might be shifted around. Again.

Bridge costs and subsidies

Driving east on Route 2 today (carpooling!) we crossed through the Route 2 construction zone over 128. The 60-or-so-year-old bridge is decaying and is being fully rebuilt. 

Average daily traffic: 104,000, give or take.
Length of the bridge: 340 feet.
Cost: $50 million.
Cost per linear foot: $147,000
Cost per linear foot per person*: $1.18
(* assumes 1.2 passengers per car)

A bit closer to the city, there’s another bridge which whisks commuters in and out of Boston every day. It’s twice as old as the Route 2 bridge, and carries more people (but fewer vehicles). I speak, of course, of the Longfellow.

Average daily traffic: 130,000, give or take (20,000 cars, 100,000 Red Line, 10,000 bikes & peds)
Length of the bridge: 1850 feet.
Cost: $255 million.
Cost per linear foot: $138,000
Cost per linear foot per person*: $1.04

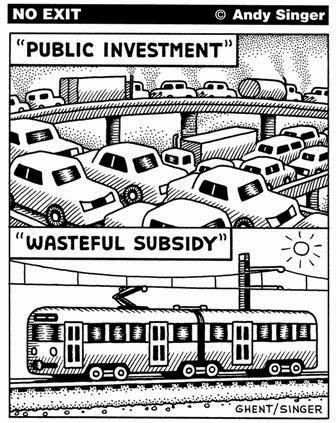
From Andy Singer.

The Longfellow Bridge, which is in a dense urban environment (harder to access with materials), over water (necessitating floating in many materials), includes significant historic elements (so it can’t be replaced with an off-the-shelf box-girder design), and is longer and higher than the Route 2 bridge, is actually cheaper to rebuild overall, and even moreso when you factor in the number of daily users. Sure, you could get five Route 2 bridges for the cost of one Longfellow, but those five bridges, end to end, wouldn’t reach across the Charles. So when we talk about transit subsidies versus highway subsidies, we should remember that, at least in this case, it’s cheaper to rebuild a multi-modal bridge than one used just by cars.

I’m not saying that we shouldn’t rebuild the Route 2 bridge. We can’t let our infrastructure crumble. But when it comes to rebuilding infrastructure, it’s important to know that every time you see cones on the side of the road, there’s a real cost involved. I would not be surprised if there are a lot of people who look at the Longfellow as a bloated project—a quarter billion dollars!—and don’t give a second thought driving by the orange barrels on Route 2.

Yet if we measure return on investment by how much new bridge we get per person traveling on it, it’s the little bridge replacement project out in Lexington that costs us more. And while the Longfellow is one of only a few transit-centric replacement projects (and even it contains a majority asphalt), there are scores of bridge replacement projects across the Commonwealth that chew up a lot more money. No one ever blinks an eye at a proposal to rebuild a decaying highway bridge. That’s necessary maintenance. But more transit projects are a much harder sell, even if they’re more efficient.

I counted bikes again

I’ve now counted bikes on the Longfellow five times, with the following results for the peak hour (generally 8:10 to 9:10, give or take a couple of minutes):

2013:
June: 267
July: 308
October: 298

Average: 291

2014:
June: 384
September: 391

Average: 388

Annual increase: 33%

The September count is new. I Tweeted about it and then let it go by the wayside. Sure, this confirms that bicycling on the Longfellow is up 33% over the year before, but this is barely news. Sure, there are more bikes across the Longfellow at rush hour than cars, but we knew that already.

It’s just another data point showing that the number of people riding bikes—for transportation, at rush hour (not a single roadie in spandex) continues to rise.

See you in the winter.

Longfellow Bike Count: Year 2

It’s kind of hard to believe that it’s been more than a year since my first Longfellow Bridge bike count, but it has. I’ve posted just a few times since then about the bridge, and seen the inbound lanes deconstructed, the towers come down, and, arch-by-arch, the bridge is now being rebuilt. I even went out in the middle of winter (and by out, I mean in to someone’s office with a view of the bridge) and counted about 90 bikes per hour: 30% of the previous summer’s crossings. (I think I tweeted this during the winter but didn’t write a whole post.)

So it was high time for a new count. I waited for a morning with good weather (and when I wouldn’t miss November Project) and set off for the bridge. After chatting with the DPW workers on my street about Hubway, I didn’t make it on to the bridge until 7:45, but that meant I was there in plenty of time to hit the peak morning bike rush hour, which (still) occurs from approximately 8:10 to 9:10 on the Longfellow. While at first the bike counts seemed flat or even down, once the rush got cranking, it became clear that there are more bicyclists this year than last.

Just to review, here are the bike counts for the peak hour from last year:

Wednesday, June 19, 2013: 267 bicyclists (8:12 – 9:12)
Tuesday, July 30, 2013: 308 bicyclists (8:08 – 9:08)
Tuesday, October 15, 2013: 298 bicyclists (8:11 – 9:11)

Here’s what I found this June (on the 24th, a Tuesday). The counts today peaked from 8:07 to 9:15 (that is to say, the 8:07 – 9:07 hour and the 8:15 – 9:15 hour saw the same counts). And the number of cyclists during those 60 minute blocks?

384

That’s one bike every nine seconds for an hour. Compared with the highest count last year in July, it’s an increase of 25%. Compared with the average of the three counts last year, it’s an increase of 32%. In a single year.

I can’t think of any single factor that would have increase bicycle usage by that much, other than more people riding bikes. So, contrary to any mitigating factors, I’m operating under the assumption that bicycling eastbound across the Longfellow is up by at least 25% this year. Between 8:30 and 9:00, there were 221 cyclists crossing the bridge and only 187 vehicles: 18% more bikes than cars. There were a few moments where the bridge looked downright Copenhagenish. With more bicyclists than vehicles crossing the bridge at peak times, perhaps it’s time to revisit the design and give bikes more than 20% of the road’s real estate.

The weather is cooler. The Longfellow is the same.

Twice this summer, we counted vehicles on the Longfellow. Between June and July, when the lanes of the bridge were shifted and constricted, bicycle traffic was level (well, actually, it rose slightly) while vehicular traffic decreased. I was otherwise occupied this September and didn’t get a chance to do a comparable bike count until last week, when I eked out an hour to sit on the bridge.

And the results are so mundane they aren’t even worthy of charts and graphics. Basically, the numbers were within a thin margin of error of those from July:

(All values for peak-hour of the count, note that the Longfellow runs east-west; Eastbound towards Boston, Westbound towards Cambridge)

Eastbound Bikes: 308 (July: 298)
Westbound Bikes: 63 (July: 68)
Eastbound Pedestrians: 65 (July: 83)
Westbound Pedestrians: 191 (July: 201)
Inbound Vehicles: 411 (July: 415)

So the bridge, even after two months of people getting used to the traffic patterns, has seen no major changes. Any drop in non-motorized use might be attributable to cooler weather (in the mid 50s rather than the upper 60s) or to random variance. And assuming a normal traffic day, there has been no significant increase in traffic since the bridge has opened.

It’s the last piece that I find most interesting. It really speaks to the concept of “induced demand.” With the wider Longfellow, we say 800 vehicles per hour traversing the bridge in June. Once the bridge was narrowed, that number fell to 400. There were weeks with dozens police directing traffic, but the number of cars very quickly hit a new equilibrium. People do not seem to need a major education campaign to figure out where to go. If the new roads are gridlocked, they’ll find alternate routes. The system has not ground to a halt (although inbound at the evening rush often backs up the length of the bridge). There are too many variables to find out if people have switched to other routes or modes or just not made the trip, but traffic in the morning across the Longfellow has not been the apocalypse.

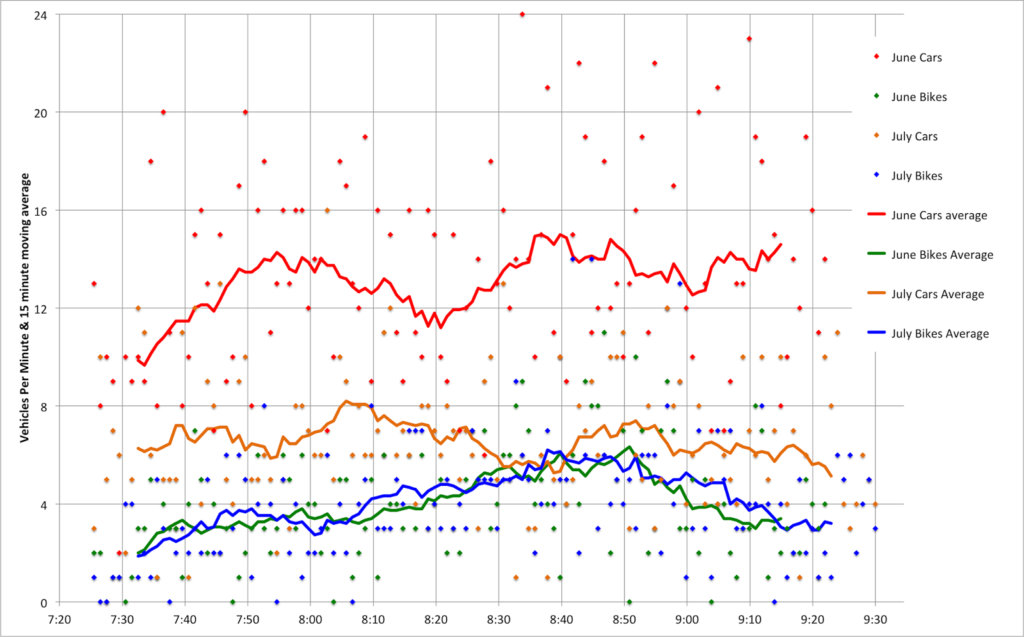
One chart shows the change in Longfellow traffic

Boston’s massive reconstruction of the Longfellow Bridge
began this month. Over the next three years, traffic will be severely
restricted, bicyclists mostly accommodated, and rail traffic mostly maintained
across a major link in the transportation system which carries 100,000 transit
riders as well as several thousand bicyclists and pedestrians across the
Charles River (and some vehicular traffic, too).

In late June, I took a baseline, pre-construction count of
morning, inbound traffic across the bridge. With the new traffic configuration
in place (an inbound bike lane, a travel lane, a pylon-lined buffer and an
outbound bike lane, plus the sidewalk) I decided to take a new snapshot of the
bridge traffic. Had traffic declined with fewer lanes available? Are cyclists
shying away from the new configuration?
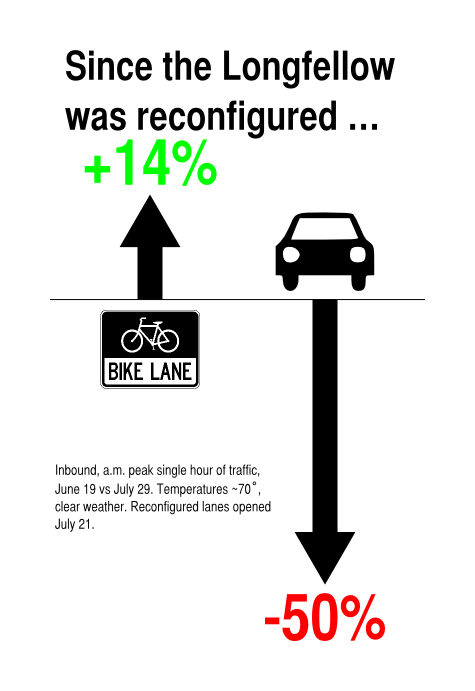
Here’s what I found, summed up in one chart:
Bicycle counts stayed about the same (they actually rose,
overall, and the peak hour saw 308 cyclists, an increase 14%). Vehicle counts, however, showed a dramatic drop, declining by 50% from 840 to 400 during the peak hour of use! It’s interesting that this is
not due, necessarily, to restricted capacity (the one lane of traffic didn’t
back up beyond the midpoint of the bridge at any time when I was counting,
although the afternoon is a different story) but perhaps the perception of
traffic, and the fact that the single lane reduces traffic speed quite a bit.
No lack of praise should be given to MassDOT for this
iteration of the Longfellow traffic pattern. The bicycle facilities are, if
anything, improved over the bridge before, especially considering the much lower vehicular traffic speeds and
volume. And there is no lack of cyclists—even on one of the quietest weeks for
traffic midsummer, there were more bikes than a day with similar weather in
June.
A few other tidbits:
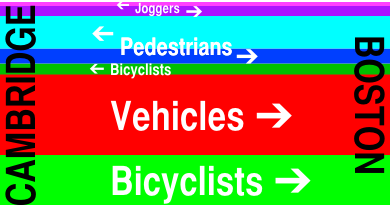
  • Bicyclists and Pedestrians accounted for 60% of the traffic on the bridge. Cars transported fewer people than human power. (See diagram below.)
  • Between 8:30 and 8:45, there were actually more bicyclists
    crossing the bridge than vehicles.
  • Pedestrians of all types outnumber cyclists (although this
    includes both joggers and “commuters”—as defined by me—in both directions).
  • The flow of “commuting” pedestrians is a mirror image of
    bicyclists. There are four times as many Boston-bound cyclists as
    Cambridge-bound, but more than twice as many Cambridge-bound Pedestrians as
    Boston-bound. (There are fewer joggers, but they exhibit a preference towards
    running eastbound across the bridge, differing from the other foot traffic.) Overall there are more bicyclists going towards Boston and more pedestrians towards Cambridge.
  • While 24 Hubway shared bikes accounted for only 5% of
    inbound bicycle trips, the 20 outbound Hubways made up 18% of the
    Cambridge-bound bicyclists.
  • Only four cyclists used the sidewalk, and only one rode the wrong way in the contraflow lane. (I yelled at him.)
And one more diagram showing bridge use (for the record, one chart, one diagram and one infographic, and one annoying and slightly misleading title):