Boston’s Worst Traffic Day of the Year

It’s tomorrow. The Friday before Columbus Day.

I have no actual data to back this up. Only anecdotal and empirical data. (Oh, and data from the Pike, which claims it’s second to the Friday before mother’s day in May, but I think that might be just for the Pike without the added benefit of every road north and south of the state, too. How prescient that this article comes out right after I post this.) But here’s what happens, and here’s how to avoid it.

Boston sees a lot of bad traffic. In the winter, when everyone is in town and weather hits, the entire system can grind to a halt. (The worst I know of was in December 2007 when a storm hit Boston around noontime. Snow fell heavily from the onset with temperatures in the mid-20s, so roads iced over. So many people left work early to beat the weather home that the roads filled up completely and plows couldn’t keep them clean. So the entire network ground to a halt until snow let up late in the evening.) But you can’t really plan for that. In the summer, Boston sees epic traffic jams headed out of the city to and from vacation spots, especially getting on and off of Cape Cod (the eight hour, 25-mile backup this July 4 this year was particularly bad), although other bottlenecks in New Hampshire and Western Mass can be painstakingly slow.

But the Friday before Columbus Day Weekend is the worst. Here’s why:

  • It’s the Friday before a long weekend. So in addition to Friday traffic, you have the masses headed on vacation, too.
  • But it’s a normal Friday. Of all the three-day weekends in the calendar, it’s the only one that almost no one extends. So there aren’t many people who get away a day early to ease the traffic.
  • It’s the last nice weekend of the year, for foliage and, often for weather. It’s still a pleasant time to go to Cape Cod, or the Berkshires, or Northern New England before the leaves fall and the temperatures plummet.
  • Not many people stay in town for the weekend. On Patriots Day (Marathon), July 4 (Fireworks), Labor Day, MLK Day and Memorial Day there are parades and ceremonies and the like that people attend locally. No one is celebrating Columbus anymore.
  • Oh, yeah: everyone from New York, Connecticut and Rhode Island wants to get to Vermont, New Hampshire and Maine. So guess where they all go? Massachusetts.
Personally, I’ve sat for two hours to go 10 miles on 128 on this wonderful day. I’ve also had a four hour drive from Springfield to Boston on the Turnpike. And my uncle had a three-hour trip from Providence to Boston, which culminated with him blindly following directions off of the Southeast Expressway on to Mass Ave when informed the Expressway wasn’t moving.
These weren’t due to accidents, but to volume. The system operates at-or-near capacity on a normal day. Add the factors above, and it is pushed way over capacity. Once that happens, everything stops.
But there are some suggestions. First of all, go where you are going later. We have wonderful apps and data and the ability to look at a computer screen and find out how long a trip is going to take. Take a look at Google Maps, or at MassDOT’s traffic map or data stream, and wait it out. As long as you plan to wait it out, you can sit by the river or go for a run and wait until the coast is clear (which should happen by 7 or 8 p.m.). Second, consider back roads, especially further from the city. Much of the congestion comes tourist-types descending on to main highways. People who don’t normally drive the roads don’t know about parallel options, and people who are unprepared for their onslaught get caught up in the hubbub. So if the Pike is a royal mess, try Route 9. If 93 is a parking lot, come through the city. 
The saying goes “if you can’t beat ’em, join ’em.” But that’s stupid. If you can’t beat ’em, either wait patiently, or find a route where they aren’t. Because if you don’t, you too will get to enjoy the Worst Traffic Day of the Year!

Longfellow Bike Count

One of the issues I’ve touched on in the Longfellow Bridge series is the fact that there as no bicycle count done at peak use times—inbound in the morning. The state’s report from 2011 (PDF) counted bicyclists in the evening, and shows only about 100 cyclists crossing the bridge in two hours. Anecdotally, I know it’s way more than that. At peak times, when 10 to 20 cyclists jam up the bike lane at each light cycle, it means that 250 to 500 or more cyclists are crossing the bridge each hour. So these numbers, and bridge plans based on them, make me angry.

But instead of getting mad, I got even. I did my own guerrilla traffic count. On Wednesday morning, when it was about 60 degrees and sunny, I went out with a computer, six hours of battery life and an Excel spreadsheet and started entering data. For every vehicle or person—bike, train, pedestrian and car—I typed a key, created a timestamp, and got 2250 data points from 7:20 to 9:20 a.m. Why 7:20 to 9:20? Because I got there at 7:20 and wanted two hours of data. Pay me to do this and you’ll get less arbitrary times.

But I think it’s good data! First of all, the bikes. In two hours of counting, I counted 463 bicyclists crossing the Longfellow Bridge. That’s right, counting just inbound bicyclists, I saw more cyclists cross the Longfellow in one direction than any MassDOT survey saw in both directions. The peak single hour for cyclists was from 8:12 to 9:12, during which time 267 cyclists crossed the bridge—an average of one every 13.4 seconds. So, yes, cyclists have been undercounted in official counts.

Are we Market Street in San Francisco? Not yet. Of course, Market Street—also with transit in the center—is closed to cars. [Edit: Market Street is partially closed to private vehicles, with plans being discussed for further closures.] And at the bottom of a hill, it’s a catchment zone for pretty much everyone coming out of the heights. They measured 1000 bikes in an hour (with a digital sensor, wow!), but that was on Bike to Work Day; recent data show somewhat fewer cyclists (but still a lot).

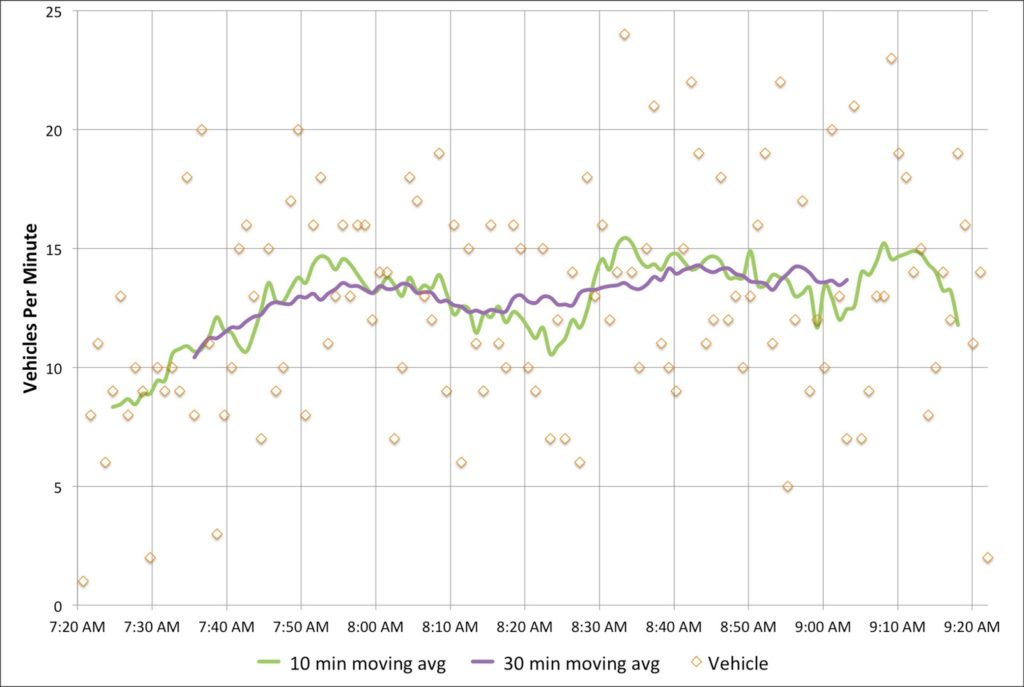
I also counted vehicles (1555 over two hours; 700 to 800 per hour, including three State Troopers and one VW with ribbons attached that passed by twice), inbound pedestrians (about 100, evenly split between joggers and walkers, although there were more joggers early on; I guess people had to get home, shower and go to work) and even inbound Red Line trains (30, with an average headway of 4:10 and a standard deviation of 1:50). I didn’t count outbound pedestrians, or the exact number of people I saw stopping to take pictures (at least three on my little nook of the bridge).

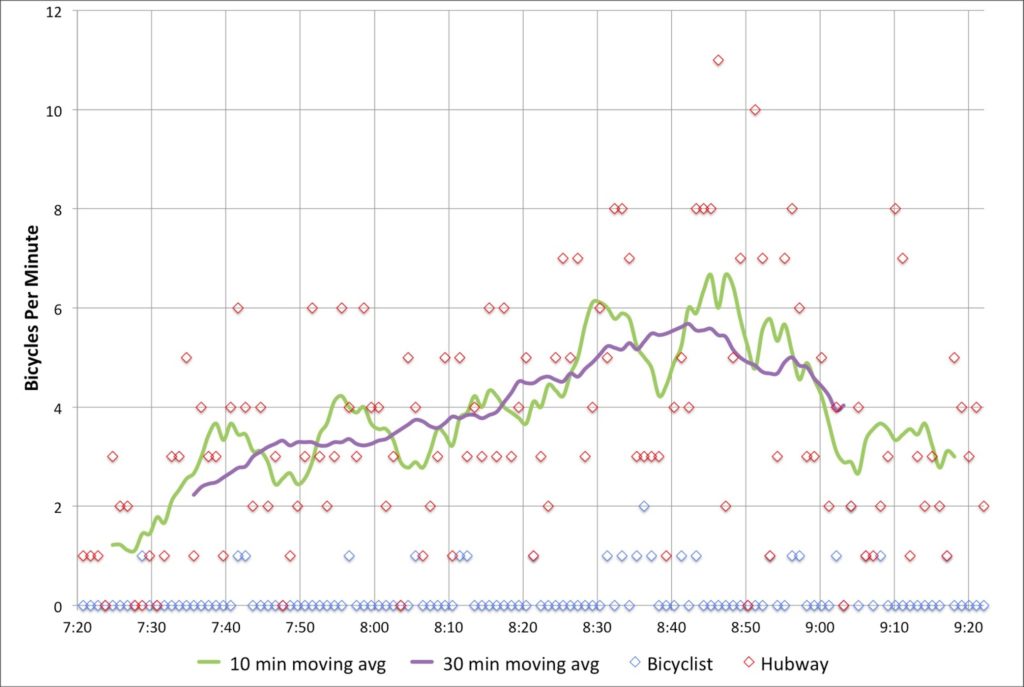
But did you come here for boring paragraphs? No, you came for charts! Yay charts! (Also, yay blogging at 11:20 p.m. when I should be fast asleep. Click to enlarge.)

First, bikes. Cyclists crossing the bridge started out somewhat slow—the moving average for the first 20 minutes was only one or two per minute. But the number of cyclists peaks around 8:40—people going in to the city for a 9:00 start—before tapering off after 9. I’ve written before about seeing up to 18 people in line at Charles Circle which is backed up by these data; the highest single minute saw 11 cyclists, and there were four consecutive minutes during which 36 bikes passed. At nearly 6 bikes per minute for the highest half hour, it equates to nearly 360 bikes per hour—or 10 per 100 second light cycle. Too bad we’re all squeezed in to that one little lane. (Oh, here’s a proposal to fix that.) If anything, these numbers might be low—the roads were still damp from the overnight rain early this morning.

What was interesting is how few Hubway bikes made it across the bridge—only 25, or about 6% of the total. With stations in Cambridge and Somerville, it seems like there is a large untapped market for Hubway commuters to come across the bridge. There are certainly enough bikes in Kendall for a small army to take in to town.

Next, cars. The official Longfellow traffic counts show about 700 cars per hour, which is right about what my data show. What’s interesting is that there are two peaks. One is right around 8:00, and a second is between 8:30 and 9:00. I wonder if this would smooth out over time, or if there is a pronounced difference in the vehicular use of the bridge during these times. In any case, 700 vehicles per minute is not enough that it would fill two lanes even to the top of the bridge, so the second lane—at this time of day, anyway—is not necessary on the Cambridge side.
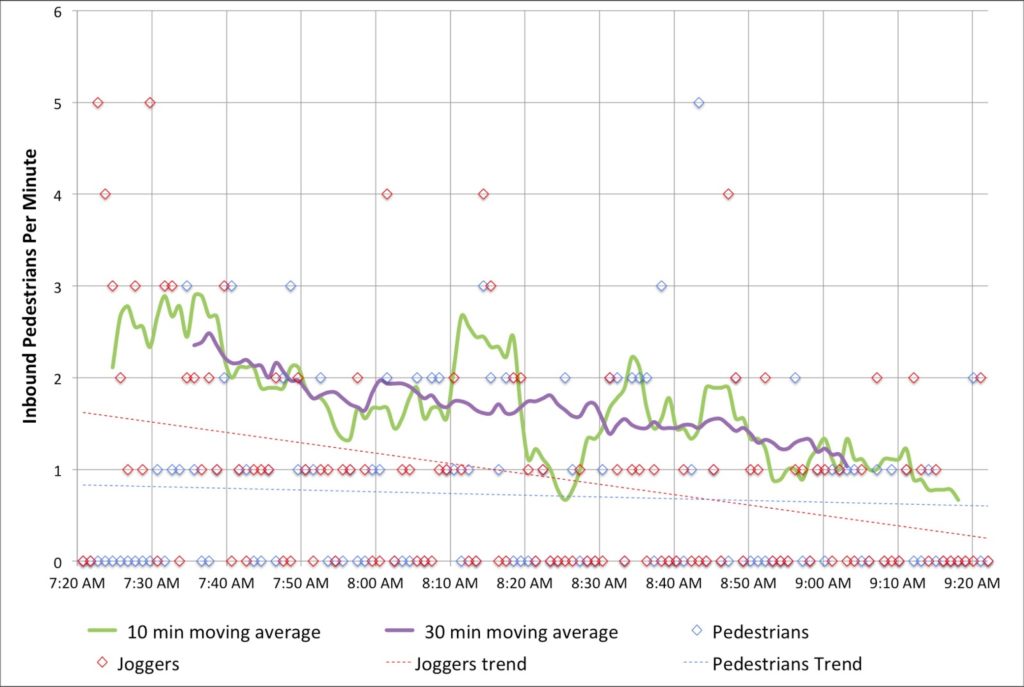
I also tracked foot traffic. I did my best to discern joggers and runners from commuters. Joggers started out strong early, but dwindled in number, while commuters—in ties and with backpacks and briefcases—came by about once every minute. I was only counting inbound pedestrians, and there were assuredly more going out to Kendall. Additionally, I was on the subpar, very-narrow sidewalked side; the downstream sidewalk is twice the width (although both will be widened as part of the bridge reconstruction).
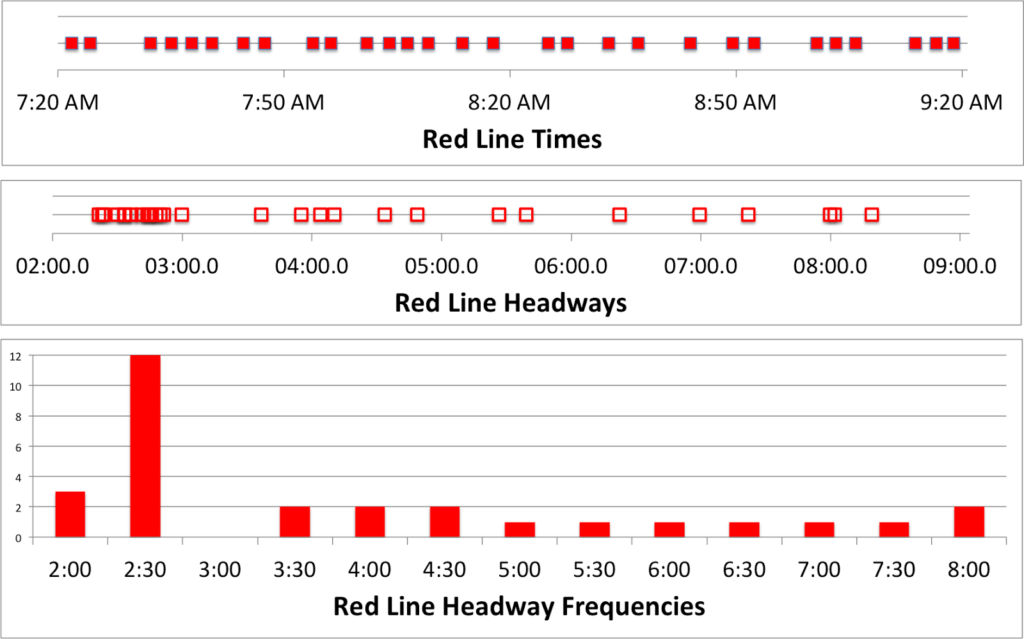
And I counted when the trains came by. In the time that 2500 bikes, pedestrians and cars crossed the bridge, 30 trains also did. Of course, these were each carrying 500 to 1200 people, so they probably accounted for 25,000 people across the bridge, ten times what the rest of the bridge carried. Efficiency! The train times are interesting. The average headway is 4:10, with a standard deviation of 1:58. However, about half of the headways are clustered between 2 and 3 minutes. That’s good! The problem is that the rest are spread out, anywhere from 3:30 to 8:30! Sixteen trains came between 7:20 and 8:20, but only 14 during the busier 8:20 to 9:20 timeframe. I wonder if this is due to crowding, or just due to poor dispatch—or a combination of both.

In any case, what Red Line commuter hasn’t inexplicably sat on a stationary train climbing the Longfellow out of Kendall? Well, after watching for two hours, I have an answer for why this happens!  It is—uh—I was lying. I have no idea. But I say no fewer than a half dozen trains sit at that signal—and not only when there was a train just ahead—for a few seconds or even a couple infuriating minutes. I was glad I wasn’t aboard.

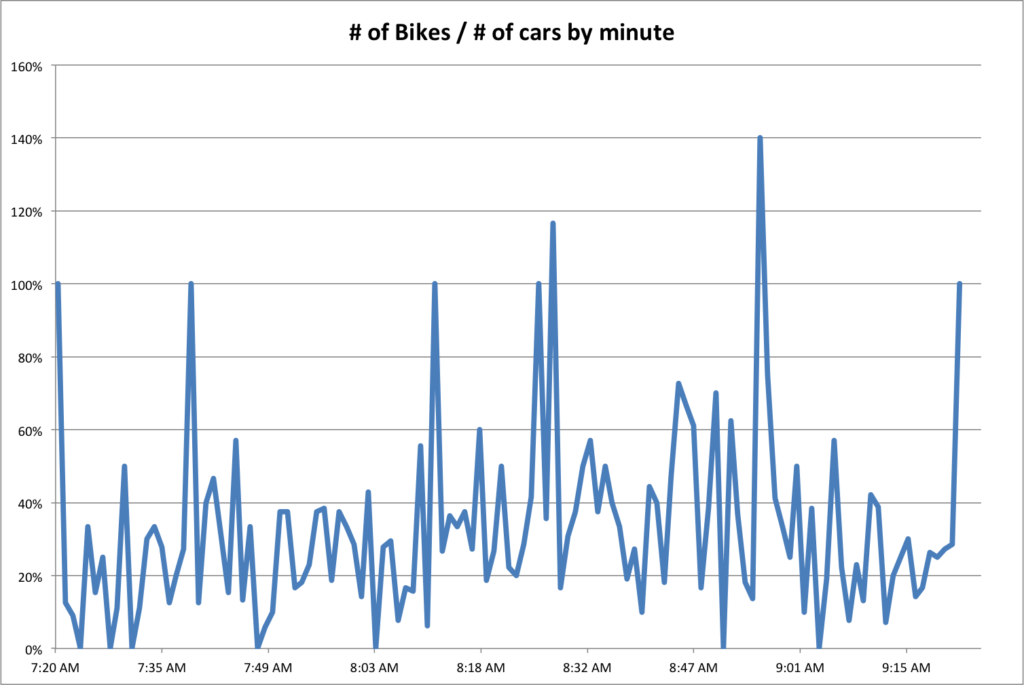
Finally, we can compare the number of bikes as a percentage of the number of cars crossing the bridge each minute. Overall, there were 30% as many bikes as cars. But seven minutes out of the two hours, there were more bikes across the bridge than vehicles. Cars—due to the traffic lights—tend to come in waves, so there’s more volatility. Although bikes travel in packs, too. Anyway, this doesn’t tell us much, it’s just a bunch of lines. But it’s fun.

6000 Bikes Per Hour

A few weeks ago, a sea of cyclists pedaled (slowly) through Cambridge. The city has two annual recreational rides, complete with police escorts, where hundreds of bicyclists take to the streets. I took a video of the procession through Inman Square and it got lost in my phone for a while, but recently resurfaced and made it to Youtube.

It’s not that much to watch, unless you really like watching chatty cyclists at low speed, but it is illustrative how space-efficient cyclists are. The video lasts a bit shy of three minutes, and for about 2:30 of that (give or take) the swarm of cyclists passes by. I happen to know that there were about 250 (actually 258, according to the website). But let’s use round numbers—even at low speed there were 100 cyclists passing by per minute.

Which is extremely efficient.

On a freeway, a lane of traffic can only carry at most 2000 vehicles per hour—beyond that the roadway devolves quickly in to gridlock (and the number of vehicles drops). Yet one lane of bicyclists can accommodate three times as many people—you’d have to have three or four people in every car on a freeway to have the same level of service. Want to fill buses? Fine, but you better be able to get a full bus through every 30 seconds to match a lane of cyclists. Rail can surpass this capacity—at rush hour the Red Line in Cambridge peaks over 10,000 people per hour, and some lines in New York go past 20,000—but you need a bit more infrastructure to run such rail routes.

Since bicycles take up far less space than vehicles, they use road space much more efficiently than vehicles. Even if a rate of 6000 per hour necessitates a police escort, it’s still a testament to the efficiency of the bicycle.

Longfellow Bike Traffic

I usually cross the Longfellow Bridge by bicycle around 7:30 a.m. It’s before the peak of the rush hour, and while I’m not alone on two wheels, it’s not too crowded. Twice this week, however, I’ve been crossing the bridge eastbound around 8:30. And both times, when I’ve reached the light at the end of the bridge, there was a veritable traffic jam of bicyclists, with a lineup of 10 two-wheelers waiting to turn right on to Charles or go straight up Cambridge. We’ve had a long string of great cycling weather (sunny, dry and cool), Hubway is in full swing, and we’re recovering from the marathon fiasco. So there are a lot of bicyclists.

From this small sample, I’m going to make some big extrapolations. I sleuthed out the traffic counts from the intersection from a Red Line / Blue Line connector document (pdf) and sussed out that it is a 100 second light cycle—that it repeats 36 times per hour. Assuming a constant ten cyclists per light cycle for an hour, this would equate to 360 bicycles across the Longfellow in an hour. Is this a big number? I think so. Here’s why:

  • This is more than half as many bicyclists as vehicles. Peak morning eastbound car traffic is 707 vehicles per hour. Now, the Longfellow is mainly a transit bridge, and at peak hour the Red Line carries more than 10,000 vehicles. Plus, vehicle traffic decreases (as it has in the Kendall area) and bicyclists’ numbers continue to climb.
  • Bicyclists have a sub-optimal facility on the Longfellow. In other words, the bike lane kind of sucks. It’s bumpy, narrow and squeezes down at the Boston end of the bridge (although it is better-paved there). The future lane will be a bit wider, although to preserve two lanes of inbound traffic it won’t have a buffer built in. Still, it won’t be as squeezed as it is now. (MassDOT pdf)
  • This illustrates the importance of keeping the bridge open to cyclists during construction, as is the plan. Even as traffic is limited to one direction, bicyclists and pedestrians will be allowed to cross the bridge in both directions. With hundreds of bikes per hour, it’s a vital link in the regional bicycle infrastructure.
  • Finally, the roadway is currently more efficient at carrying bicycles than motor vehicles. 707 vehicles use two lanes per hour, at a rate of 354 per hour. Bicycles use one lane, and there are (by my assuredly crude calculations) 360 bicyclists. But wait! Aren’t traffic lanes a lot wider than bike lanes? Yes. 360 bicyclists traverse the Longfellow in only 5 feet of bridge width, at a rate of 72 vehicles per foot. The 707 cars have 24 feet of bridge width, a rate of only 29 vehicles per foot. Even if we assume 1.25 people per car, bicycles are still twice as efficient at transporting people. (And, yes, the Red Line inbound, in 14 feet of bridge width, transports more than 10,000 people, making it ten times as efficient as the bike lane.)
Of course, the bike lane is certainly not at capacity (neither are the vehicle lanes; although the Red Line is quite crowded). Leaving two lanes for vehicular traffic in the new bridge design is contentious, and a single-lane design with a wider, buffered bicycle facility—akin to the outbound side of the bridge—would do more to encourage cycling. Even narrower lanes—and a wide bike lane—would help cyclists (and slow speeding motorists, as well). But even without that encouragement, bicyclists don’t seem to be shunning the Longfellow.