Measuring the externalities of late night transit

On the same day that the future of the MBTA’s late night service was reportedly imperiled, the Commuter Rail operator Tweeted that its trains would not be held for the end of the Garth Brooks concert slated to begin at 10:30 p.m. There was no such Tweet necessary from the core bus and subway services, because the Friday concert would certainly end in time for the late subway trains which would depart downtown around 2:30.

Which is a big deal. Concerts of this sort are permitted by the city of Boston, and without late night T service, they probably would have not occurred at all. It’s not every night that a popular act will play for the first time in nearly two decades in Boston, but the possibility of scheduling later shows brings tens of thousands of extra visitors to the city and whether they ride transit or not, they support the local economy.

Are all of the concert-goers discretionary visitors? No. Certainly some would have come downtown and taken advantage of nightlife if there were not this concert. But many do. The nearest venues on Brooks’s current tour are in Pittsburgh and Buffalo, so this is a regional draw; and may even attract some fans from abroad who would come to Boston for the show. There are 15 million people in New England, and only about one in six of those live within a late-night MBTA service corridor (and the Garth Brooks demographic is probably less likely to live in town). But others may book a hotel, or arrive by car for dinner, and then go and see the show.

How much is a concert of this type worth? Let’s throw around some numbers (and, yes, these are all guesstimates, yell at me in the comments if I’m off by an order of magnitude but not if I’m off by 25¢):

  • The TD Garden holds about 20,000 people for concerts. The price for each ticket for these shows is $57, and according to this site, about $15 of that goes towards running the facility. That’s $300,000. Add to that $10 of food and beverages purchased by each concert-goer, another $200,000. Let’s assume that half of this total goes towards staffing and another 10% towards state and local taxes. That’s $300,000 for the local economy.
  • What about parking? Let’s say half of the people coming to the concert park downtown, and pay an average of $10 to do so (some people will find free meter parking—and may use the MBTA to get to and from it—while some will pony up $40 to park at the Garden). That’s another $100,000, with about 7% captured as sales tax (and if Boston had additional parking taxes like many other cities, it could capture more).
  • But those are the direct costs. Let’s say that 1000 people at the concert “make a weekend of it” and book a hotel room in town at $200 per night. That’s another $200,000 (taxed at 14.45%). They’ll have $100 worth of meals, too, so there’s another $100,000. A good number (half?) of people will come in early before the concert and go for dinner or a beer (or both), spending, say, $25 per person, or $250,000; if the concert lets out at 12:30 a.m., some may take advantage of late night service and have a beverage afterwards as well.
  • And late night ridership? Let’s say 5000 people take the T to the concert, and 1000 of those park at an outlying terminal, and half of these people already have a monthly pass. The numbers aren’t huge, but it still accounts for $5000 in additional fares and $4000 in parking fees. Not huge, but not nothing.

Let’s add this up. You get about $1,150,000 in additional local spending. With sales, hotel, meal and payroll taxes, local and state governments can recoup about $100,000 directly in sales taxes. And the T gets about $10,000 in additional fares. These concerts won’t occur every weekend, but even if there are 10 such events per year, it would pump an extra $11 million in to the local economy, of which at least $1 million would reach tax coffers, and an extra $100,000 for the T. The total cost of running late night service is not offset by this, but these events are only feasible because of the extra service.

Then there’s the real game-changer: are acts more likely to come to Boston if they can perform two shows per evening? For a busy venue like the Garden (with the Bruins and Celtics and other events like Mice on Ice), being able to squeeze multiple events per day allows an act to open for only two or three days but have five or six shows. (It’s no coincidence that the Garth Brooks concert falls during the NHL All-Star break; shows don’t materialize out of thin air, although they do get set up overnight.) If you get a couple extra shows to play Boston which otherwise would not, then you’re getting multiple shows on nights the Garden might otherwise sit dark.

This past summer, I participated in a hackathon that showed parallel results over a longer time range: late night T service seemed to increase ridership earlier in the evening and longer-distance taxi fares later on. But we didn’t examine the potential for late night events to boost the local economy. If the T looks towards cutting service, it really should make sure to look at events like this which benefit from the availability of late night service (even if not that many people use the service to get to the event). Not doing so may be penny-wise and pound-foolish.

Don’t use bus routes to subsidize malls …

especially if the mall isn’t the final stop on the route.

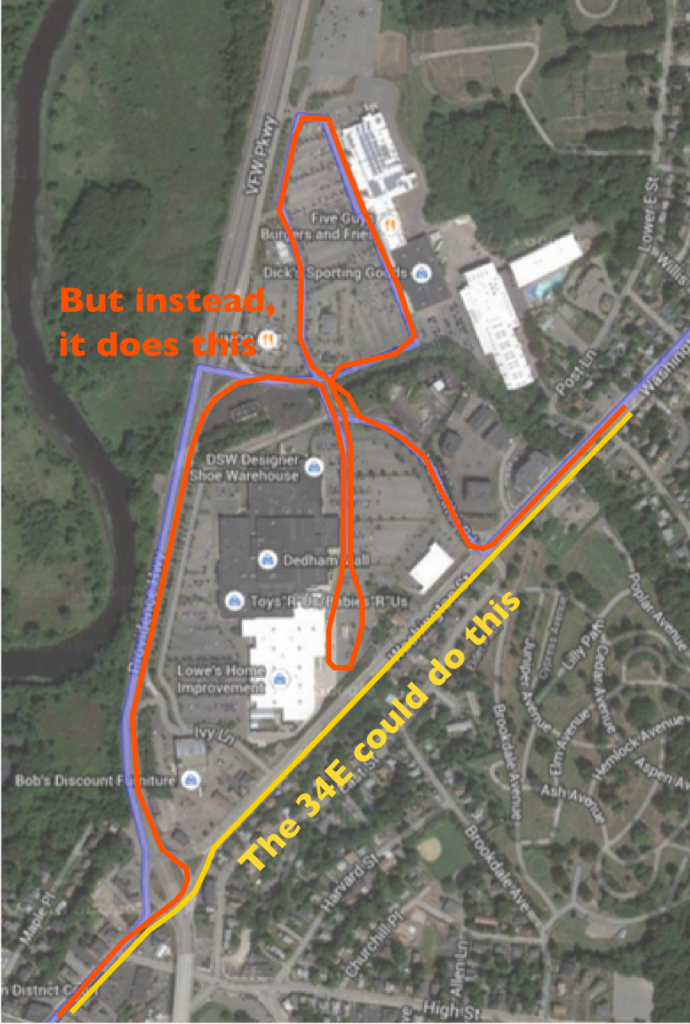
I recently had the pleasure of riding the entire route of the 34E, one of the MBTA’s longest bus routes. The route starts in Walpole Center, makes a beeline to Washington Street (which extends from Boston to Providence) and runs in a straight line to Forest Hill Station. A straight line, that is, except, for a bizarre figure-eight loop through the Dedham Mall. The loop-the-loop to access the mall unnecessarily lengthens the route, costs the T money, costs passengers time, and subsidizes private development, all to service the front door of an auto-centered development.

Instead of continuing on Washington Street, the mall loop takes 8 or 10 minutes as the bus leaves the street, navigates no fewer than eight stop signs and traffic signals, makes two separate looped turn-arounds and traverses the same intersection three times. The route is scheduled for a full hour for the 14 mile trip from Walpole to Forest Hills, so the detour through the mall accounts for 13 to 16% of the total run time, all to serve two stops (out of more than 80 total on the route) which would otherwise require a 2 to 5 minute walk.

In other words, for riders wishing to get to the Dedham Mall, it would likely be faster if the bus ran straight on Washington Street and they got off and walked in to the mall, rather than taking a circuitous route to be dropped near the door. And for everyone else, it would save 8 to 10 minutes each way of not riding through the mall parking lot.

I rode the route on a weekday evening a few days before Christmas. This should have been a high water mark for people using the 34E to get to the mall. While my bus was full—there were probably between 45 and 50 passengers on board at any given time (and probably 70 or more served along the route)—only two or three got on or off at the mall. So, in order to serve this small number of passengers, the rest of the bus had to loop in and out and in and out of endless parking lots and driveways, because front-door service to the mall is apparently required.

From HumanTransit.org

What is particularly irksome is that in this case—and it’s not isolated, but, at least in Boston, perhaps the most egregious (the 350 serves the Burlington Mall with a similar detour, but much closer to the terminus of the route, meaning that many fewer passengers are inconvenienced by the route’s detour)—is that anyone who rides the bus past the mall has their trip dramatically lengthened (how dramatically? 18 minutes a day, five days a week, 50 weeks a year adds up to 75 hours of extra time on the bus annually). Jarrett Walker talks of “being on the way” and the mall is decidedly not; the 34E takes what should be a straight-line transit trip and degrades it to a mall circulator, despite the thousands of passengers who ride the bus daily.

In addition, running service via the mall requires several hidden subsidies which degrade service and provide a perverse incentive for people to drive instead of use transit. This one, in turn, further subsidizes the car-centric mall over pedestrian-oriented business districts, several of which are served by this route. There is also the direct subsidy to businesses at the mall. If I open a store on a street near an existing transit line, I would not (and should not) expect the transit agency to reroute the transit line to provide a stop at my front door. Yet we provide this service to the mall.

This subsidy can be quantified, in fact. The T doesn’t break down service between the 34E and the 34, but let’s assume that slightly more than half the passengers on the route are carried by the 34E (looking at the total number of vehicles on the route at different times of day)—or about 2500 passengers. The route costs $3.09 per passenger to operate (66¢ average bus fare paid plus $2.43 subsidy), or a total cost per day of about $7725. If we calculate 15% of this approximately $1150, meaning that over the course of a year—even given lower service levels on weekends—the cost to serve the mall is well north of $300,000 per year. [Update: these numbers may be somewhat lower given that morning service—before the mall opens—and some peak evening rush hour trips do skip the mall.]

Here’s another way to look at this: currently, the 20 minute evening headways on the 34E requires 6 buses running the route in about (or just under), each bus makes a round trip in two hours. If the run time were reduced to 51 minutes by omitting the mall, the same six buses could make seven round trips, reducing headways and, thus increasing capacity on the route. If you could get it to 50 minutes, the same headways could be maintained with 5 buses, which would save 1/6 of the route’s operating cost while providing the same service. But, instead, we provide service to the mall, at the expense of everyone who isn’t the mall.

What to do? Make the mall subsidize the route—yes, to the tune of $350,000 per year—or have them build an ADA facility from Washington Street to the mall. The extra cost of running this route in to the mall for 10 years could buy a very nice set of bus shelters, crosswalks and a ramp from Washington Street to the mall’s front door. Another option would be to run the 34—which ends its route nearby—to the mall, instead of putting this joggle in the middle of the 34E. While it might not have the same cost savings, it would at least not have the effect of costing thousands of passenger hours each day. Or, abandon service to the mall all together. Malls are dying, anyway, and it should not be the business of public transit agencies to help prop them up.

The 70 bus is just … bizarre

The Boston Globe carried a story this week about Watertownies (Watertownians?) who want better MBTA bus service. Watertown is one of the furthest-in, densest communities in the Boston area with only bus service, and residents want improvements. Residents of Watertown are asking for more buses at peak hours (the T doesn’t have the vehicles to provide this), faster service (perhaps they should invest in bus lanes) and better services overall.

There is particular sentiment about improvements along the Arsenal Street corridor, which is served by the 70 bus. And the 70 bus is one of the most interesting routes in the MBTA system, and one which could certainly stand to be improved. In fact, it’s bizarre, a compilation of several separate routes, and it seems to have taken place haphazardly. The route is one of the longest in the system, and its headways are such that while it may operate on average every 15 minutes, there are frequently much longer wait times, leading to crowding, bunching and poor service levels.

The T claims to want to study the route, but can’t come up with the $75,000 to do so. We here at the Amateur Planner will provide a base analysis (for free), in hopes that it can be used to improve service on this route. One concern in the article is that “There are people waiting 40 minutes for a bus that’s supposed to run every 15 minutes.” Unfortunately, this is not an isolated occurrence based on equipment failures and traffic, but rather the fact that the 70 bus route is set up with uneven headways which mean that a bus which is supposed to come every fifteen minutes might actually have schedule gaps much longer. It’s a complicated story, but fixing the 70 bus should be a top priority for the MBTA.

I. The Route

The 70 bus was, like most bus lines in Boston, originally a streetcar line, much like the 71 and 73, which still run under the wires in Watertown. When the 70 was converted from streetcar to trackless in 1950 and from trackless to diesel ten years later, it was much like any other MTA route. It ran along an arterial roadway from an outlying town center (Watertown) to a subway station (Central), a similar distance as, say, the 71 or 57 (a car line until 1969) intersecting it in Watertown Square. But after that point, it’s fate diverged. Most other lines continued to follow the same routes they always had. The 70, however, absorbed services of the Middlesex and Boston, leading to a much longer route. As time went on it was extended to Waltham (in 1972, combining it with the M&B Waltham-Watertown line) and then to Cedarwood. The 70A routing was only merged in to the route in the late 1980s when through Waltham–Lexington service was cut, adding a third separate line to the 70/70A hodgepodge. (More on the history of this—and every other MBTA route—here.)

It now extends—depending on the terminus—10 to 14 miles from Central Square in Cambridge to nearly the Weston town line. Along the way it serves several distinct activity nodes: Central Square in Cambridge, Barry’s Corner and Western Avenue in Allston, the Arsenal Mall, Watertown Square, Central Square in Waltham, and the outlying branches. While these nodes fall in a straight line, it creates a bus route with several loading and unloading points and heavy use throughout the day. This is not a bad thing—except that the line is poorly scheduled and dispatched, so that it effectively provides far less service than it could.

II. The Schedule


To its credit, the MBTA has very few split-terminus routes. (In many cities, split-terminal routing is the norm, as one trunk route will branch out to several destinations. Since MBTA buses generally serve as feeders to rapid transit stations, it is far less prevalent.) The 34 has short-turn service (the 34E) and the 57 has some short-turns as well. A few other routes have some variations (the 111, for example) but few have the sort of service that the 70/70A has. The 70A is particularly confusing inasmuch as the morning and afternoon routes run separate directions, to better serve commuters but to the detriment of providing an easy to understand schedule. It it almost as if the T has put all of its annoying routing eggs in one basket. Or, in this case, in one route.

The issue is that while there are two routes which are generally separately scheduled, for the bulk of the route, from Waltham to Cambridge, the operate interchangeably as one. For someone going from Waltham to Cambridge or anywhere in between, there should be no difference between a 70 and 70A. If there are four buses per hour, there should be one every fifteen minutes. For those visiting the outside of the route, the buses will be less frequent, but for the majority of the passengers, it wouldn’t matter.

Except, the route doesn’t work this way.

It seems that the 70 and 70A are two different routes superimposed on each other with little coordination. This often manifests itself in buses that depart Waltham—and therefore Watertown—at nearly the same time, followed by a gap with no buses. If you look at nearly any bus route in Boston, it will have even (or close-to-even) frequencies during rush hours. Some—the 47, for instance—may have a certain period of time with higher frequencies to meet demand. But even then, the route quickly reverts to even headways.

This is not the case with the 70 bus. If you are in Watertown Square traveling to Cambridge on the 70, there are 16 buses between 7 and 10 a.m. This should provide service every 10 to 12 minutes. Here are the actual headways (the 70As are bolded):

16  7  9  9  6  13  8  12  8  24  0  24  5  15

Anyone want to point out the problem here? The headways are completely uneven. The route is frequent enough that it should be a “just go out and wait for the bus” but it is completely hamstrung by poor scheduling. The initial 16 minute headway will carry a heavy load—nearly twice the headway of the next trip. The next trip will operate with half the load, and more quickly, catching up on the heavily-laden bus ahead of it. Later in the morning it gets worse: headways inexplicably triple from 8 minutes to 24, followed by two buses scheduled to leave Watertown at exactly the same time. (In fact, one is scheduled to overtake the other between Waltham and Watertown.) This is followed by another long service gap. Miss the two back-to-back buses, and you’re waiting nearly half an hour. This makes no sense.

And it’s not just the mornings. Midday headways are just as bizarre. When traffic is at a minimum and the route should be able to operate on schedule, headways range from 10 to 25 minutes. There are at least three buses each hour (and usually four) yet there are long service gaps—the effective headway is nearly half an hour when it could conceivably be 15 minutes. It’s obviously not easy to schedule a route with two termini, but the vagaries of the schedule mean that missing a bus may mean a wait of nearly half an hour, only to have two buses come with ten minutes of each other. And it’s not like these buses are empty, either. They serve the bustling town centers in Waltham and Watertown, and the Arsenal mall area stops regularly see ten or more passengers per trip. Yet they are subjected to a bus that comes at odd times—not one that is really reliable.

For a time during the evening rush hour, the T actually manages to dispatch an outbound bus every 10 minutes. But overall, most of the weekday schedule is a range of times which have no relation to each other, and mean that the route provides a much lower level of service than it could. (Intriguingly, Saturday service on the 70 is provided on an even 10 minute headway for much of the day; it’s a shame this schedule can’t be used on weekdays, too.)

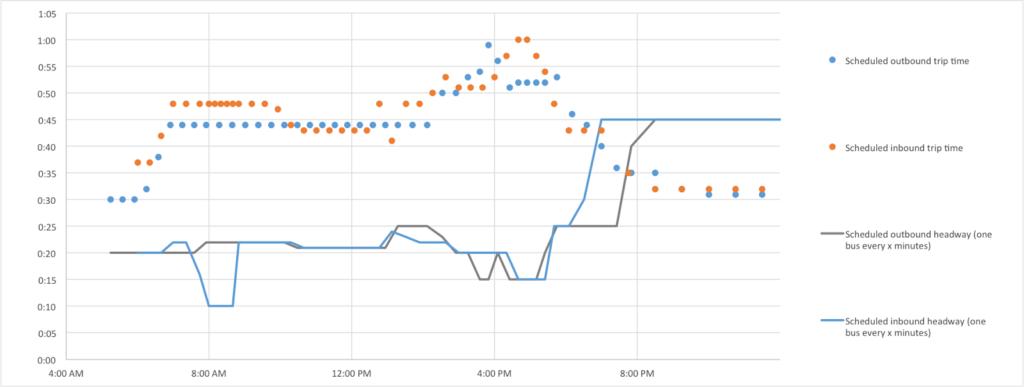
I’ve been experimenting recently with graphically displaying route schedules. It shows scheduled route times as points, and headways as lines. Time of day is on the x axis, frequency and running time on the y axis. Here, for example, is the 47 bus:

Notice that while there is a major service increase during the AM rush hour, the headway lines are generally flat during different service periods during the day.

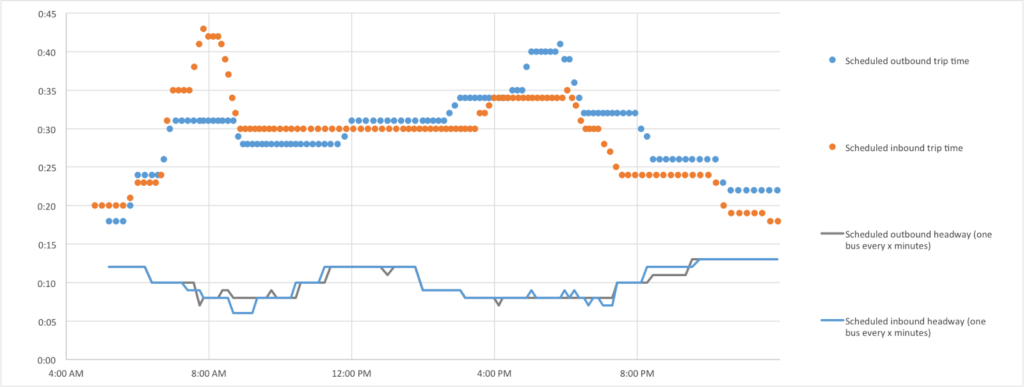
Another example is the 77 from Harvard to Arlington:

The 77 is a very frequent bus which sees 8 to 12 minute headways throughout the day. There is some minor variation at rush hours—and longer scheduled trip times at those times—but variations are minimal, and when headways change, they do so by only a couple of minutes.

Most bus routes have this sort of chart. Trip times may vary, but headways do not change drastically during the day.

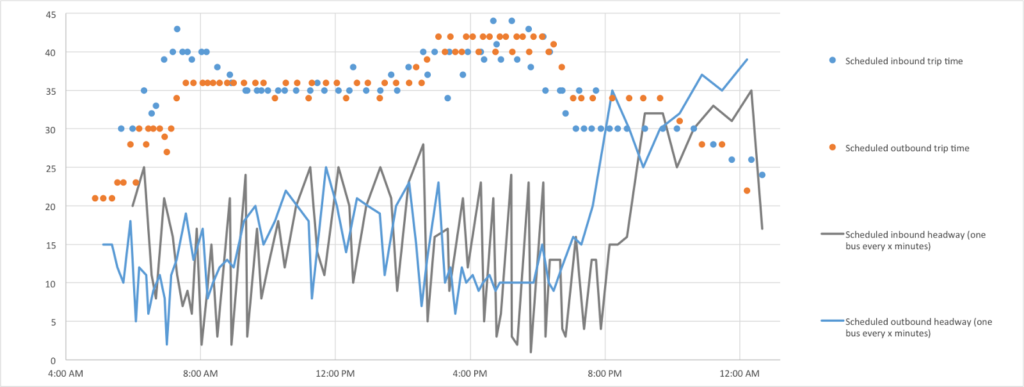
Now, here’s the 70 from Waltham to Boston:

This is chaos! Instead of a flat line, the headways bounce around uncontrollably, ranging from one or two minutes (this is from Waltham, so the 0 minute headway in Watertown Square is slightly different) up to nearly half an hour. If you go wait for a bus you may see two roll by in the span of five minutes, and then wind up waiting 25 minutes for the next. It’s only during the evening rush hour (the flat blue line) that there is any order to the schedule; even late at night headways bounce around by five minutes or more.

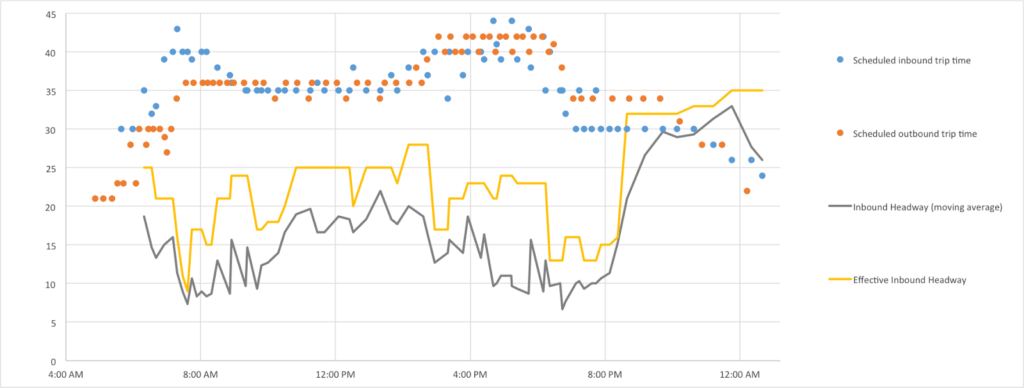
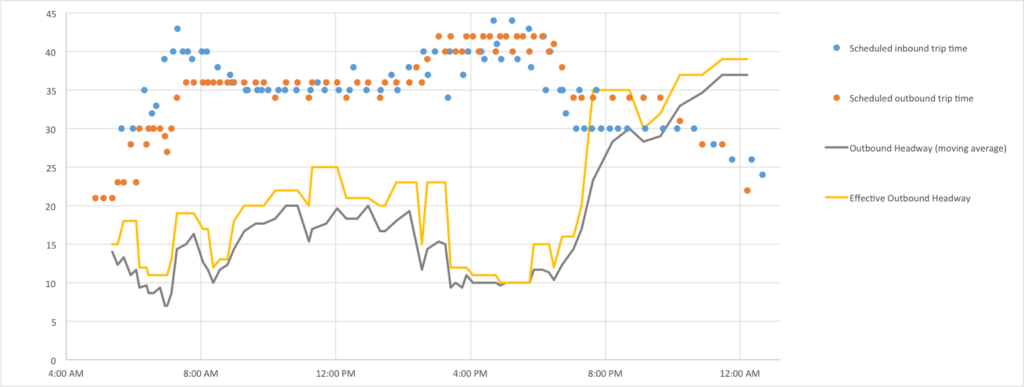
Another way to visualize these data are to look at the average headway versus the effective headway. Here, the gray line shows the moving average of three headways, which smooths out some (but not all) of the variability shown above. However, the yellow line is more important: it shows the greatest of the three headways, which is the effective headway: if you go out and wait for a bus, it’s the maximum amount of time you may wind up waiting. Here’s the inbound route:

The average headway for bus is generally about 10 minutes at rush hours, and 15 to 20 minutes during the midday, which is not unreasonable for this type of route. However the effective headway is much worse. It is more than 20 minutes for much of the day—and often eclipses 25 minutes. For most routes, the average and effective headway would be equal (or close to it). For the 70, the effective headway is sometimes double the average.

The outbound chart shows what is possible. From 4:00 to 6:00 in the afternoon, the average and effective route are nearly even—this is when buses are sent out on equal headways (and this is what the entire day would look like for most routes). However, during much of the rest of the day, the headways are less sensible. It should be possible to operate a service every 20 minutes or better, but there are often 25 minute waits for the bus, despite the fact that the two routes share an outbound departure point in Central Square.

All of this does not align with the T’s stated policy. According to the MBTA service deliver policy, “passengers using high-frequency services are generally more interested in regular, even headways.” This is the practice for most routes, but not for the 70.

III. What can be done?


As currently configured, the 70’s headways are particularly hamstrung by the 70A. Not only is it longer and less frequent than the Cedarwood route, but it’s outer terminus is not even a terminus but instead a loop (with a short layover), so the route is practically a single 25-mile-long monstrosity beginning and ending in Central Square. Without a long layover and recovery point, the route is assigned two buses midday and can’t even quite make 60 minute headways: the 10:10 departure from Cambridge doesn’t arrive back until 12:11, and that’s at a time of day with relatively little traffic!

It’s also not clear why the 70A needs to run to Cambridge. It is a compendium of three routes—the original Central–Watertown car route, the Middlesex and Boston’s Watertown–Waltham route and the Waltham portion of the M&B’s Waltham–Lexington route. This is a legacy of the 1970s—and before. It would seem to make much more sense to combine the 70A portion of the route with one of the express bus routes to downtown Boston, and run the 70 as it’s own route with even headways.

There seem to be two reasonable routes to combine the 70A with, each of which could probably provide better service with the same number of vehicles: the 556 and the 505. The 556 provides service from Waltham Highlands (just beyond the Square) to Downtown Boston at rush hours, and to Newton Corner at other times. It has an almost-identical span of service to the 70A and operates on similar headways (30 minutes at rush hours, 60 minutes midday). Instead of running all the way in to Cambridge, 70A buses could make a slight diversion to serve Waltham Highlands and then run inbound to downtown. Currently, the 70A is assigned five buses at rush hour, and the 556 four. It seems that using two of these buses to extend the 556 to North Waltham would easily accommodate 30 minute headways, freeing up three buses to supplement service on the 70. During the midday, one bus could provide an extended 556 service between North Waltham and Newton Corner (where connections are available downtown), and it might be possible to extend run 60 minute headways between downtown and North Waltham with just two buses, allowing the other to supplement service on the 70, or allow for transfers to the 70 and Commuter Rail in Waltham and express buses in Newton Corner.

The other option would be to extend the 505. The 505 is currently a rush hour-only bus, but its span of service matches that of the 70A at either end, it is only from 10 until 3 that it provides no service. The simplicity with the 505 is that it’s current terminus is in Waltham Square, so it would be a simple extension to append the 70A portion to the route. The 505 currently runs very frequently in the morning with 10 buses providing service every 8 to 9 minutes, and has 7 buses running every 15 minutes in the evening. If every third bus in the morning and every other bus in the evening were extended to North Waltham, it would provide the same level of service as the 70A, but with direct service downtown. Midday service would be more problematic, as it would require two buses to operate, and additional vehicles would be necessary to supplement the loss in service on the 70 (although the T has a surplus of buses midday, so while it would require extra service time, it would not incur new equipment needs).

Either of these solutions would allow for 10 vehicles to provide service on the 70 route at rush hour, and they could be dispatched at even intervals during that time. With recovery time, the roundtrip for the 70 at rush hour is less than 120 minutes, so with ten buses it could easily provide service every 12 minutes, and perhaps be squeezed down to every 10 minutes with faster running time on the shoulders of rush hour. If every other trip was short-turned at Waltham, 10 minute service would be possible, with service every 20 minutes to Cedarwood. And the headways would be even—no more 20 minute waits in the middle of rush hour. Transfers could be made at Waltham for 70A patrons wishing to go to Watertown or Cambridge. During the midday, similar even headways of 15 or 20 minutes could be offered—no more long waits for a crowded bus with an empty one right behind.

Over the years the 70/70A has been cobbled together from a number of routes, and this has hobbled the efficacy of the route. While the exact scheduling of the route has to take in to account many other factors (pull outs and pull ins, union rules, break times, terminal locations and the like—and as someone who recently helped create a route plan for a very short route, I can attest there is more to route planning than meets the eye), it would be hard to make it any worse than it is now. With some creative thinking, the T should be able to provide better service for everyone who takes the 70 bus without expending any more resources, and should be able to increase the effective capacity, and make it a better experience for its customers.

The next person to say “The same as 1897” …

Every so often, someone knocks the MBTA. I know, I know, it’s shooting fish in a barrel. But sometimes you hear that the T built the first subway in 1897, and hasn’t made any real improvements since. (I’m looking at a certain “disruptive” transit service here: “Between 1897 and right now, there’s been some marginal improvements in how service is delivered to move massive amounts of people throughout a city.”) In 1897, the underground transit in Boston was composed of streetcars. Mostly short streetcars. Here’s the article about the first streetcar through the tunnel: a car from Allston via Pearl Street. Here’s that streetcar (or one like it): a 29-foot car. Back then, a parade of 25-to-30 foot vehicles (most of them just eight feet wide) plied the subway. It was better than the gridlock at the surface, but didn’t have a huge capacity.

By 1901, the Main Line Elevated operated first through the current Green Line tunnel, and by 1908 through its own tunnel. These ran four-car trains of 65-foot cars that were 9 feet wide—still narrow, but much larger than the 1897 cars.

In 1912, the Cambridge-Dorchester tunnel (The Red Line) opened in 1912, and the Orange Line cars had proved inadequate for the crowds, so the T opted bigger. These cars were 69 feet long and 10 feet wide, triple the size of a streetcar one level up at Park, but operating in four car trains. The tunnels were wider too, with fewer curves, allowing faster operation. In 15 years, there were trains an order of magnitude larger than the first iteration.

(A similar thing happened in New York: the IRT cars—in 1904—were built to approximately the size of the Orange Line fleet, by the time the BMT built their tunnels ten years later, they were using Red Line-sized cars.)

But let’s go back to the Green Line. It took a bit longer, but the Green Line trains grew by an order of magnitude, too. By the 1940s, they were running three-car trains of PCCs, 47 feet long and more than 8 feet wide. In the 1970s, the first articulated vehicles showed up, and current Green Line trains are 8’8″ wide, and 74 feet long. And they operate in three-car trains. That’s 222 feet long—quite a bit longer than 29 feet—and, overall, nine times as big. It took some time—three car trains have only started running recent years—but the Green Line has improved capacity an order of magnitude, despite the 115-year-old infrastructure.

Oh, right, in 1897 (and 1997) you paid with a coin, now you pay with an RFID card. And sometimes the trains even have air conditioning! But that’s another story.

In other words, knocking rapid transit for “marginal” improvements in the last 115 years isn’t disingenuous: it’s wrong.

The new Blue Book is out

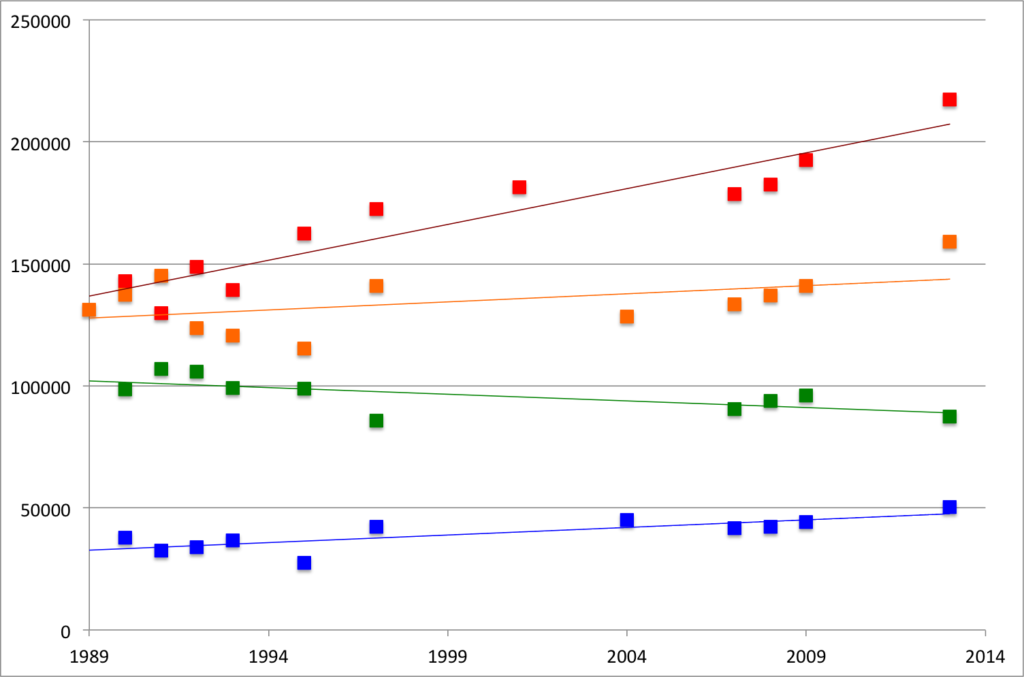
Every few years, the MBTA publishes the Blue Book. It is a compendium of data, neatly packaged in a PDF format. (It would be nice if they published a Blue CSV, but that’s asking a lot of a public transit agency.) I haven’t had much time to play with it, but did download the data for the core subway lines, to compare 2013 to 2009 (the last Blue Book) and before.

This shows data for each subway line (N.B.: it only shows subway boardings for the Green Line) for the past 25 years. The Red, Orange and Blue lines all grew by 13% since 2009, and compared to their lowest count over the past quarter century, they are up 67%, 38% and 82%, respectively. All three lines saw their highest ridership in 2013. If the trains seem crowded, it’s because they are carrying significantly more riders now than they were just a few years ago.

Then there’s the Green Line. It seems that ridership there is flat, but I haven’t had a chance to look at the branches. It might be due to it’s slow speeds, arduous boarding process, arcane rules, lack of traffic priority or a combination of these factors. Or it could be that it’s already basically at capacity, at least as currently configured.

I’ll have more analysis—including station-by-station counts (very variable) and bus routes (they’re growing)—in the coming days.

Red-Blue connector: think outside the tunnel

We recently wrote about the obscenely inflated cost of the Red-Blue Connector. And while the underground costs are certainly inflated, it still involves building a tunnel underground, in loose fill, under a busy street, and then building connections in to an existing station. It would still involve months- if not years-long lane closures, massive utility relocation, and underground station construction. It might be heretic to say so, after Boston has mostly removed above ground transit, but in this case, an elevated solution might be the best solution possible, and not just because it would be cheaper (which it would be).

First, the logistics. The Blue Line tunnel currently ends several blocks east of Bowdoin Station. The original portal was between Joy and Russell Streets (at Nims Square, one of Boston’s lesser-known squares). Here’s an aerial photograph of the portal; you can see that it is several blocks east of the curve at Bowdoin Station. Most likely, the tracks were capped just east of Joy Street, and the portal filled with dirt and built over. Most likely, it still exists.

And most likely, it could be easily opened. The cheapest option would be to run the Blue Line straight down the center of Cambridge Street at grade, but for a litany of reasons that, uh, wouldn’t work. But instead of coming up from underground and flattening out, it could continue sloping upwards and, by Blossom Street, enter an elevated guideway above Cambridge Street. From there, it would continue a few hundred feet and terminate at a two-track station with a center platform above Cambridge Street, adjacent to the current Charles Station.

Click the diagram below to enlarge. All lines are to scale.

There are many, many advantages to an elevated solution. They include:

• The portal exists! There may be some utilities buried there, but not likely major infrastructure; it’s probably mostly just fill.

• The portal is built in to the side of Beacon Hill. As the tunnel rises to the surface, the surface falls away. This limits the space that a ramp takes up for the transition from underground to elevated. In addition, because the Blue Line does not require overhead wiring, the tunnel height is lower—and therefore the floor is higher—reducing the amount of climb necessary. A similar subway-to-elevated transition exists for Green Line trains between North Station and the Lechmere viaduct. The distance between the portal and where the viaduct passes over the ramps from the Leverett Circle is conveniently the exact same distance as from Joy Street to Blossom Street on Cambridge Street.

• Once above the street, the viaduct will be quite narrow. Since the East Boston tunnel was originally built for streetcars, Blue Line cars are narrower than, say, Red Line cars. The elevated portion of the Green Line between North Station and Lechmere—especially the new section east of Science Park—is a good guide to the width, although with no need for overhead wire, a Blue Line viaduct could actually be built narrower than the Green Line.

• Charles Station could be built to serve the Blue Line with no added mechanical equipment, and minimal changes to the station. There are already wide stairwells, escalators and elevators in Charles Station which bring passengers from street level to the Red Line. The Blue Line would simply be a platform accessible from the current outbound platform, and would not require any additional infrastructure. Unlike other transfer points in downtown Boston, Charles Station was recently rebuilt, and passages are wide enough for significant additional traffic. An underground station, with additional elevators and escalators

• An elevated Charles Station would require transferring passengers to climb and descend fewer stairs than an underground solution. Imagine a round trip from Cambridge to East Boston. For an underground station, passengers would arrive on the Red Line, descend to street level and then down to the underground, reversing the trip on the way back for a total of four flights of stairs. For an elevated solution, the morning would require two flights—down to street level to cross under the Red Line and then back up—but the evening would be a level transfer, halving the vertical distance each passenger would have to travel.

• While Cambridge Street abuts the historic Beacon Hill neighborhood, it is generally bordered by newer construction, and in many cases by parking lots. The street runs east-west, so most of the shadows cast by an elevated structure would fall on the north side of the street, which is mostly occupied by Massachusetts General Hospital, and in several cases by parking facilities. As a major beneficiary of the project, MGH would likely be willing to have some shadows cast in exchange for far better accessibility. In addition, Cambridge Street already has an elevated structure at Charles Circle, so it is not an entirely new concept to have overhead transit in the area.

• A fire station would likely have to be relocated from the south side of the street between Russell and Joy Streets as they would no longer be able to take left turns across the subway-elevated transition. However, it could be moved to parking facilities on the other side street near MGH, and integrated in to new construction. For instance, a fire house occupies the ground floor of a skyscraper in the Financial District.

• Elevated construction and stations are far less expensive to build than underground. And far less distuptive. While an underground structure would require years of lane closures on Cambridge Street, an elevated structure would require only supports to be built in ground—and those would be in the median. Most of this work—exploration, utility relocation and the pouring of the concrete—could take place outside of rush hours, and the actual viaduct could be built off-site and placed on the pedestals, with minimal interference with local traffic. If the area can survive a three-year closure of the Longfellow Bridge, it could deal with a few short-term lane restrictions.

At $100 million per mile, the elevated section would cost less than $50 million to build. Since the station would be little more than a concrete slab between two tracks—no need to install multiple elevators, escalators and fare control—it would not appreciably add to the cost. It’s entirely possible than an elevated solution could be built for under nine figures, far, far less than the state’s estimate for an underground connection.

• This project would require few—if any—property takings. The only street-level construction would be supports for the elevated, and these could be built in the existing median on Cambridge Street. Again, the supports for the Green Line connection between Science Park and North Station is a good case study; the base of the concrete pedestals are only five feet wide.

Building a Red-Blue connector is something which would dramatically enhance Boston’s transportation network. It would increase ridership, reduce congestion downtown, and provide better employment access for a large part of the area. It would also utilize the only portion of the downtown network which is under capacity—the Blue Line—and allow it to better serve the traveling public. And while the state may be set on inflating the price to high that it will never be built, a compromise solution using as much existing infrastructure as possible could be built more quickly and far less expensively. It is a solution the city and state—and stakeholders in the area—should seriously consider.

Red-Blue Connector: It costs how much?

The Commonwealth of Massachusetts is supposed to build a connection between the Red and Blue lines. But they really, really don’t want to. It’s probably a very good idea, since it will increase mobility for Blue Line riders accessing jobs in Cambridge. And it will take some of the capacity crunch off the core subway lines where Red-Blue transfers take place. And it will improve access to Logan Airport. And it will shorten trips for thousands of commuters each day who will no longer have to transfer twice, in already-crowded downtown stations. There are definitely benefits. And the state is supposed to build it.

They’re doing their best not to. They’ve claimed that the construction would cost $750 million, which has been called “deliberately high.” How deliberate? The costliest subway project in the country—the Second Avenue Subway in New York—costs 1.7 billion dollars per mile. The Red-Blue connector is 1500 feet long. Less than a third of a mile If you do the math, it comes in at $2.7 billion. That’s not even in the ballpark. It’s an obscene figure and is risible. It shows the state does not want to come close to making a good-faith effort to support this transportation connection.

How much would it cost? Well, likely far less. The current Blue Line tunnels extend underneath Cambridge Street to a former portal at Joy Street. Continuing the tunnel would certainly be disruptive, but could be done in a cut-and-cover method without fully disrupting traffic flow (the street is five lanes wide including the median, and the subway would only require two). Utilities would require movement, but there would be no need to support an elevated roadway or surface train lines above (like the Big Dig). Traffic on Cambridge Street would suffer for a time, but better transit service in the end would be worthwhile. Alon Levy has a compendium of subway construction costs, and most projects fall under $1.5 billion per mile.

A good analog might be the Central Subway in San Francisco. It’s a short extension of a light rail-sized transit line (as is the Blue Line; the East Boston tunnel was originally built for streetcars so it’s a much smaller gauge than, say, the Red Line) extending to a terminal station in a dense city. It is budgeted for $800 million per mile. If the Red-Blue Connector was built for the same cost, it would come in around $250 million. Or a third of the cost the state estimates.

The $750 million figure is not disingenuous. It’s a lie. And an elevated connection—with only a few hundred feet of elevated structure—could be built for a fraction of the cost with a better final product, to boot.

Anecdotes in the Globe

When I write a letter to the Globe—which happens relatively often, it turns out—I try to throw something more than a personal anecdote in. I figure they don’t want to hear my story in response to Joan Vennochi’s (hers: “I was in traffic and a bike passed me, therefore I hate bikes”), but want me to add something their readership might be interested in. So I pick out one of her more ridiculous points (“We need more parking spaces for cars and fewer for bikes so people can go shopping.”) and show why it’s folly.

Which is why a couple of recent letters to the Globe regarding the DMU plan are dismaying. They get the gist of the argument right, but they anecdotes they use seem to say “look at this transit system we have, it’s so bad that I can’t use it because _____.” Except the fill-in-the-blank of that blank is a single personal experience which is not really verifiable. (I, at least, cited a study.)

Here’s letter #1. Nathan Banfield from Concord writes about taking the train from Concord. “I can drive to Porter Square from my home for, at most, $4 in gas, the same trip costs twice as much by commuter rail while taking considerably longer.” Let’s examine this. Yes, it’s $4 in gas. Then what do you do when you get to Porter? You park—somewhere. Probably at a meter. That costs money. A garage? That costs more. And if you factor in only the cost of gas, yes, it’s probably cheaper to drive. I think the 55¢ per mile (or whatever it is these days) figure quoted for cost per mile is high (it figures in fixed costs like insurance and assumes you have an expensive—and more quickly depreciating—vehicle) but it’s certainly more than the cost of gas alone.

But, oh, Nathan. Taking the train takes considerably longer? You picked one of the commuter rail lines where that’s not actually the case! The drive from Concord to Porter takes 22 minutes. If there’s no traffic. The train? 27 for an express, 34 for a local. That’s longer, but not by too much. But what if you happen to drive Route 2, say, between 6 and 10 a.m., or 2 and 7 p.m.? All of the sudden the 27 minute train ride seems like a breeze since you might spend that long waiting through the lights at Alewife. Yes, frequencies should be better. And, yes, on weekends it’s probably faster to drive. But for commuters, the train is certainly faster than driving, especially along Route 2.

The award for taking a single experience and mistaking it for data, however, goes to letter #2. Sherry Alpert writes in from Canton. “I’ve been riding these trains for 30 years” (reminds me of this Seinfeld clip). Good for her—and she doesn’t even try to claim that the train is so much slowed than driving. So, on January 8, the train was an hour late, and she missed a class. Therefore, the trains are unreliable. That may be the case, but just one late train on January 8 does not mean the train is always late. And would you rather drive at rush hour from Canton to Boston? Because that’s always going to take an extra hour. Again, the sentiment that more reliable service is understandable, but stating that the system is unreliable because one train was an hour late is like saying “traffic is really bad because I got stuck in one traffic jam.” If you get stuck in a traffic jam every day, then, yes, traffic is bad. If you get stuck in one specific traffic jam because, let’s say a tractor trailer jackknifed, then traffic is not bad—there was an accident.

Now, if only there was somewhere to see the MBTA’s arrival data. Some sort of, I don’t know, monthly scorecard. Oh. Wait. The MBTA has a monthly scorecard. You know what doesn’t have this kind of monthly data? The highways. But no one is writing letters saying “it took an hour to drive 12 miles on 128 today.” Because, frankly, that’s not really noteworthy, except maybe on Twitter. Which is where complaints about your train being delayed belong, anyway. But not in the newspaper.

Massachusetts’ DMU plan could well provide better rail service

Last year (oh, wait, in 2012—gosh) I wrote about the sorry state of affairs of the MBTA’s commuter rail system. Outside of rush hour, trains travel infrequently and on seemingly random schedules. Even in closer-in, denser areas, service is provided only every couple of hours. (Oh, yeah, and service is slow, too.) There is probably demand for better service but little supply, and it’s partially a cost issue: running full, 1000-passenger commuter trains (with poor acceleration) is a losing proposition when few seats are filled.

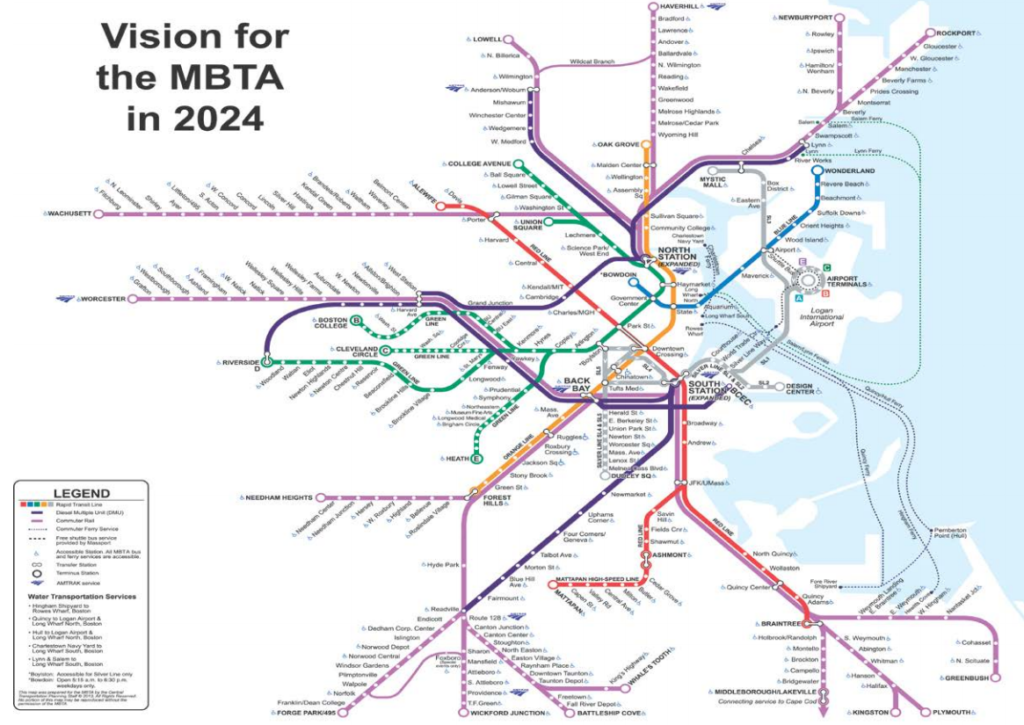
Enter the DMU. The diesel multiple unit, while sparsely used in the US, is a frequent sight abroad, providing service at times when a full trainset is not needed. They leverage the direct connections between town centers that exist along rail lines, allowing fast service to the city center without rolling empty cars through the midday and evening. The plan imagines several lines utilizing DMUs on rail segments inside 128—most of which do not have paralleling subway service:

 (The full report, which appears to have been scanned as a PDF, is here.)

If implemented, this would go a long way towards improving service on several underserved corridors. The Fairmount Line currently is served infreqently by full-length commuter trains, a complete mismatch of service. Lower capacity and better acceleration would provide a much better benefit there. The Worcester Line—which will soon have added service—provides very little service in Newton, the most densely-populated portion of the line (it is served by express buses, which crawl through traffic on the Turnpike). Better service to Lynn will provide some of what a far-costlier rapid transit connection would—faster and more frequent service to Boston, and service to Woburn will provide better connectivity north of Boston, as well as further reducing the run times for trains to Lowell, currently one of the faster trips in the system, and one which, if the state of New Hampshire pays, could be extended northwards to the granite state to provide an alternative for the traffic-choked I-93.

The most interesting piece here is the inclusion of the Grand Junction through Cambridge. This page would argue for a complete rebuild of this line, with grade separation and electrification, and its operation as a crosstown link between North Station, Cambridge and Allston, currently a serpentine trip by car, much less by transit. It also would provide better access to the fast-growing Cambridge area which is currently poorly-served by highways and at the whim of the over-capacity Red Line. Currently, commuting from west of Boston to Cambridge is a bit of a black hole; there is no good connection between the Worcester Line and Cambridge without going all the way to South Station and backtracking across the Red Line. The Grand Junction is an underutilized piece of infrastructure which could be put to very good use.

What really matters is how the MBTA decides to implement DMU service. (That is, if it can be funded and overcome local opposition; double-dipping Cambridge City Councilman and State Rep Tim Toomey helped to quash a plan to route some commuter service over the Grand Junction in 2010. Needless to say, he did not receive my vote in recent council elections). If it uses it as a cost-saving measure to run the same level of service with less equipment, it will simply maintain the status quo. For instance: there are only eight commuter rail trains from the stations in Newton to Boston daily. And the Fairmount Line has 60 minute headways with no evening or weekend service. Running the same level of service with different equipment would be a wasted opportunity (if a minor cost savings).

If the state provides faster and more frequent service to these lines, say, with 15 or 20 minute headways all day, it will come much closer to providing a transit level of service, and actually providing service to these communities. With new stations at Yawkey, near New Balance and the intermediate “West Station” the Worcester Line would provide better connections through an underserved portion of Boston and Newton (with frequent, timed shuttle service across the Grand Junction a dramatic bonus). And the Fairmount Line, which currently provides piss-poor service to one of the states most disadvantaged communities, could prove an economic lifeline, if only the trains ran more than hourly.

And if DMUs are successful, they could be implemented in other parts of the system. Why run a full trainset at off-peak hours from Newburyport to Boston when a transfer at Beverly would provide the same level of service? Perhaps instead of the hourly locomotive-hauled train from Boston to Lowell, half-hourly DMUs would double the service at a minimal additional cost. Perhaps DMUs could provide service further west of Worcester to Springfield and Amherst. Hopefully, the state sees DMUs as a tool, not as a cost-cutting measure. If they implement this service better than they photoshopped the map, they could dramatically improve travel in Massachusetts.

Failures in stock photography

In relation to the 10-year transportation capital investment plan the state of Massachusetts just announced (more on that soon) I was poking around the New Hampshire plan to extend transit to Concord, potentially piggybacking on better infrastructure in Massachusetts.

As I was scrolling through, however, I found a set of images which might inadvertently show why Massachusetts really needs to improve its infrastructure. At the bottom of the seventh page of this document, there are three images of commuter rail in North America. Here they are:
Let’s go right-to-left. On the right, we see the Long Island Railroad, gliding through the snow in New York. On the rails. In the center, there’s Tri-Rail, complete with commuters walking towards their destinations. The train is, of course, on the track. And on the left, there’s the MBTA’s service, uh, derailed outside South Station! The image, which appears to be from this story from the Boston Herald, shows a minor derailment outside of South Station in 2008. Setting aside copyright issues (perhaps they bought the photo from a stock site), it certainly seems like there are plenty of images out there that, you know, don’t show the T running off the tracks.
Well, maybe the Keolis contract will result in fewer derailments.