How much parking has Minneapolis nixed …

… and how much will it cost?

When Minneapolis put in to place “winter parking restrictions” this week (as we discussed earlier), how many parking spaces disappeared in to thin air (or in to a snow bank as the case may be)? It’s not hard to get a rough estimate. But first, which neighborhoods will be most affected? Downtown won’t be, since it has almost no street parking and every road is a snow emergency route (only non-emergency routes are subject to the parking ban). Many areas of the city have ample off-street parking and/or ample on-street parking, generally due to low population densities but, in some cases, due to low rates of car ownership, so parking will not be a major issue there. This leaves high-density areas with relatively high levels of car ownership as the main locations where parking is going to be come nightmarish:

  1. The quadrangle between Loring Park and 36th Street S and I-35W and the Lakes
  2. The West Bank of the U of M (north of Franklin, east of Hiawatha)
  3. The area along University Avenue on the East Bank

Obviously, the first area is far and away larger than the others, and it has many more non-snow emergency residential streets which are impacted by the parking rules. Home to many pre-war apartment complexes with little or no off-street parking, it is already the hardest residential area of the city to find parking. And it’s about to get harder. But by how much?

Looking at satellite photos on Google maps, it’s relatively easy to get a rough estimate of the number of parking spaces. For every north-south block (the long block in Minneapolis, with eight blocks to a mile) there are approximately 25 on-street parking spaces on each side of the street. Each east-west block, which are half as long, have about 10 spaces (most have an alley in the middle, and because of the alleys, there are few driveways in this section of the city). So for every non-emergency block, there are 70 parking spaces. 35 are gone for the next two months.

But every block is not a non-snow emergency route. Many main streets in Minneapolis are designated as snow emergency routes: pretty much any street which is a one-way, any street which carries a bus line, and many others (see a map, a large .pdf). This means that between Franklin and 36th, half of the east-west streets are snow emergency routes. And about a third of north-south streets are. But once we take a look at the map, we can pretty easily count the blocks, multiply, and have a good idea at the number of lost street parking spaces.

East-west streets: 120 blocks * 10 spots per block = 1200 parking spaces
North-south streets: 170 blocks * 25 spots per block = 4250 parking spaces
For a total of 5450 parking spaces.

Without a GIS at my fingertips, I can’t quickly calculate the population of these neighborhoods, but the location we are talking about fits in rather well to several Minneapolis neighborhoods: Lowry Hill (3,999), Lowry Hill East (5,912), East Isles (3,340), ECCO (2,545), CARAG (5,907), Lyndale (7,690), Whittier (15,455), Stevens Square/Loring Heights (3,948) and Loring Park (7,501). In these approximately four square miles reside nearly 60,000 people, with a population density of more than 14000—a density similar to Chicago and Boston, which are not easy places to park. It also means that for every ten residents a parking space is disappearing.

How does this number stack up to the total number of spaces in the area? A very rough estimate would be that there are approximately 20,000 on-street parking spaces (which are not time-restricted or metered) in the entire aforementioned area, or one for every three residents. And approximately 5000 will be removed.

This is actually something we can use elementary economics to try to figure out. Once parking reaches a certain level of utilization—once you can’t expect to easily find a convenient space—it becomes a market. Basically, if you need parking, you’ll either pay for an off-street space, or there is a opportunity-cost to finding an on-street space. If you need to find parking every day, it might mean spending five minutes circling the block and then walking five minutes each way to the space—at a time valuation of $12 per hour, that’s a cost of $3 per day, or $75 to $100 per month, which is generally what a parking space will cost in a neighborhood without ample street parking. (But also without exorbitant property values; a parking space costs, per square foot, about as much as living space. In this section of Minneapolis, housing costs around one dollar per square foot per month, so a 100 square foot parking space would cost about $100 per month. In other cities, where housing is more expensive, so is parking.)

Let’s consider that the average utilization of the on-street parking is above 90%—about one free spot, on average, per block. That means that at any given time, there is a “market” for at least 18,000 free parking spaces in this area of Minneapolis. If we assume that this market is in equilibrium (There’s no reason we shouldn’t. People who have cars pay the ~$100 per month it costs to park, whether it is included in their rent, in a spot they pay for separately or in the opportunity of finding street parking. Those without have decided to take the money they save on parking, and other facets of car ownership, and put it towards transit, walking, bicycling and others uses.), there is currently a surplus of 2000 parking spaces.

Now, parking supply is not perfectly inelastic, but it’s close. The only way to increase the supply of parking is for people with existing spaces to rent their spots on Craigslist (a common practice in Boston and San Francisco, but less so in Minneapolis); there are few major parking lots in the area. But if we consider that the market for spaces is rather maxed out, that’s a relatively small market, and there are significant barriers to entry and difficulties in marketing; plus, it’s barely worth the time to rent out a space for a couple of months and a couple hundred bucks. The other way to increase the supply of parking would be to increase the utilization of existing spaces, but even if you were to raise the utilization to 100%, it would only add 2000 spots to the mix. And utilization will never reach 100% as the market is not perfectly dispersed—the opportunity cost of walking a mile each way to a parking space is far higher than the cost of circling the block a few more times.

So parking has a vertical supply curve, or something close to it, as it has, for most intensive purposes, inelastic supply. (The example given for inelastic supply is the supply of land, and that’s basically what parking is.) So, when the supply is shifted downwards, the quantity can not change; only the price can. And as far as demand—in the long run, demand is elastic. If you added 5000 parking spaces, more people would have cars, and if you made the parking changes permanent, people aggravated with parking would sell their cars. But in the space of two months, few people will have the opportunity to make these changes. So demand is elastic in the short run, and inelastic in the long run.

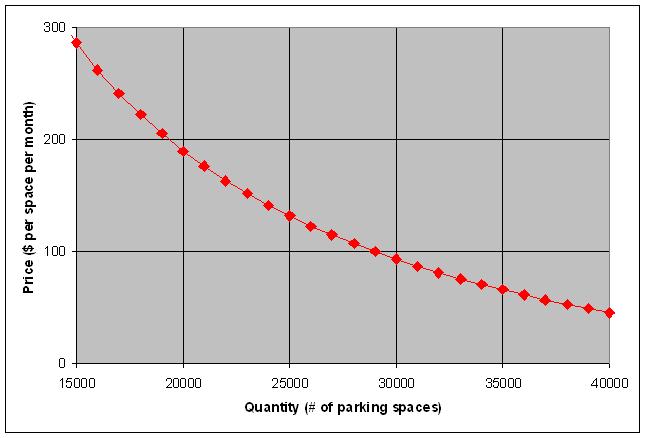
Now, back to our assumptions of 20,000 parking spaces decreasing to 15,000. How much is this going to cost Minneapolis parkers? Well, we first need a couple assumptions. Let’s assume the current cost of a parking space, at 20,000 spaces, is $90 per month. And let’s assume that as parking becomes scarcer, the overall amount paid for parking goes up, by $100,000 for every 1000 spaces lost. To make sense of this second variable, we can convert these numbers in to time costs. $90 a month equals 15 minutes a day, with 10,000 spaces it will be exponentially harder to find a space; instead of spending twice as long block-circling and twice as long walking, the distances may be triple as long (15 minutes block circling, 15 minutes of walking each way). In any case, the numbers give us a chart as follows:

Using this model, the price of parking would be zero at 38,000 spaces, which seems to make sense (double the number of spaces and everyone would likely get one out in front of their front door). At the current supply of 20,000, the average cost of a parking space is $90 per month, which correlates to 15 minutes of “parking time” per day. However, if you move the supply to 15,000 spaces, as has now happened, the cost increases to $153 per month, or 26 minutes per day. This seems to make sense: the average parker will have to spend an extra ten minutes, or so, per day, looking for parking, and walking further from the parking they find.

In other words, the parking ban is, over the next two months, going to cost the average resident of these neighborhoods $120. Or, if they don’t own a car, $0.

We can introduce a similar graph which assumes that there are 10,000 off-street residential parking spaces in the area (with a similar utilization rate, probably a bad assumption but one which keeps the calculations simple):

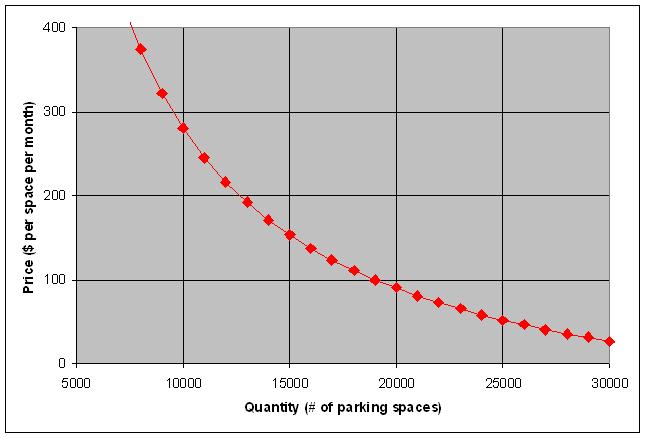
 
This curve is not as steep, but in it the cost of parking would increase from $93 to $132, or six minutes of “parking time.” This model would have “free parking” at 58,000 spaces, which is greater than the population, and in this neighborhood, at least, probably a tad high.
So, it seems that parking in Uptown is about to get significantly harder, but not impossible. There are a ton of variables to consider—does the marginal value of time increase as you circle the block looking for parking (I’d say it does)? Can we quantify the extra costs of looking for parking (gas, potential for damage from driving on narrow city streets)? There are also long-term policy implications—at what point does a lack of parking drive people to give up their cars? Would it be prudent to slowly increase the cost of parking to create more livable, walkable neighborhoods? Would this model hold up based on the number of cars and people in other cities?
And the big question, of course: will the parking woes in Uptown fit this model? We’ll see.
(I really should quite and study parking policy and economics. It’s very, very interesting.)

What happens when you halve parking?

Not when you have it. When you cut it in half. Minneapolis is not a city where finding a place to park is really a big deal. There are a few residential neighborhoods where you might not get a spot in front of your house—Uptown, Wedge, Whittier, and over by the University of Minnesota—but usually, even there, it’s not a huge deal to find a spot. In winter, there are snow emergencies, and everyone does a little dosey-do moving cars from one side of the street to another; then it’s back to normal.

Except, well, every once in a while. Starting on Thursday, there will be no more parking on the even side of the street. Until April, or whenever the snow melts. Apparently, Minneapolis has the authority to ban parking on one side of the street. Once fire trucks can’t get down the street because it’s too narrow (and they claim if they plowed all the way to the curb the sidewalks would be impassible), the regulations go up. The last time this happened was in 2001—nine years ago—and, well, it’s about to happen again.

So, what happens now? In much of Minneapolis, parking will go on as normal, just on one side of the street. But in the aforementioned perpetually parked-up neighborhoods, parking is going to be drastically decreased. It won’t be halved, exactly—snow emergency routes are exempt, so it’s only residential streets which are affected, and it doesn’t take in to account off-street parking—but in many areas there is going to be a significant decline in the availability of parking.

So, basically, Minneapolis is going to turn in to the parking equivalent of Boston, San Francisco or Chicago, pretty much overnight. It will be interesting to note several things. Will transit ridership go up—will it be worth a trip by bus if you don’t know if you’ll get a parking space when you get back? Will people start posting spaces on Craigslist for rent? Will some folks ditch their cars and make do with car sharing services? You better believe we’ll be watching.

Is bike sharing the “last mile” for car sharing?

A lot of hay is made about the “last mile” in public transport. Unless you live right at a bus stop or train station, your walk to the bus is going to be further than your walk to your car. (The term last mile derives from many other applications, such as communications and logistics, where the connections from end users to the main network are the least efficient, and thus most costly, to build and keep up. In transportation it relates to moving users from their origins and destinations to the nearest transit infrastructure.)

It’s an issue for car sharing, too. Even in the densest car sharing cities, many users live a few blocks away from the nearest shared car. (In these cities, of course, owning a car is generally very expensive and inconvenient, so the marginal gains from having a car right out your door are offset by the cost of a reserved spot or the time cost of circling the block looking for an unreserved one.) A car sharing network can be seen as similar to a transport network, with various access points spread across a region. With transport, the last mile is actually on both ends—getting from your origin to the network, and from the network to your destination—while with car sharing there is only an issue getting from your origin to the network as you then drive to your destination, so perhaps it’s more of a first mile issue. Still, it’s very similar—while there’s no hard research that I know of, anecdotal evidence is such that most car sharing users are willing to walk a quarter mile to a shared car, tolerant of maybe up to a half mile, but not very interested in going much further than that (similar to transit users).

Bike sharing may help to change that, by lengthening the distance people can travel to other modes. It fits in to a rather specific niche of the transportation network, for trips of between about 0.5 and 1.5 miles—trips that would be too short to bother with transit but too far to walk quickly. If bike share access is seamless and dependable—as is its goal—it can rather well fill this piece of the transport network. So before we look at how bike sharing and car sharing may interact, we should try to imagine where, exactly, bike sharing fits in.

In Europe, bike sharing has started up in the densest of cities—Paris (which is nearly as dense as Manhattan), Barcelona, Copenhagen—as well as many others. In North America, the first cities planning bike sharing systems are not necessarily the densest. Montreal, which is home to the successful Bixi system, is about as dense (11,000 persons per square mile) as Philly, although less-so than San Francisco (17,000) or Boston-Cambridge-Somerville (14,000). Boston is planning a system this year, as are considerably less-dense Minneapolis (7000) and Denver (4000), although, of course, the networks there will focus only on the densest portions of these cities. In a Paris, or even a Montreal or Boston, bike sharing will probably replace some trips made by transit or walking (or even short bike trips), but may not be as much of a driver of providing links to different modes, as transit is generally readily available. In the other cities, however, this may not hold true.

So there are basically two levels of cities implementing bike sharing. One is the dense city (>10,000 with a major fixed-guideway transit system and a large existing car sharing network: Boston, Montreal, Washington D.C., Paris, San Francisco …). The other is a less-dense city with a small fixed-guideway system and a fledgling car sharing system (Denver and Minneapolis, so far). Portland, which will likely join the bike sharing fray in the next couple of years, would fall in between, with its maturing transit system and a rather large car sharing market.

What bike sharing is best for are trips of a relatively finite distance, and it seems to vary based on the type of city (and which other transit modes are available). For trips significantly less than half a mile, you’d walk. The extra time it takes to get a bike and return it, even if there is a station right each end of a trip, is made up by the fact that by the time you got the bike, you’d be well on your way by foot. For trips longer than two miles, you’d likely want to ride your own bike (faster and more comfortable, but with a bit more overhead of storing a bike, carrying a lock and locking the bike) or ride transit (ditto, depending on the route), or use a shared vehicle. So bike sharing’s market is between about a third of a mile and a mile and a quarter (if you don’t mind locking your own bike) or a mile and a half (if you do)—perhaps a tad longer in cities without dense transit networks. Beyond that, biking, transit, a taxi or a car make sense.

So, how does it break down. Well, I made the following assumptions:

Denser city Less dense city
Mode MPH Overhead Mode MPH Overhead
Walk 3 0 Walk 3 0
Bike share 8 4 Bike share 8 4
Bike 12 7 Bike 12 7
Transit-slow 15 10 Transit-slow 15 12
Transit-fast 25 15 Car share+BS 20 
Car (Share) 20 10 Car (Share) 20 12
Taxi 20 6 Taxi 20 6
Trans-fast+BS 25  12  Transit+BS 15 10

MPH is, of course, miles per hour once using that mode. Overhead is the amount of time it takes at the beginning and end of the trip to get to the mode from the origin and from the mode to the destination. Walking has zero overhead. Bike share was estimated to have four minutes (a minute to the kiosk and a minute getting the bike on either end; this is probably a lowball estimate). Biking seven minutes: three minutes to get your bike out of storage, two minutes to lock it at the end, and two for incidentals (shoes, helmet). Transit-slow is for local routes, which are probably a shorter walk, transit-fast for faster routes (such as a subway) which are generally further away. Car share overhead is to walk to the car and unlock it, and adding Bike share (BS) to a mode can cut down on the walking time.

Bike share only makes sense in multi-modal situations in a few scenarios:

  1. In denser cities, to access faster transit. For longer trips, riding a shared bike a mile to a faster transit mode (say, a subway instead of a bus line) can allow most of the trip to be at a faster speed, and make the overall trip faster. Since most, if not all, transit stations served by bike sharing will have kiosks, this makes sense. In addition, it may allow users to travel to another transit line of the same level of service and eliminate a transfer, but, to keep things simple, these models don’t really look at transfers.
  2. In less dense cities, car sharing, which is quite dense in large cities, is a bit more diffuse. Thus, many potential car sharers might live more than half a mile from the nearest shared car. In Minneapolis, every HOURCAR in the initial service area will be within about 100 feet of a bike sharing kiosk, so dropping off the car is easy, and it may allow people a bit further away to access the vehicles. And bike sharing is much easier, here, than riding your own bike because you don’t have to bring a lock and lock it up (and worry about it)
  3. In less dense cities with less dense transit networks, it may make sense for some people to use bike share to access slower transit routes, especially if they live far from a route with frequent service, although in areas served by bike sharing, route networks are rather well established.

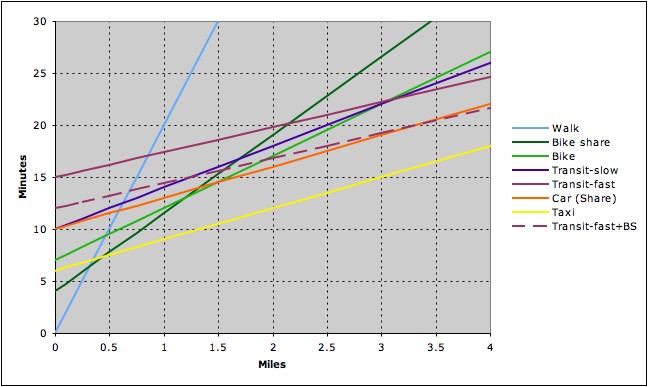
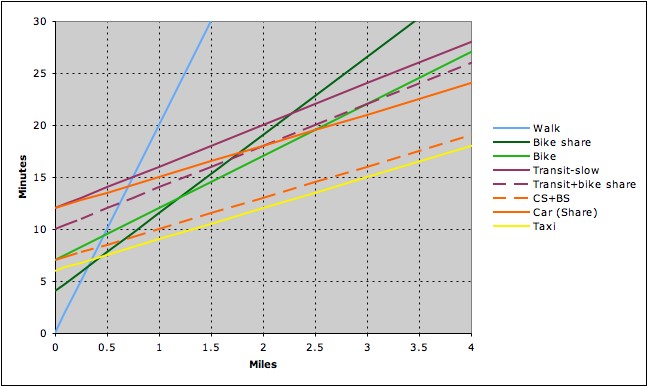
This perhaps, is best visualized by charts showing the time various trips take, based on the speed and overhead in the tables above.

The first chart is for denser cities, the second for less dense ones. For a given distance, the line nearest the bottom is the fastest mode. Cost is not taken in to account, but any orange or yellow line is a pay-per-use mode (taxi, car sharing) while any other line is a mode which is unlimited use, assuming most frequent transit and bike share users will have a monthly or yearly pass, so the marginal cost of each trip is zero. Dashed lines are variants of a mode with bike share added to the start or end of the trip to reduce overhead.

So in a dense city, where does bike sharing fit in to the picture? Well, assuming, for a minute, that we discount taxis (fast but expensive) and car sharing (expensive, fast, and not for short trips unless there is parking at the other end), bike sharing makes the most sense between about 1/3 miles and 1 mile if you have a bike of your own (or don’t mind locking said bike) and 1.5 miles if you would otherwise rely on transit. Considering that nearly half of trips are less than two miles from home, that’s a pretty big range—more tan a tad under half a mile and you’d walk, beyond two you’d take transit. However, bike sharing is generally only marginally faster than other options. Walking takes over for transit for trips much longer than 3/4 of a mile, so bike sharing will generally only ever save three to five minutes. So it better work well.

The other factor here is bike sharing and the faster transit network. What I mean by faster transit are generally grade-separated fixed-guideway modes (subway, proper light rail) but could also be express buses on highways. These lines are generally further apart than slower bus lines, so fewer people live within easy walking distance. In the chart above, for trips under three miles, it makes sense to take the bus (assuming it’s five minutes closer than the train), but if bike sharing can shave just a few minutes off the walk to the station, the train—which is more energy efficient and can more easily accommodate higher passenger loads—becomes a better option at distances of just over a mile—right about where bike sharing leaves off.

(Yes, it appears that bike sharing will actually make transit faster than driving at one point, but for very long distances, at least outside of rush hour, car sharing’s speed would be higher as drivers would access faster roads. This line should probably be curved (as should others) but that’s not really necessary for these simple simulations.)

In other words, imagine the following scenario: You live a block from a bus line, and the corner with the bus stop has a bike sharing kiosk. The bus line runs three miles to your office, or a store, or some such destination. You also live near a train station which has a line running to the same destination, but it’s a half mile walk from your house. Let’s assume that the bus and train have the same headways, that the bus runs at an average of 12 mph and the train at 25. Right now, your options are to walk to the corner, catch the bus, and ride 15 minutes to your destination; or walk ten minutes to the train, catch it and ride 7.2 minutes to your destination (17.2 total). With bike sharing, you can now ride at 8 mph 0.5 miles to the train (3.75 minutes), spend a minute at each end retrieving and returning the bike, and ride the 7.2 minutes, for a total of 12.95 minutes. So you save 2:03 versus the previous fastest mode time. It’s not a lot, but it’s a small advantage.

Of course, no transportation network is this cut and dry—but this is at least a way to imagine where bike sharing fits in. This summer, for instance, I wandered through Paris for a day with my family. We had two choices: the Metro or walking. Bike sharing was out because we didn’t have the proper credit card and my mother was scared of cycling through traffic without a helmet, and we didn’t know enough about the bus system to use it. (Taxis would have been an option, but they are expensive, slow—buses often have reserved lanes—and my family is cheap.) Had we had access to bike sharing, trips between half a mile and a mile and a half would have been easier and faster by Velib.

Now on to less dense cities. Here, the niche for bike sharing is similar, and maybe even larger, as we can assume that bus and transit service is a bit harder to come by. Bike sharing makes sense from about a third of a mile,  but this time is only exceeded by transit for trips greater than two miles. (This is due to the assumption that frequent bus routes are a bit less prevalent in these cities; living right near a good bus route would obviously change this equation.)

But it also shows the other advantages of bike sharing in these cities. First, bike sharing increases the utility of transit. It’s not a big difference, but with a more dispersed route network, we can assume that bike sharing allows a few more residents to live within “easy travel distance” of said routes. (Although this may be confounded by most bike sharing locations being near bus lines.) If this is the case, it makes transit faster than bike sharing around 1.5 miles—if a shared bike is used to access the bus.

Then there’s car sharing. While cities like Boston and Montreal have robust car sharing networks, Minneapolis and Denver don’t. In Boston, for example, there are entire neighborhoods where every resident is within a half mile—or often less—of not one but many shared cars. This just isn’t the case with Minneapolis and Denver. If bike sharing can be utilized heavily in these cities—and without as much competing transit there is a bit more of a market to seize—it could be the missing link to shared cars. These data assume that the time needed to access a shared car would drop from twelve minutes (±1/2 mile walking at 3 mph plus a minute to access the car) to seven (±1/2 mile biking at 8 mph, plus two minutes to get and return the bike, a minute to walk to the bike and a minute to access the car).

If there are bike share locations in locations other than car sharing locations (as is the plan, at least, in Minneapolis), they will allow people who may live a mile from a shared car to get to the car in eight or ten minutes (biking) instead of 20 or 25. This is the proverbial “last mile.” In less dense cities with higher car ownership, it is not always possible to support a shared car on every block. We’ll see if this becomes the case, but it is possible that a symbiosis will develop between the two shared transportation modes where bike sharing will allow a substantial increase in the reach of the car sharing networks in Denver and Minneapolis.