Hubway Data Visualization
Ari Ofsevit | www.ariofsevit.com | @ofsevit
North and South Stations
The two highest-use stations, accounting for about 5% of all Hubway trips, are North and South Stations. This is not terribly surprising, considering the number of people who pass through them every day (more than 100,000). However, while South Station's Hubway use is balanced, North Station is sees a huge spike of origins in the morning as commuters empty off of trains, and an influx of trip ends when the work day ends. For each station, I mapped the trip starts and ends, and categorized them by time of day. The width of the line is, of course, proportional to the number of riders.
| South Station Trip Starts | 5 a.m. to 10 a.m. 10 a.m. to 3 p.m. 3 p.m. to 8 p.m. 8 p.m. to 5 a.m. | South Station Trip Ends |
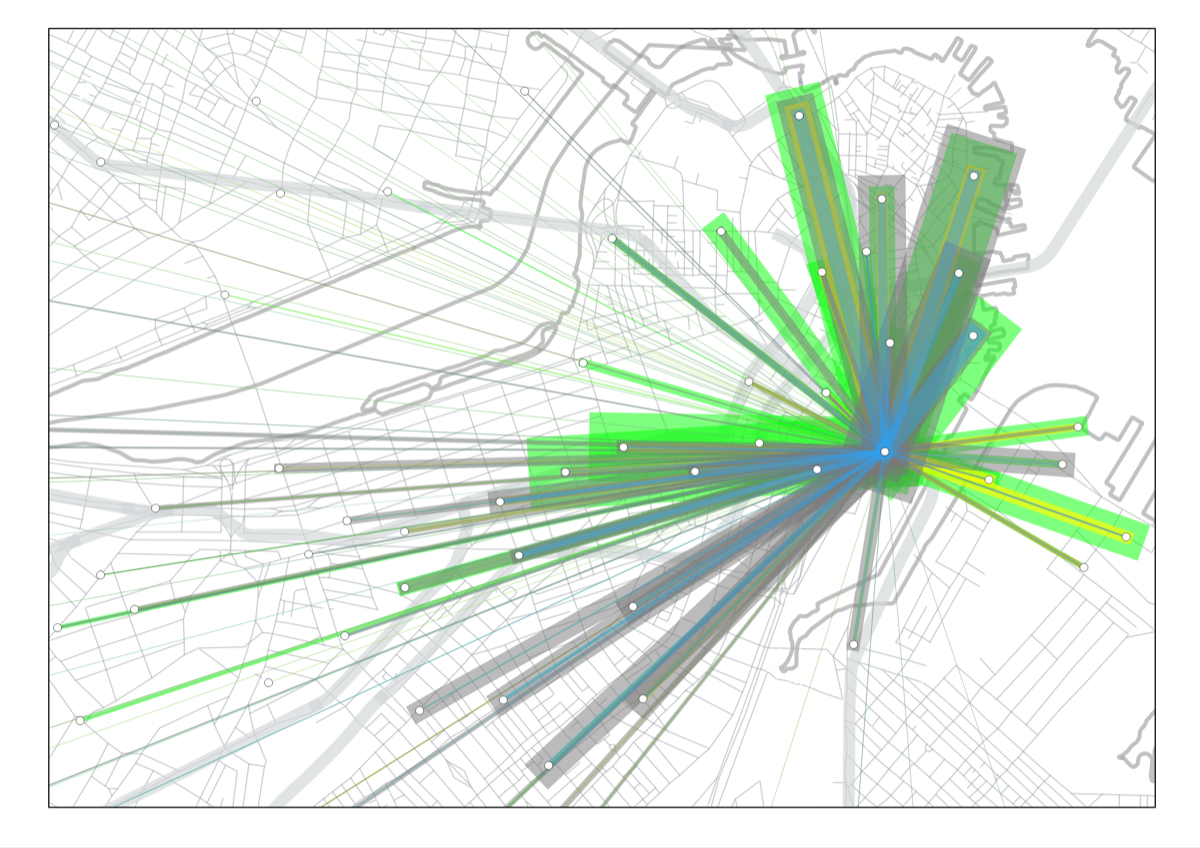
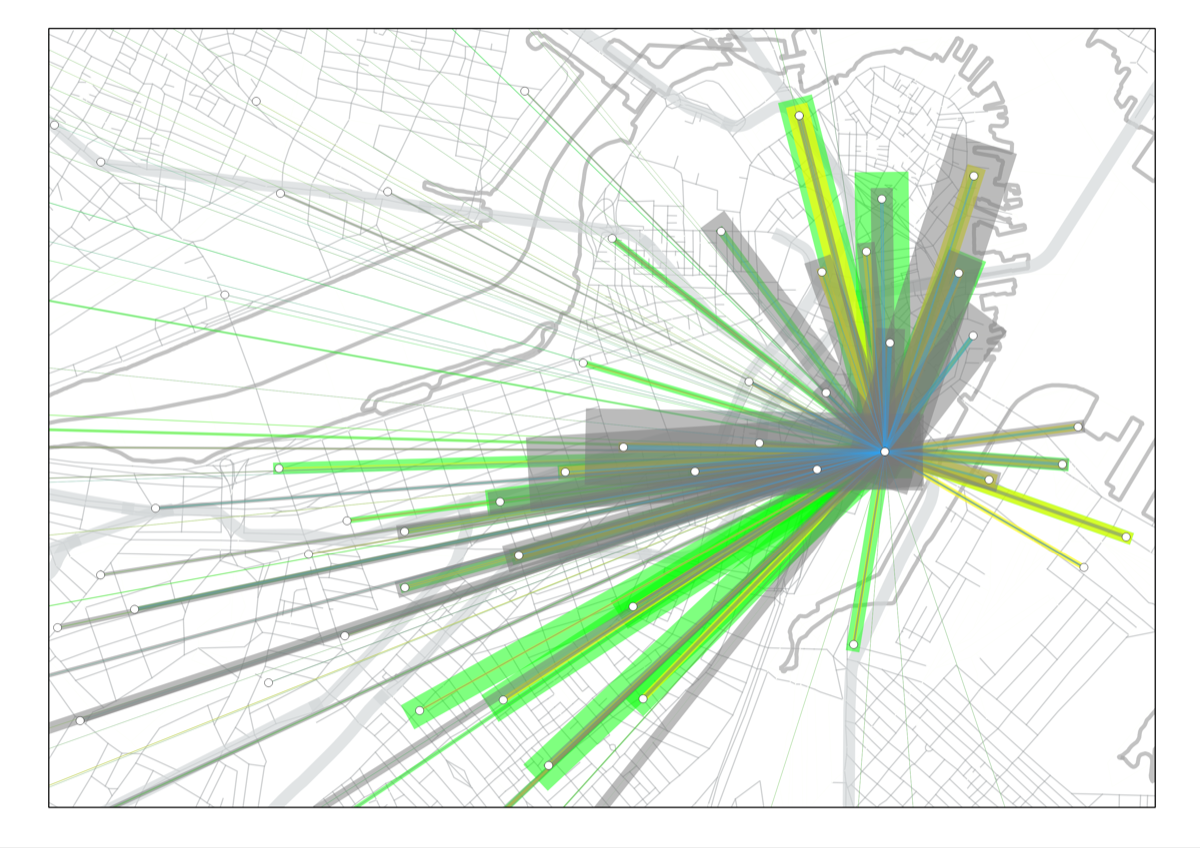
South Station's trips are rather well balanced; in other words, there's green and gray on both maps. There are a lot of morning departures and evening returns from Back Bay and the Financial District, but these are balanced by morning arrivals and evening departures from residential areas, especially the South End (which has no direct transit connection). South Station is near many offices, and most train passengers who arrive can walk to work.
Now let's take a look at the same maps for North Station:
| North Station Trip Starts | 5 a.m. to 10 a.m. 10 a.m. to 3 p.m. 3 p.m. to 8 p.m. 8 p.m. to 5 a.m. | North Station Trip Ends |
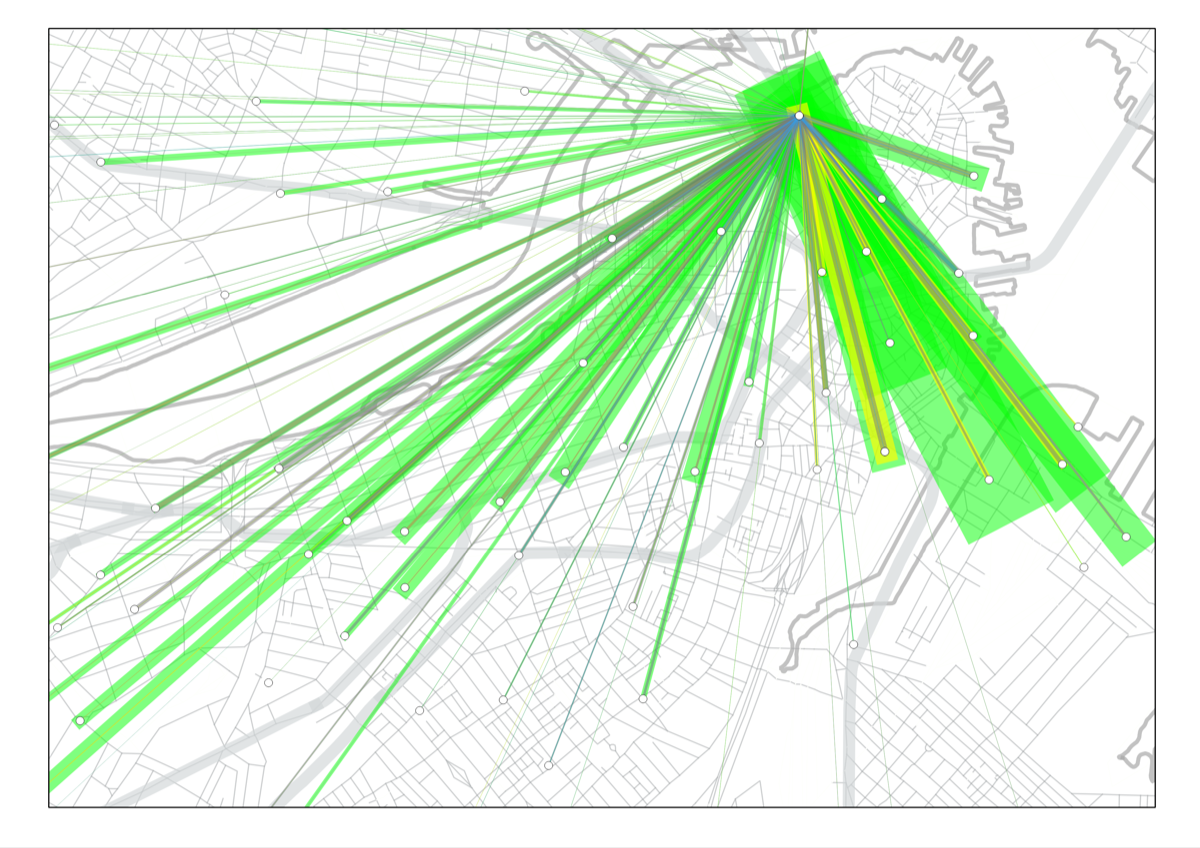
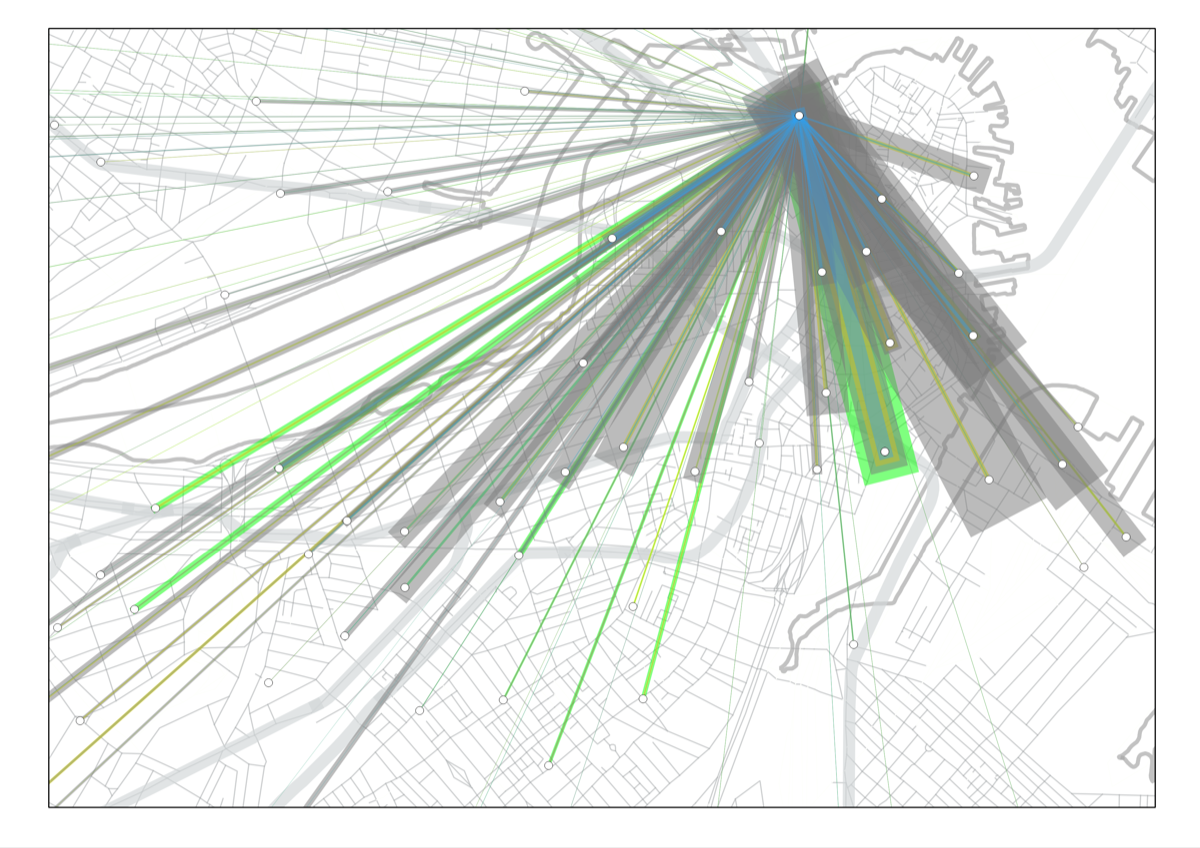
Here, there is a different story. In the morning, nearly every ride is a departure, showing up as green. In the evening, nearly every ride is an arrival, showing up in gray. North Station is much more isolated than South Station, and many fewer passengers can take a quick walk to work. For those who don't take the Green and Orange Lines, Hubway is a natural alternative. There's not much of a residential base, since all the housing near the station was torn down with the West End in the 1950s (as Car Talk says, "a guy named Rappaport got rid of them one night"). Thus, North Station is almost orphaned, and Hubway makes it more accessible to the center of the city. It's a whole lot easier than moving the station half a mile south.
This means that North Station, which sees 100 to 150 rides each weekday (that's 150 starts and ends), has more than three quarters of its bikes depart between 5 a.m. and 10 a.m. and return between 3 p.m. and 8 p.m. Since there are only about 50 racks in the station there, it means that Hubway has to rebalance the station daily at commute times, something they don't have to do at South Station. Let's take a look at the usage charts for the two stations (this is what we'll look at for each station on the next page):
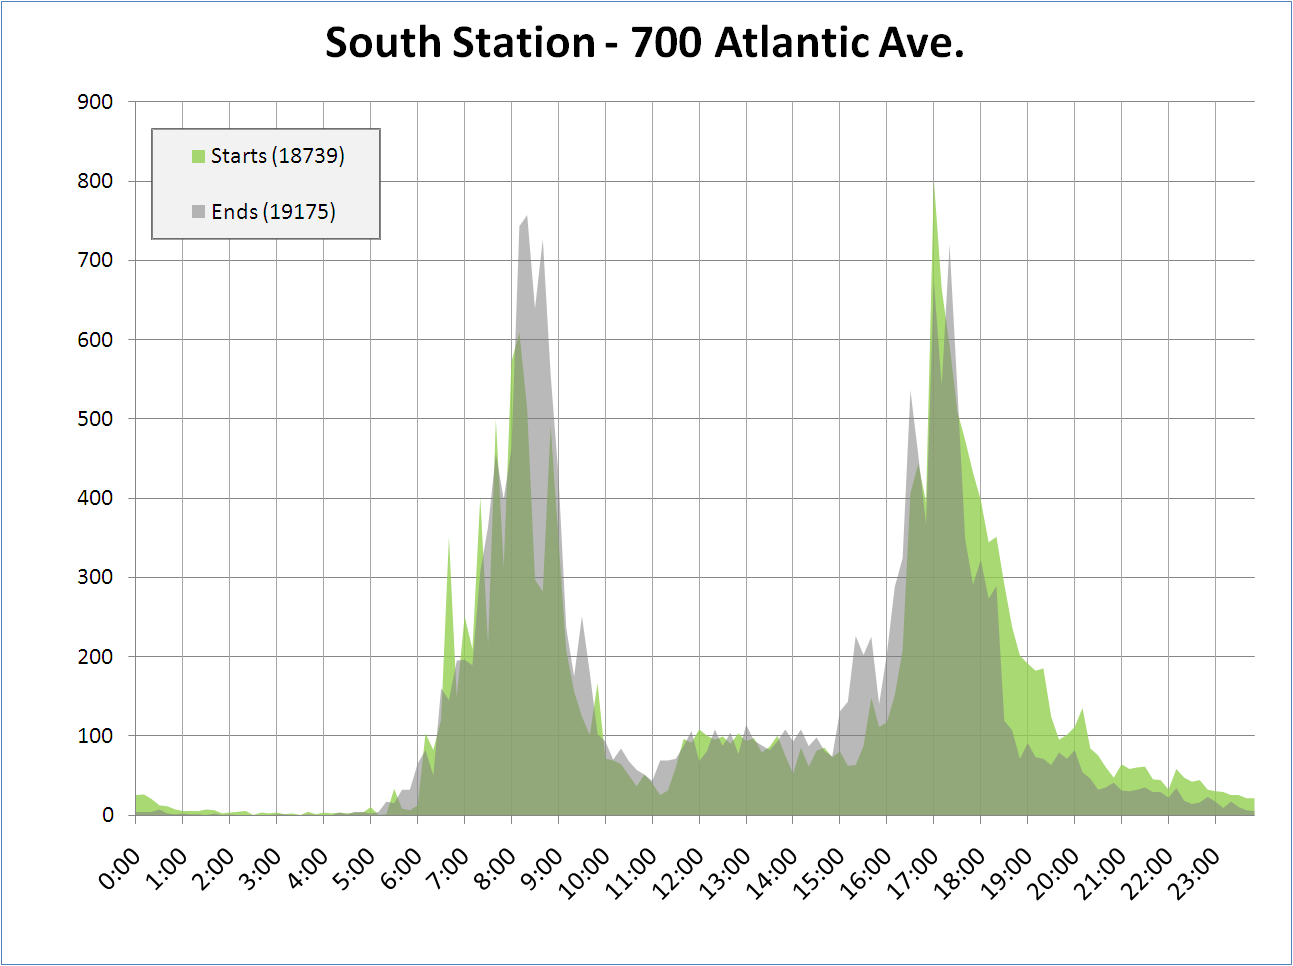
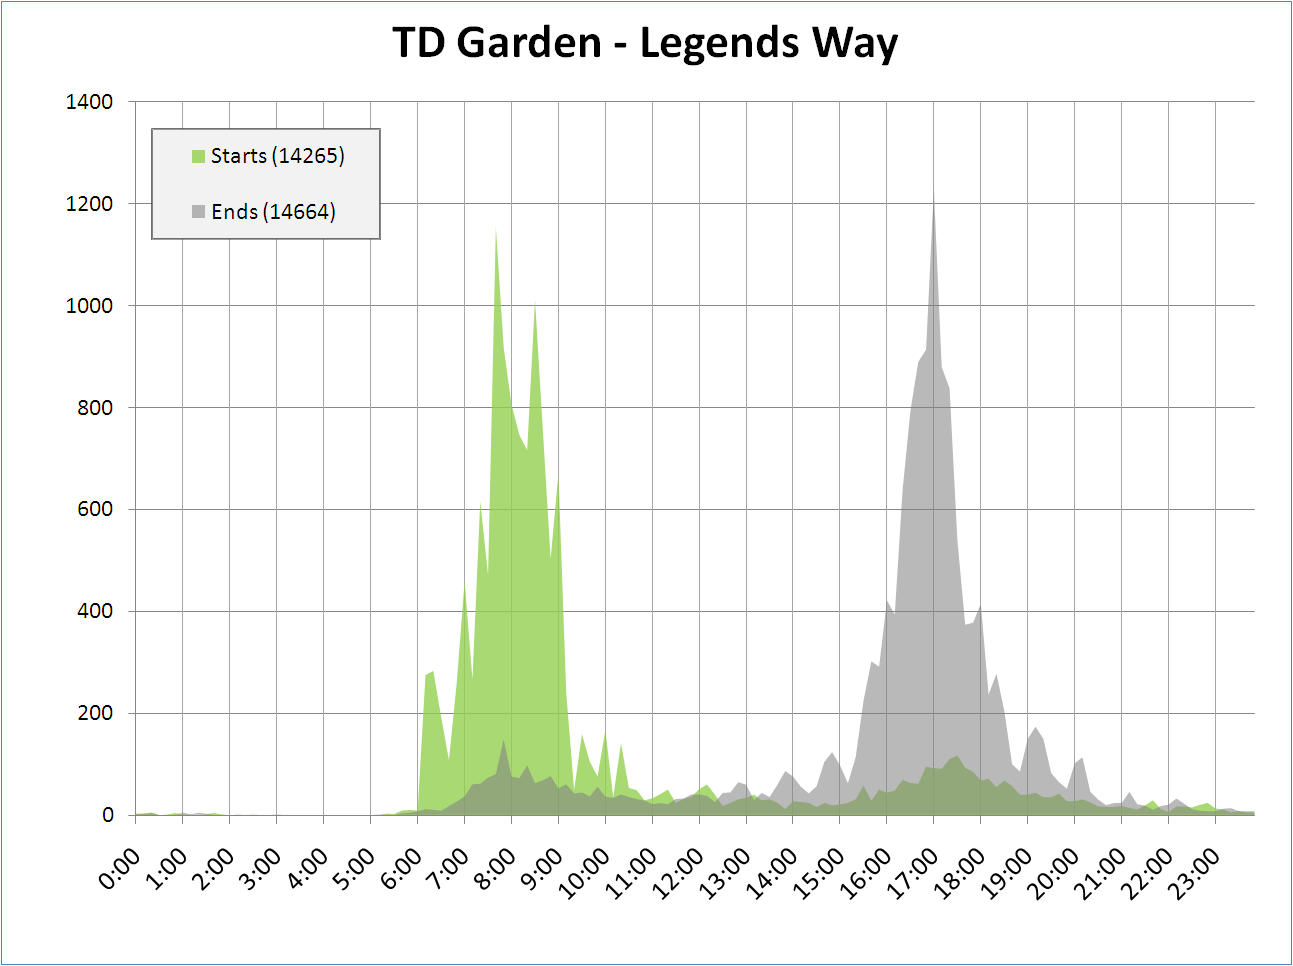
Two things to note. First, Look how different these profiles look! South station has similar levels of dropoffs and pickups at both rush hour, while North Station is skewed more than 6:1 (one of the the highest such ratios of any heavily-used station). Both stations see particularly high (>75%) use during these rush hour times, too. Second, note that while South Station's overall use is higher than North Station's, North Station's peak use is considerably higher, since it is a uni-directional station which seems hordes of pick-ups whenever a train pulls in.
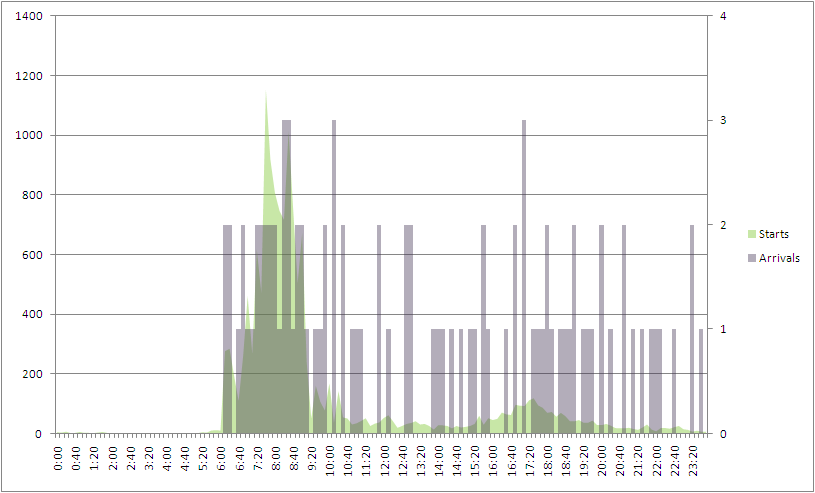
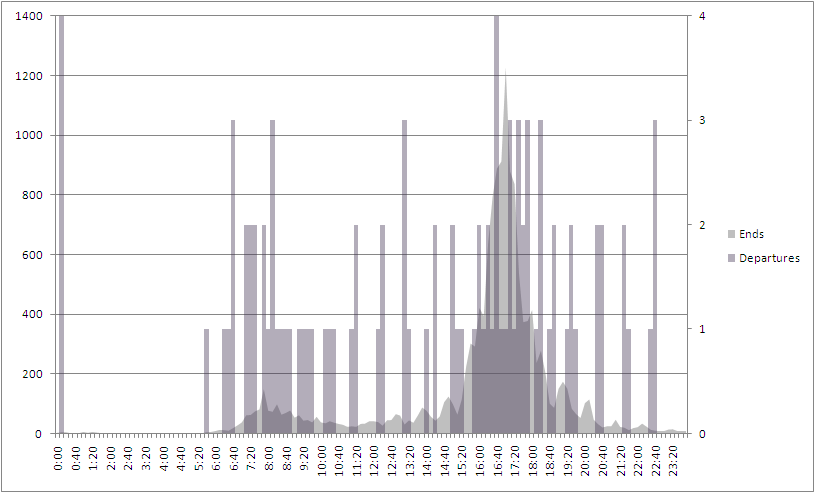
Finally: For North Station, look at the post-morning rush hour peaks for trip starts just past the hour, and the pre- and post-evening rush peaks for trip ends. Any guesses as to why these occur? Well, trains to North Station arrive and leave in banks on either side of rush hour, arriving just before the hour and departing a few minutes after. The Lowell and Newburyport/Rockport lines operate on a clockface schedule (trains come and go at the same time each hour) and the other lines follow suit with less frequent schedules. This is probably to allow the draw bridge just north of the station time to open and close without delaying trains. It's interesting how it shows up in the data. (South Station, with more train lines, more non-train use and no bridge does not show these trends). If we chart North Station trips and the frequency of train departures and arrivals, they match pretty well:
| Trip starts and train arrivals | Trip ends and train departures |
Have I ever said that I love data?
We'll get further in to different stations in the next section.
Ari Ofsevit | www.ariofsevit.com | @ofsevit