
I’ve run the Boston Marathon five times now, and during three of those, I’ve waited for my bag in a cold rain at the end of the race. While this is certainly preferable to the alternative, the marathon’s bag pick-up illustrates how systems can experience bottlenecks even if the overall system has plenty of capacity.
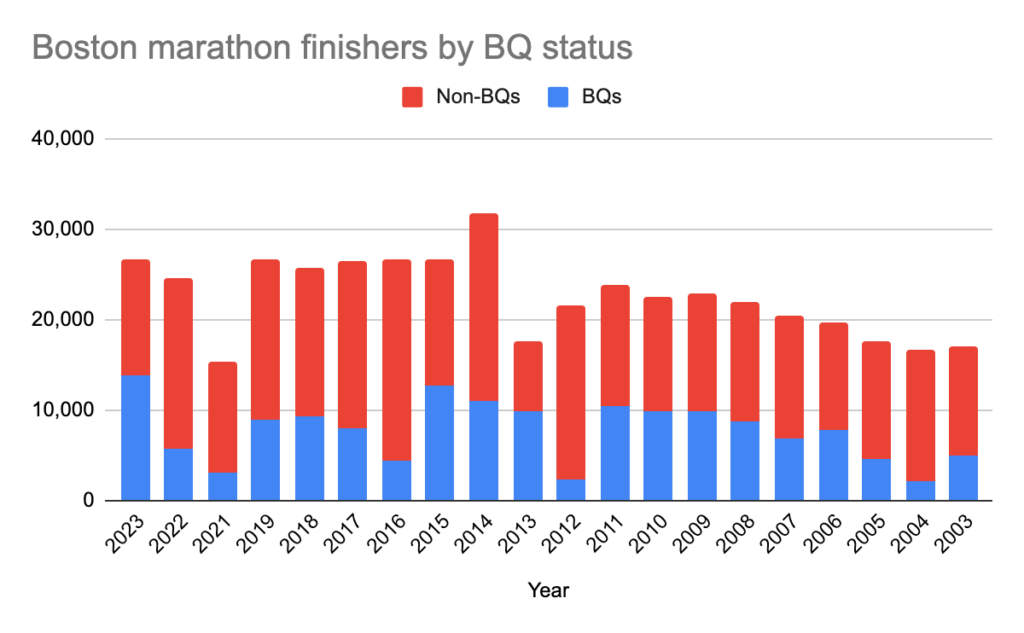
Boston is a unique race in many ways, but because it requires qualification for most runners, it is perhaps the most “densely-populated” marathon in the world: rather than spreading finishers across a four hour window (2 to 6+ hours), most are concentrated in the qualifying window (under 5 hours, depending on age, with most runners under 4). It certainly isn’t the largest race: New York, London, Paris, Berlin and Chicago all clock in around 50,000 runners, while Boston has settled in at a maximum size of 30,000.
The reason that Boston is smaller is that unlike those other races, it starts in a small town, takes over the high school for the athletes village, and the first few miles are on a two-lane wide road with no shoulders, meaning that even spread across four distinct waves, there are only so many people who can be bused to the start of the race, lined up, and started. (Chicago, by contrast, starts and ends in the Loop, Berlin, London and Paris are served by massive transit systems and New York uses an armada of buses to move people a couple of miles from the ferry to the start, which happens to be on to a major highway). On race morning, the parking lot behind the Hopkinton CVS is a sea of port-o-johns; New York uses the 160-acre Fort Wadsworth, Chicago starts in the middle of Grant Park.
(Aside: as I stood in line for the line for mobile urinals—a Nobel-worthy invention in the field of race waste management—people next to me worried we’d miss the start. “Nonsense,” I said, doing some quick math. “There are 80 urinals. There are about 250 people ahead of us in line. If each person takes 1 minute, we’ll be done peeing in 4 minutes.” We were. Logistically, each urinal holds about 400 liters and men can pee 10 to 20 ml/sec per the Internet, so these urinals will not fill up during the 90 minute pre-race pee period. Let’s move on.)
The roads in Boston eventually widen, although most of the course is less than four lanes wide. When you take this relatively narrow course (parts of London are narrow as well), and add, unlike the other races, the seeding of qualified runners, it means that the field never spreads out. Marathon finish times mostly resemble a bell curve (although with some eccentricities, discussed momentarily). The “average” marathon has a median time of about 4:30 with a standard deviation of about an hour. Boston has a median of about 3:45, with a standard deviation of only about 40 minutes. (Standard deviation data can be found here; European races tend to be a bit faster than American races on the whole per the study linked below.)
Why is it not an exact bell curve? Because many runners attempt to—and generally succeed in running—specific times. [2:59:56 marathoner this year raises hand.] Here is a very interesting business school paper on reference-dependent preferences which included the results from several thousand marathons and shows the distribution of marathon finish times.

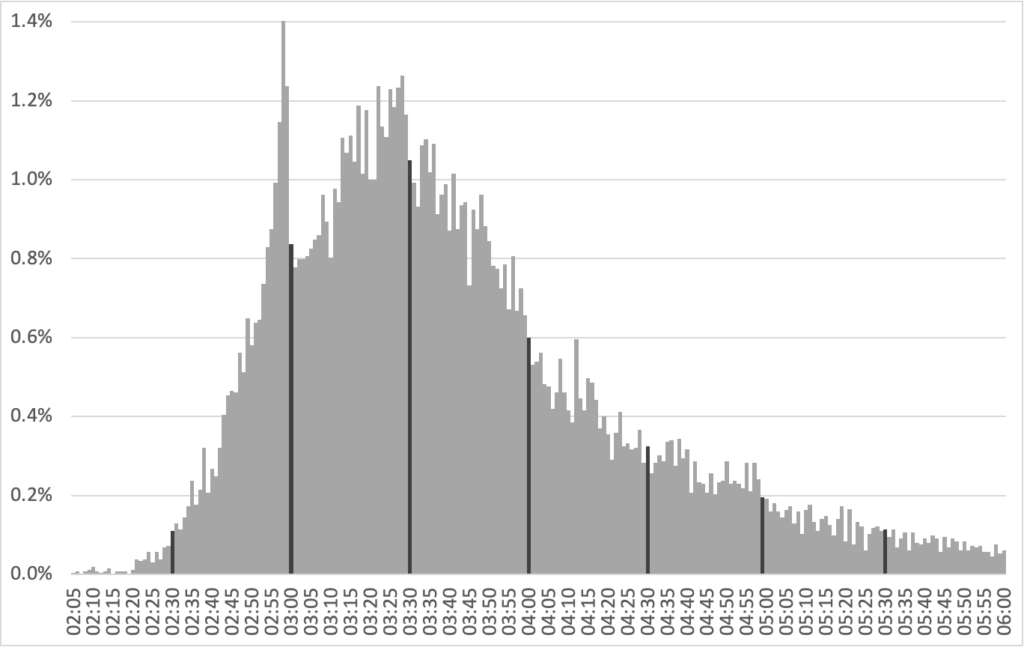
The n in this study is 9,789,043, so 100,000 finishers is just about 1% of the race, and other than a peak right around 4 hours, most of the race is under 0.8% per minute. Boston, on the other hand, has a solid hour with more than 0.8% of the race finishing, with a peak minute of 1.4% or 372 runners (in 2023) and several other minutes around 1.2%, or about 320 runners per minute. And that peak reference-dependent preference is a full hour earlier.
In other words, in a typical marathon, 40% of the runners finish in the peak hour (between about 3:35 and 4:35). In Boston, 60% of runners finish in the peak hour (between 2:55 and 3:55). 40% of runners finish across just 38 minutes, a rate more than 50% higher than typical.
Add to this: Boston’s runners are very well-seeded, so the heavy waves tend to start and finish together. In nearly every large race, runners are sorted into waves to start, with each wave starting every 25 to 35 minutes (rather than having one huge field stage and take 30+ minutes to clear the start). In larger races, the wave start means that although there is a peak between 3:55 and 4:00, that peak finishers are spread across multiple start waves. Most runners near the peak in those races do not have a qualifying race time, and are seeded based on interpolated times from other races.
Meanwhile, in Boston, the first three waves of runners almost all have qualifying times based on a recent marathon and are seeded quite well. Boston has less of a reference-dependent preference signature other than at the 3:00 mark, which happens to be the qualifying time for men under 35 and a significant goal for many runners. In fact, the largest single race for people qualifying for the Boston Marathon is usually the previous year’s Boston Marathon (the only exceptions are when the weather is uncooperatively warm). So in other races, at the peak times, runners are spread across multiple waves (not finishing all together), while in Boston most runners coming in at peak times started together (and in some cases ran the whole race within earshot).
Note: I could go and scrape start and finish data with gun times to go into this further, but for now, just trust me on “Boston has a lot of runners finishing together.”
This all means that at peak finishing times, there are not only 1000 people finishing per minute, but for much of the race, those people all started together. And what does this mean for bag pick-up? Here’s how bag drop works:
- Before the 2013 attack, Boston had bag drop at the start: you gave a volunteer your bag and it showed up in Boston on a bus a few hours later. (See DC Rainmaker’s blog post, back before he started reviewing every device.)
- After 2013, a bag drop policy was instituted at the start: you left your bag there and took a disposable bag to the start (and for cold years, wore extra clothing, transferring throw-away items from the Goodwills in Boston to Hopkinton).
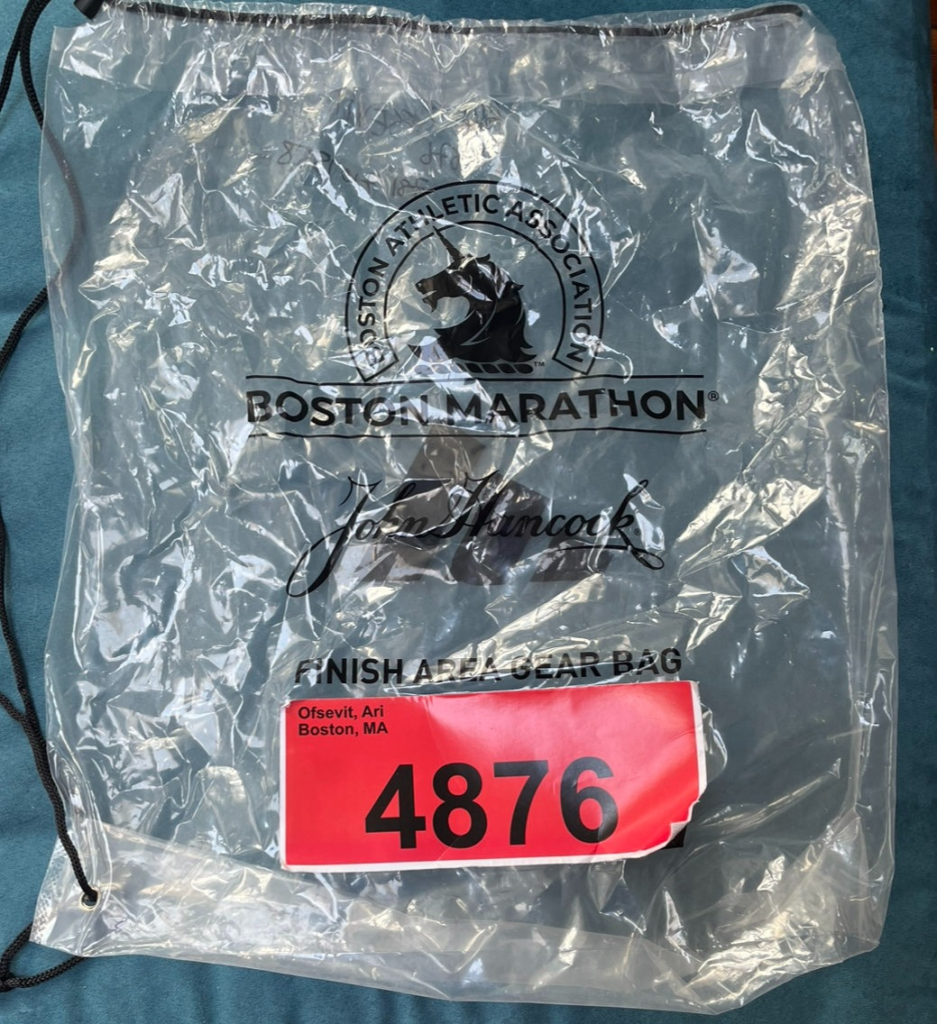
- Setting up a bag drop system for 20,000 or more bags requires erecting the infrastructure in Back Bay the day of the race; at first, this was tents and rows of bins with bags, the system has now morphed into one where you drop your bag at a school bus where it is stored through a window specified by your number range, allowing the storage units to be rolled away after the race (this, on its own, is a very good idea, here’s an image which shows how the easy part—the drop-off—works).
However, the system is still quite space-limited. Most every other big marathon ends in a park, or open area. Boston ends on a main street in the middle of a city. So there is not much room for queuing or storage for the bag drop. Which means that each bus stores approximately 1000 runners’ bags. Which is fine when they are dropped off: runners arrive over the course of about an hour per wave, with some early birds and some late arrivals, meaning about 15 drop-offs per minute, and drop-offs do not have to be sorted to the right person, only put into the right “bin” (a window of a school bus and on the inside, I assume, a numbered seat).
The buses are lined up by wave (red, white, blue, yellow) and then bags are ordered within each wave (1-1000, 1001-2000, etc). It is easy for race volunteers to look at a runner’s bib color and send them in the right direction to drop off their bag. They do, and go off to run their race.
On the pickup end, however, metrics are reversed. 1000 runners may show up over three minutes, and I’d guess as many as 600 of them may all need to get their gear from the same bus. Simply throwing random bags to runners would require, at times, more than three bags per second to be thrown at participants. But unlike drop-off, pickup requires sorting through as many as 25 bags (assuming a bus has 30 seats and bags are sorted into these seats). Without perfect ordering, volunteers search through the pile of bags until they retrieve the correct one. This may take 10 to 20 seconds or more, and even with five or ten volunteers on the bus (there really isn’t space for more), it means only 15 to 60 participants receive their bag each minute. If we assume the geometric mean here of 30 runners served per minute, it would take 30 minutes to serve all the bags in a bus, resulting in long queues.
As this occurs, a wave of long queues forms. Once the high rate of finishers starts around 2:50 from the start, the buses have long lines which form a slow-moving wave from bus to bus. After waiting for my bag in the 4000s for a long period of time in the cold rain (as I have in 2015 and 2018) I shuffled past the bus ahead of me with the 3000s. Aside from a few stragglers, it had no queue, the volunteers there had retrieved all of the bags and were catching their breath. Meanwhile, the queue behind me at the 4000s bus was ebbing, while the queue at the 5000s bus behind us had grown. But elsewhere, three-quarters of the buses, for the white, blue and yellow waves, wouldn’t see their first runners for, in some cases, an hour or more.
In introductory computer science courses, students are often taught about efficient search algorithms. Let me stop here and state that I am completely unqualified to write in depth about the efficiency of search algorithms. But mostly, it is very inefficient to search through an entire unordered list each time you want to find an item. It’s better to either sort the list (and then search through it) or sort the search term in a way that only searches part of the list. (That said, this is, let’s just say, a simplification, people write dissertations about this.)
Essentially, searching an unordered list is what the pile of bags search is. One solution would be to build a better sorting apparatus: I have participated in the American Birkebeiner ski race every year since 2006, and even produce the most popular (read: only) podcast about the race. Drop bags there are sorted and lined up, by number, in a parking lot, and distributed to finishers. This would work in Boston, if only there were several acres of parking lots in the Back Bay which could be used to stage the bags. Fortunately, urban renewal mostly steered clear of Boylston Street (the Pru was built mostly on old rail yards) and we lack the luxury of this open space. The school bus solution allows the apparatus to be set up on the streets, while providing cover from the weather for the bags (and volunteers), but does not lend itself to sorting beyond these bins.
If finishers were better distributed amongst the two dozen (or so) buses as they crossed the line, the sorting problem would be less of an issue. If 240 of 300 people crossing the finish line each minute had dropped a bag and they were evenly distributed amongst the buses, it would mean 10 people per bus per minute, and if five volunteers were on each bus, it would allow 30 seconds per bag for each user without long queues forming. The issue is that with this inefficient search algorithm—which is necessitated by the location of the bag pickup—has concentrated finishers. Hundreds of finishers wind up at a single bus at any time, and there are only so many volunteers who fit on this bus. When these “servers” can’t keep up with the demand of the “customers” (to use queuing theory terminology), the queue grows exponentially until, at some point, the wave of runners ebbs, and the speed at which customers are served exceeds the additions to the queue, and the lines dissipate. Of course, by this time, a similar wave has moved to the next bus down the line.
There is, I believe, a solution to this problem: sort the customers before they get to the bags. The main issue with this setup comes from a concentrated wave of people overwhelming a single service point. If the people were dispersed to more servers, it would allow more efficient use of the volunteers, rather than having one bus overrun while others lie idle. There is a simple way to do this: sort first by the last digit of the bib, and then by bib color and number. This would decrease the concentration of the customers by an order of magnitude, distributing them across the buses, rather than having them queue up in one place where there aren’t enough volunteers to handle them.
Here’s how such a system could work. When the BAA gives out drop bags, runners affix a sticker with their number and wave color. For instance, it might say:
4 8 7 6 or 1 8 7 6 5
This allows a rough sort by color and then number, but color is simply a function of the number, so it does not spread out the customers. Here’s a proposed redesign:
4 8 7 6 or 1 8 7 6 5
What I’ve shown here is that the numbers could have the final number highlighted to help inform people of the new sorting method, allowing the runners to be sorted first by the final number of their bib, and then ordered by their number. This would reduce the concentration by a factor of 10.
Directions about the changes could be given to runners with their drop bag sticker, as well as at the bag drop-off in the morning. Instead of signs pointing to different colors, they would instead point to numbers: 0 to 3 to the left, 4 to 6 to the right, 7 to 9 straight ahead. The start would be less tricky: before the race, people are generally more mentally aware than after running 26.2 miles. Once overcoming this small hurdle, runners would proceed to their number, then to the bus assigned to their color (each bus would likely have two waves assigned) and then the correct range. It would introduce an extra sorting step at the start, but would pay dividends later on.
The finish would introduce more complexity: runners and volunteers would have to direct people based on the last number of their race bib. This would be mitigated in a couple of ways. First, racers would have already experienced the system before the race. Second, volunteers already have to sort barely-cogent runners stumbling their way along Boylston Street by color, so they would instead sort “right/straight/left” by bib number. Once on the right street, runners would be able to find their correct bus by last digit and then color and join a much shorter and congested queue. Rather than 15 to 30 minute queues for bags, most runners would be served in just a few moments.
It might also allow the race organization to cut down on number of volunteers required for the system. Rather than moving volunteers between buses as demand changes, each bus would have even demand during the entire bib pick-up procedure. This would reduce “deadhead” time when volunteers are required to move between buses as they are needed elsewhere, by allowing them to maintain a single duty station during the entirety of the bag pickup process. There would still be 300 or more finishers per minute, but they would be spread across 10 pickup locations at any given time, not concentrated at a single site.
Since this is sometimes a transportation-related site, there is a lesson here in the transportation planning realm: A system which seems efficient may have an unforeseen bottleneck which creates a single point of failure, meaning that a small portion of the system is oversubscribed while the rest is underutilized. A wide highway might encounter a lane drop or even a situation where traffic has to sort into different lanes, resulting in a long backup. A rail line may have plenty of capacity along most of the line but a busy station with long dwell times or a single switch may curtail capacity along the rest of the line. For the Boston Marathon bag pick-up, the well-intentioned decision to simplify the drop bag system results in a bottleneck of hundreds of cold runners huddling under thermal sheets, all too often in cold rain. Simply by changing some procedures, this may have a fix which would benefit everyone involved.