
I’ve been part of the calls for the transformation of the MBTA’s Commuter Rail network to more of a “regional rail” network, with more frequent service, especially at off-peak times, for quite a while. The agency has been taking some very small steps towards regional rail, most notably by increasing frequencies on most lines to hourly (where, before the pandemic, midday ridership had been every two hours in many cases, and sometimes worse), and improving service on some lines on weekends (where trains in the past ran only every three hours in some cases). This had led to relatively strong ridership, despite less rush hour commuting, with reported ridership at 76% of pre-pandemic levels. (A caveat is that unlike an agency like, say, Metra, the T has not released much public data about commuter rail ridership.)
There are few “legacy” commuter rail networks in the United States, which have had service dating back to privately-run commuter service (generally in the 1800s). A short history of commuter rail (I’ll defer to Sandy Johnston for the definitive history and yes, you should read his history) is that it is almost as old as the railroad itself, with the first “commutation” fare (a reduced fare for frequent riders) showing up in 1843 in on the Boston and Worcester Railroad. Commuters became an important service and income source in certain large cities, although not in all; in many cases, interurbans or streetcars provided longer-distance services (although often with more frequency than commuter rail). For instance, Los Angeles had no historic commuter rail service, but the Southern Pacific-controlled Red Cars provided a similar service (as did the Key System in the Bay Area and even, to some extent, “Speedrail” in Milwaukee).
In the early 1950s, ridership grew as the suburbs grew, but began to quickly decline as the already worn-out physical plants deteriorated further and the services began to lose money, especially as jobs followed residents out of cities and suburban freeways made driving more time-competitive. Suburban riders often had enough political muscle to force money-losing operations to continue, and eventually Commuter Rail systems were given operating subsidies, allowing most to continue operation (although small systems in Pittsburgh, Cleveland and Detroit disappeared entirely—and Boston came close—and some lines in other cities were abandoned as well). What midday service existed was often cut back further, with some systems operating only at rush hour, and others with minimal midday service.
By the 1980s, subsidies and investment helped to improve some systems, and coupled with increasing congestion and parking costs, ridership began to improve. Before the pandemic, commuter railroads were often some of the least-subsidized forms of transit, recouping costs mostly by charging higher fares for their whiter, more-suburban ridership base while, in many cases, maintaining a 1950s operation on 1850s rights-of-way with 1950s rolling stock. This is the paradox of commuter rail service: by utilizing centuries of investment in the railroad, most of the costs are fixed. Original capital costs were paid generations ago, and many operating costs—maintenance of way, stations, signals—don’t vary depending on the amount of service provided. There is an almost-happy medium—which was attained in some cases pre-pandemic—where thousands of commuters drove to parking lots, boarded clunky, diesel trains (or, in some cases, newer electric trains on clunky, old tracks) for a ride to the city and back because while the experience may not have been particularly pleasant, it was preferable to bumper-to-bumper traffic.
Six cities have maintained this legacy service (Boston, New York, Philadelphia, Washington, D.C., Chicago and San Francisco). In the past 20 years, there has been some investment in new commuter rail systems, almost entirely on existing freight rail corridors (or parallel rights-of-way). In 2019, as measured by passenger-miles, 62% of commuter rail riders were in New York City, 12% in Chicago, and almost 90% in the six legacy cities (and 85% of fixed guideway passenger miles overall are in these cities). Los Angeles has built a system larger, by passenger-miles, than DC or San Francisco, but only by building a sprawling system with more track-miles operated than any other system but New Jersey Transit, which has rail lines in three states and includes operations into both New York and Philadelphia. (Metrolink carried about 400 million passenger miles in 2019, New Jersey Transit carried 2 billion. Commuter rail in New York had 8 billion rides: 20 times more than Los Angeles on a network only three times the size.)
Measuring passenger-miles is a measure of outputs, and is sort of just a stand-in for the system size and development patterns, plus factors such as the portion of the region served. Caltrain serves only one corridor in the region, but if San Francisco included BART—a system which derives significant ridership from its outer branches which act as commuter rail, albeit with much better frequencies—it would be the fifth-highest agency in the country by passenger-miles, trailing just the New York City’s subways and commuter rail agencies.
I wondered if I could measure inputs, as in, how much service is provided for each mile of track. Since so much of the cost of providing service is fixed (already paid for), the marginal cost to run more trains (which, in many cases, just means running existing rolling stock more frequently at off-peak times) is quite low. Luckily for me, the National Transit Database requires transit operators to report this (all data here is from the NTD’s 2019 data set; 2022 may begin to paint a reasonable post-pandemic picture but it won’t be released for months). I am also more interested in the number of trains operated as opposed to the number of cars operated; as a passenger, a two-car train every 15 minutes is far superior to an 8-car train every hour, and the NTD tracks this as “train miles.”
So I came up with my utilization intensity metric for fixed guideways: train miles per fixed guideway mile. It’s basically looking at frequency, but over an entire network. I then separated these by mode and agency and sorted them from lowest to highest. The results are not especially surprising, but do paint a bit of a picture of how American transit does, and doesn’t, work. (The data used here can be found in a Google Doc here.)
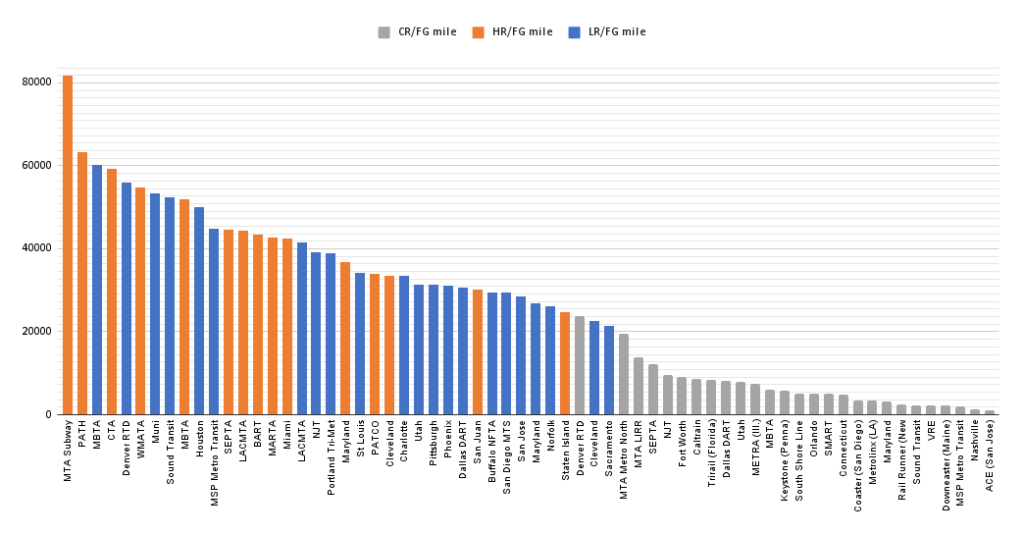
In the chart above, colors represent modes, where orange is heavy rail, blue light rail and gray commuter rail. Not surprisingly, New York City’s subway system is by far the most intensely-used system in the country. For every mile of track, there are more than 80,000 train miles per year, meaning that on average there is a train approximately every 6.5 minutes. PATH comes in second, followed by the MBTA’s Green Line, which ranks highly since its four branches are interlined in a high-capacity tunnel. The next ten slots are about evenly split between large heavy rail networks (Chicago, DC, Boston) and big-city light rail networks (San Francisco, Seattle, Houston, Minneapolis) which, in some cases, are being asked to perform a role similar to a heavy rail system, with grade separation, tunnels and long vehicles.
Most heavy rail networks cluster at or above 40,000, meaning a train, on average, every 12 minutes, inclusive of off-peak and overnight times. Many smaller light rail systems fall in the 20,000 to 35,000 range, which still means that they provide service every 15 minutes during much of the day, but in some cases with 20 or even 30 minute headways at off-peak times on less-used systems. And eventually, we arrive at our most intensely-used heavy rail system, two of which are above an inflection point where usage begins to drop. Given that two-thirds of commuter rail ridership is in New York City, it’s got to be in New York, right?
Nope.
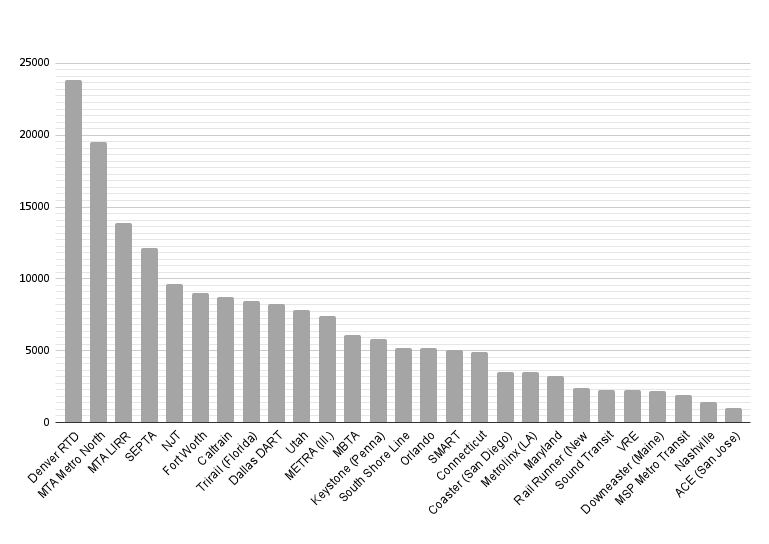
Denver.
There’s a lot to fault about Denver’s transit system: that it follows freeways and doesn’t serve existing populations, that Colfax should have had a light rail line years ago, that new light rail and regional rail lines are sometimes built with huge parking lots instead of development, that it somehow took three years to figure out the crossing gates on the airport line, and that the light rail maybe should have been regional rail to begin with anyway.
But Denver did, and does, two things right. First, they built a 23 mile rail line in 2016 for $1.2 billion. Yes, the line follows existing rights-of-way (but separated from the freight railroad, because we can’t have nice things), but at an inflation-adjusted cost of $65 million per mile, which includes grade crossings, several flyovers, signals, full electrification, stations and rolling stock. Second, they run the service as frequent regional rail, not commute time-focused commuter rail. Which means that it is the most frequent commuter rail system in the country.
Denver’s airport service runs every 15 minutes from 4 a.m. to early evening, and then every half hour until after midnight on weekdays. And on Saturdays. And Sundays. Philadelphia has an airport service too. It’s run with the same electrified rail cars Denver uses, on a fully grade-separated line with double track the full route (Denver manages 15 minute headways with a portion of single track). It runs every 30 minutes on weekdays … and every hour on weekends (and this is still more frequent than most of Philadelphia’s “Regional Rail” lines). Denver and Philadelphia have the same level of past investment in their rail networks: electrification, grade separation, and in the case of the Airport Line in Philadelphia, level boarding. But Denver provides more than twice as much service.
The next two commuter rail agencies are in New York, MetroNorth (which nearly matches Denver) and the LIRR. Long Island and New Jersey fall down this list because they include more low-frequency tails which provide infrequent service along exurban and even quasi-rural routes (like the Port Jervis Line or Greenport, which only sees four trains per day). Then there’s SEPTA, which despite running trains only every two hours on weekends on some lines and hourly on weekdays still runs more service than other agencies. Beyond that, some newer systems, including in places like Texas, Florida and Utah, provide more service than the two largest non-New York systems: Metra in Chicago and the MBTA in Boston.
Metra doesn’t many good excuses for its lack of service. Before the pandemic, Metra services were very rush hour-focused. Take, for example, the heavily-trafficked BNSF line. With three tracks, Metra ran complex local/express service, filling trains at bus transfers and park-and-rides in the suburbs and depositing them in the city. 11 trains arrived in Chicago between 7 and 8 each morning, and another 12 between 8 and 9. The rest of the day had service every hour, and on Sundays, trains ran every two hours. More trains arrived in Chicago between 7 and 8 a.m. on a weekday than the entire day on Sunday (the 2019 summer schedule added a test train on Sunday morning and afternoon to provide hourly frequencies during part of the day).
One somewhat-reasonable excuse is that the BNSF Line, like some other Chicago-area lines (but not all), had heavy freight traffic, with dozens of freight trains operating each day. These trains were relegated to operating at non-peak times (at peak hour, passenger service occupied all three tracks), so the morning rush hour level of service wouldn’t be possible. Still, service every 30 minutes (or even 20 or 15) could be provided, potentially with some schedule padding built in for freight interference moving on and off of the corridor, with strategic investments to improve conditions (and, maybe some strategic reforms to the freight rail industry as a whole). With changing travel patterns post-pandemic, Metra is looking to move away from the high commuter skew (it has already cut schedules back at commute times based on demand) towards a more regional rail system.
Boston doesn’t have this excuse. While Chicago is the major freight logistics hub in the country, freight rail in and around Boston has dwindled to a few carloads per week aside from some through traffic that crosses the ends of a couple of the regions Commuter Rail lines. The MBTA controls nearly the entire network, and can not point to dozens of freight trains as a reason it can’t run more midday service, and it runs less service than Chicago. During the pandemic, the agency has moved to hourly service on most of its lines on weekdays (still every two hours on weekends) but in 2019 it ran 20% less service than Metra, and only 1/4 the service of Denver, despite similar base infrastructure (two-track railroad with minimal interfering traffic). This means that cities like Boston and Chicago are doing far less to leverage past investment than they could. Traffic congestion has returned—Boston is ranked fourth in the world—but with trains every hour or two, there’s little reason for most people to try to take one. The MBTA has given lip service to a “rail transformation” but actual policy has been at best lacking at at worst forays into technologic gadgetry.
The bottom of the list is populated by smaller systems: regional systems like the Keystone service between Harrisburg and Philadelphia (which, fun fact, is by far the fastest transit service in the country, averaging 56 mph) or the Downeaster from Boston to Maine (which is … not as fast). Aside from LA’s sprawling system, others are usually single-line systems in smaller cities, or, in the case of MARC in Maryland, a full-service line (the Penn Line) with rush-hour-only service on other line dragging down the average.
For other systems in cities that don’t rhyme with “Enver” there is a good policy outcome: running more trains. Everything needed to do this is in place: track, signals, trains, stations and probably even interested passengers. It requires little more than some additional staff and some additional fuel. With peak demand lower, it’s time for commuter rail agencies to be dragged, kicking and screaming, into the 21st century. Except for Denver, they’re already here.