I’ve been counting bikes on the Longfellow for … a while (although apparently not in 2015, slacker). In any case, with the layout of the bike lane changed appreciably over the past several months, I decided to count again. Here’s a quick breakdown of the Longfellow’s bicycle facilities in the past few years:
- 2013: “Normal” pre-construction travel: bike lanes on both sides, two lanes of general traffic.
- 2013–early 2015 construction: all traffic on the downstream side, one lane of traffic inbound, inbound bike lane, outbound contraflow lane with a buffer.
- Early 2015–Late 2015: Inbound bike lane unchanged, but sections of outbound lane routed on to the sidewalk to accommodate work on the salt and pepper shakers.
- Late 2015–Early 2016: Inbound bike lane eliminated for approximately 100m at the Cambridge end for Red Line shoo fly trackage; outbound lane eliminated entirely, cyclists asked to walk bikes across the bridge.
- Early 2016–present: all cyclists on upstream sidewalk, pedestrians asked to use downstream sidewalk, outbound cyclists asked to loop under bridge to access Kendall. (The netting which broke free from the barriers in high winds has partially been removed, at least.)
 |
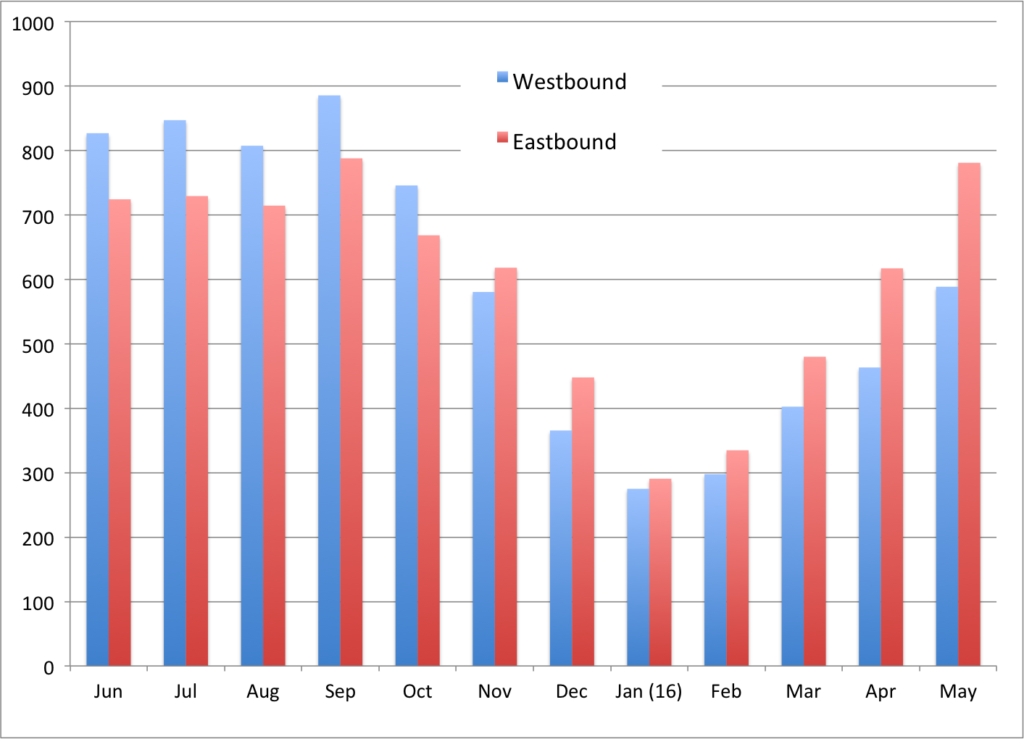
| Average bicycle traffic on Broadway. The westbound Longfellow lane has been impacted since Nov 9 2015. |
Back in 2014, nearly 400 cyclists used the bridge during the peak inbound commuting hour. Since then, there have been significant disruptions to the bicycling facility, so some traffic may have chosen alternate routes. When the outbound bike lane was closed in November, there was a marked drop in westbound cyclists on Broadway; this persists this spring as many cyclists seem to be avoiding the suggested loop-the-loop under the bridge. Yes, there’s data. See if you can tell when cycling west on the bridge was made more difficult?
This spring, eastbound cycling traffic in Cambridge has reached new heights, surpassing even last September’s average (although this could be due to the number of weekdays and weekend days averaged). Westbound traffic has dropped, owing to the bridge construction. Has eastbound traffic?
Yes. Slightly. The count on May 18 tallied a peak of 358 cyclists between 8:02 and 9:02. This corresponds to 392 cyclists counted at the Eco-Totem on Broadway between 8:00 and 9:15, or 314 per hour. (In other words, there are a few more cyclists crossing the Longfellow than there are at the Eco-Totem; i.e. more join the flow from Main Street and elsewhere across the bridge than leave Broadway after the Eco-Totem, or miss the counter entirely.) This drop could be due to a variety of factors, from construction to noise in the data. Hard to know.
This count was different than others since to see both sides of the bridge required sitting in an office high above the bridge. This meant, however, that I was able to see whether cyclists were using the upstream sidewalk, the roadway (sans bike lane) or, in a few cases, the downstream sidewalk (intermixed with pedestrians and some very narrow passageways under the turret reconstruction). The answer? Most cyclists use the upstream sidewalk. For Boston-bound cyclists, 95% used the upstream facility. For those coming to Cambridge, only 88% used the facility, but the absolute numbers were much lower, so that meant that only about 10 riders per hour were using the downstream sidewalk. While I wasn’t counting pedestrians, it seemed that most were using the downstream sidewalk, although this was the morning commute, which is not prime sightseeing time. Many of the upstream users seemed to be joggers, so at least their pace was better matched.
Westbound commuter counts were about even with the last count in 2014, although bizarrely the 2014 count peaked in the 8:15 range while the current count was highest around 8:45 (this could be noise in the data). There would probably be more marked differences looking at evening data; the Cambridge data suggests that many outbound commuters are avoiding the Longfellow in its current configuration.
What does this all mean? It means that most cyclists will roll with the punches as infrastructure changes, although the Cambridge data suggest that if it is too hard to use, cyclists will find other routes. It will be interesting to see how the upcoming phases change cyclist behavior as facilities are twice again shifted around the bridge prior to the final configuration. Finally, the Cambridge data is a great supplement to these counts, as it can give us a good idea of whether we counted on a high-use day or low, and such automated counts are obviously much more data-rich than simple eyes on the street, although it will take some time to build a multi-year data set to look at definitive trends. For instance: I counted more bikes in 2014, but there is no similar Cambridge data to compare that count to since the counter was only installed in 2015.
But next year’s count, well, that will have data. And the bridge might be shifted around. Again.

Ari, Thanks for all the hard work on this!
For what it's worth: I commute from Medford Square to down town. In the morning I usually take Rutherford Ave across the Washington St Bridge. It's a more direct route, utilitarian, I gotta get to work.
In the evening I take the Longfellow because it's nice to go home at a more leisurely pace and see people in Kendal, Inman, and Davis Squares.
I wonder how many other Longfellow commuters use different paths morning/afternoon. Effectively impossible to measure, but something to note.