In April, I wrote about how the eclipse was a microcosm of larger traffic congestion patterns, and promised that I’d post a follow-up after the event.
It’s been a busy summer, I’ve posted two blog posts, seen the northern lights in Gloucester, traveled Zurich, DC (thrice), Philly, Hawai’i, Wisconsin, Chicago, Minnesota and San Francisco (twice) and had one child (buried the lede), so obviously I now have ample time to write Good Content on the Internet between diaper changes. Or, at least, to compile my traffic report from the eclipse.
Our Story
I’ll start with our eclipse story. My original plan had been the Price Chopper parking lot in Derby, Vermont, which would put us in a good spot to leave the eclipse and beat the wave onto I-91, riding the crest of the wave down I-91 to I-89 (or potentially going “cross-country” on Route 25) and avoiding Franconia Notch’s bottleneck. However, looking at traffic on Sunday and figuring that we might hit too much traffic going north on Monday, we changed plans, instead going further north into Maine where we expected much less traffic. With clouds pushing east to Syracuse, I assumed that Vermont and New Hampshire would be even more overrun with eclipse-hunters from Pennsylvania and New York pushed east, but that Maine would seem far enough away to attract fewer people (with more lanes going north), even though, without traffic, Bangor is only 1:30 further from New York than Burlington. So we traded the potential of long delays for a much more reliable 4:30 to 5:00 drive.
(It turns out that, based on this thread, I was pretty much right.)
We piled six people in my sister’s minivan on Monday morning and set off for the eclipse. We had clear sailing through Maine and were aiming for Greenville to meet a friend at the airfield there (he has a two-seater aircraft and was one of hundreds of aircraft there). We had strong road trip vibes, stocking up with snacks at the Portland Trader Joe’s and gas at a gas station in a small town having their busiest day on record (we asked). We skirted through small towns to Guilford where, following my dad’s directions and against my better judgement, I took what Google Maps was telling him and not the main road, going through Edes Corner and North Guilford to Monson.
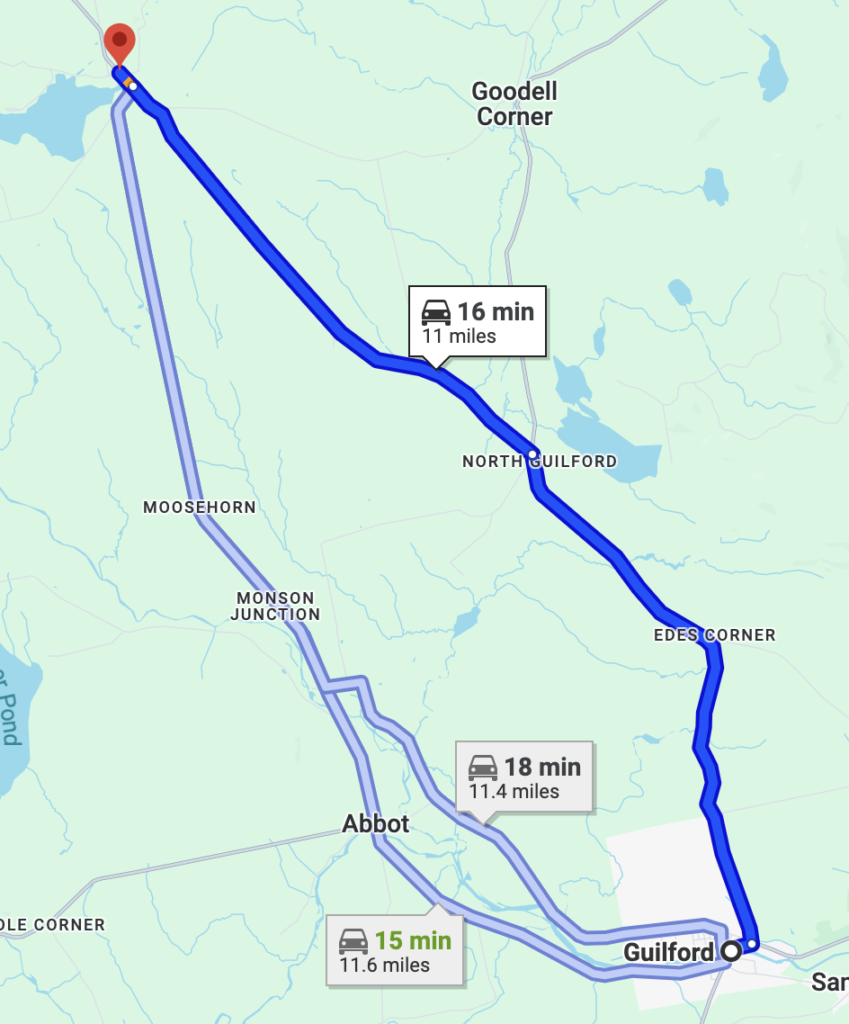
About a mile south of Monson we ground to a halt. Google Maps had suggested this route because it detected some traffic on Route 6 approaching Monson. However, our route had no cell service, and its algorithm, which had never “seen” congestion on the road before, must have assumed that any reports of congestion from users were data errors, so dozens of vehicles (if not more) were funneled onto this road which ended at a stop sign (or a yield, where the main road has priority). Throughout history, this had never been an issue, peak summer traffic counts show this as a 300 vehicle per day lane feeding into a 2000 vehicle per day lane (AADTs of 600 and 4000, although measurements in the summer, so actual AADT is probably lower since traffic volume here is seasonal). But today, with constant traffic on Route 6, the side road leading in stacked up a mile back. I was a bit frustrated with my dad for leading me into something I had told him not to do (we never should have had a map on a phone open but instead been using our DeLorme, which was on the dashboard of every car we saw parked in Monson) but we were in totality, so this transgression was forgiven.
After half an hour on this roadway, we reached Monson, 10 miles (and about 20 eclipse seconds) short of our destination and well into totality, and decided to set up camp with hundreds of others there. (Potentially a stroke of good luck, as the airport in Greenville would have been a few extra seconds of totality, and potentially an extra hour of driving). I repositioned or vehicle for a quick getaway and repositioned our watching party to be across the street from the vehicle for the eclipse.
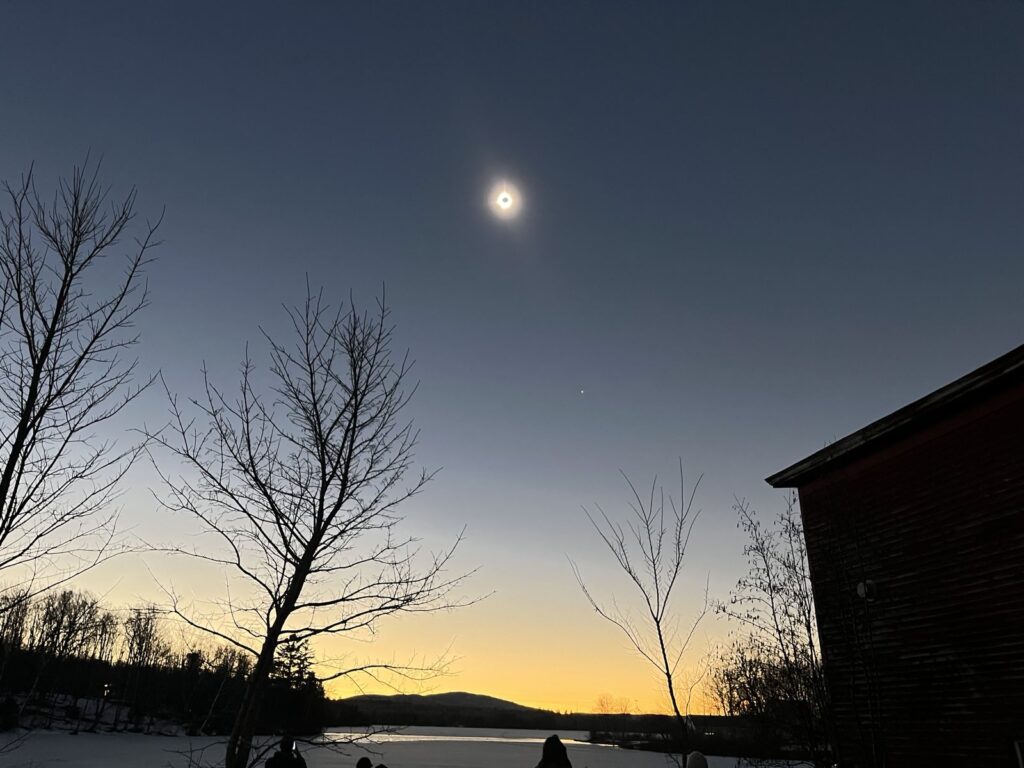
Thirty minutes before showtime, traffic in the town disappeared. It felt almost apocalyptic as hundreds of people stood in a dimming sun (but still bright above a frozen, snow-covered lake) as the sound of vehicles disappeared and all we heard was the wind, birds, and voices. The eclipse came and went and was well-worth the trip.
Now, it was showtime. My plan was to avoid potential merges and bottlenecks going south towards the highway, hoping to get to I-95 before enough of a wave formed to cause highway slowdowns. This meant avoiding the route through Guilford, and instead taking Maine Route 16 (AADT 400) to 151 (AADT 300) to Athens, and then going straight south from Athens to cross the Kennebec River in Hinckley to Route 201. This route would mostly be avoiding roads with multiple branches funneling into a trunk towards the Interstate, and would in theory have minimal other traffic trying to go in the same direction.
Maine was much easier to get out of than New Hampshire or Vermont because there isn’t a range of mountains between totality and civilization. The bottlenecks are instead major river crossings—in our case, the Kennebec—and small towns with merging traffic. Our route avoided nearly every town, and we crossed the Kennebec on a small bridge which didn’t have a long trunk feeding into it. The plan was set, but with no cell coverage, we had no way to see if there were backups forming anywhere along the route.
Our route was mostly sound, with the potential bottleneck of Athens, population 952. I didn’t worry too much about leaving town, there were two roads entering with very little catchment, and three exiting south. We came in on route 151, and while 150 was a diagonal route with relatively low demand on eclipse day, it was the primary road (AADT 1900) at that merge, and Route 151 backed up. (We had no cell reception; but almost took a route around Athens which would have potentially saved a few minutes, unfortunately, the traffic started after that point)
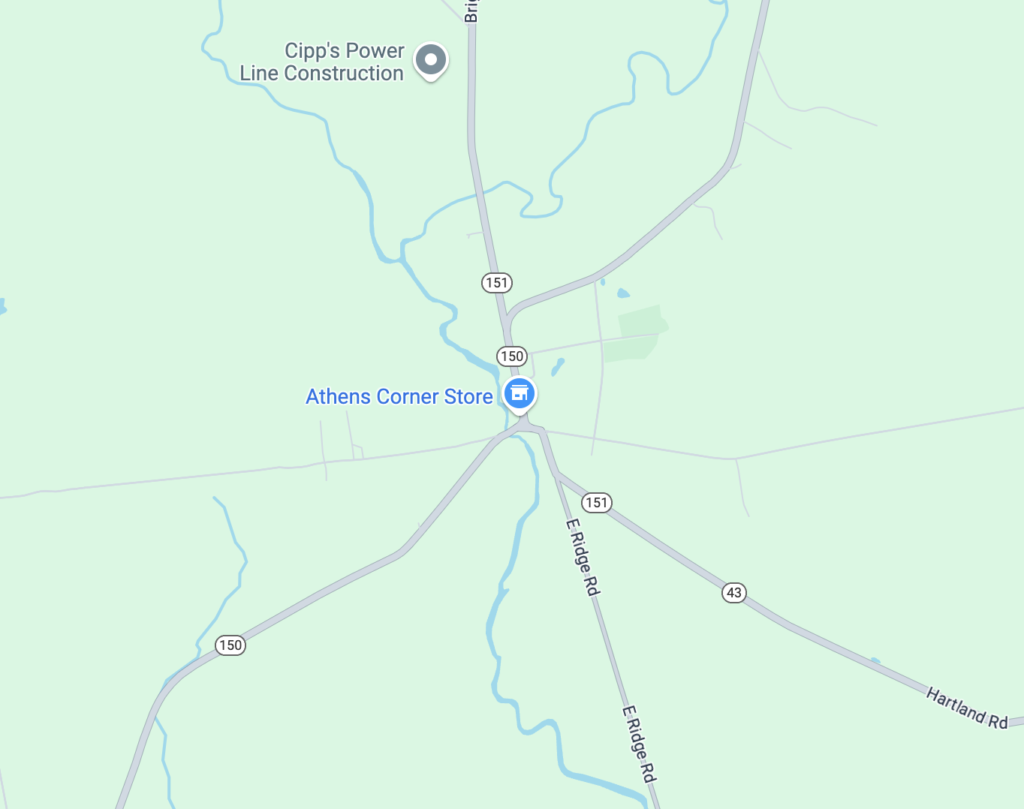
Once through this merge, we went straight down East Ridge Road (AADT 900) due south to the Kennebec, had no issue crossing Route 2 (an east-west route on a day with north-south traffic) and spent a couple of minutes in traffic crossing the Kennebec before smooth sailing to Portland for dinner and the rest of the trip to Boston. How did everyone else fare? Let’s find out.
Traffic in counts in Vermont
The track of the eclipse was almost perfectly-situated for traffic jams in northern New Hampshire and Maine. The eclipse path was situated in a more east-west orientation across New England, with most viewing areas in or north of the mountains. Given the mountains, this leaves only three main north-south routes in Vermont and two in New Hampshire. In Vermont, Route 7 runs east of Lake Champlain, with some parallel roads further east but with bottlenecks. Further east, I-89 runs north from White River Junction to Montpelier and Burlington, the latter segment in totality running east-west along the line of totality, a good collector for traffic flowing south (but with limited capacity). East of there, I-91 runs along the Connecticut River, with minor roadways (Route 10 and others) on the New Hampshire side. Other roads in Vermont are circuitous and low capacity. New Hampshire has two main north-south roads through the mountains, Franconia Notch and through North Conway (Route 16 and Route 302, with significant bottlenecks there). Unlike the interstates in Vermont, every roadway in New Hampshire has a single travel lane in each direction, even Franconia Notch, which was built as a two-lane parkway after decades of legal wrangling and eventual compromise. This is generally not an issue other than peak foliage weekends in the autumn. And, it turns out, the eclipse.
Vermont has a number of continuous traffic data points which we can use to dig into these data. One of these is on the short portion of I-93 in Vermont between the Connecticut River and St Johnsbury. While this was in totality, it was near the southern edge, so most traffic was continuing north. (I heard one report from people who made it to the southern bit of totality just before the eclipse, watched the eclipse, and were the first on the road back, making it back to Boston in under three hours.)
These charts shows northbound and southbound traffic on the day of the eclipse. Blue lines show northbound traffic (towards the eclipse) with red lines showing southbound traffic (away from it). Dashed lines show the normal traffic for weekdays.
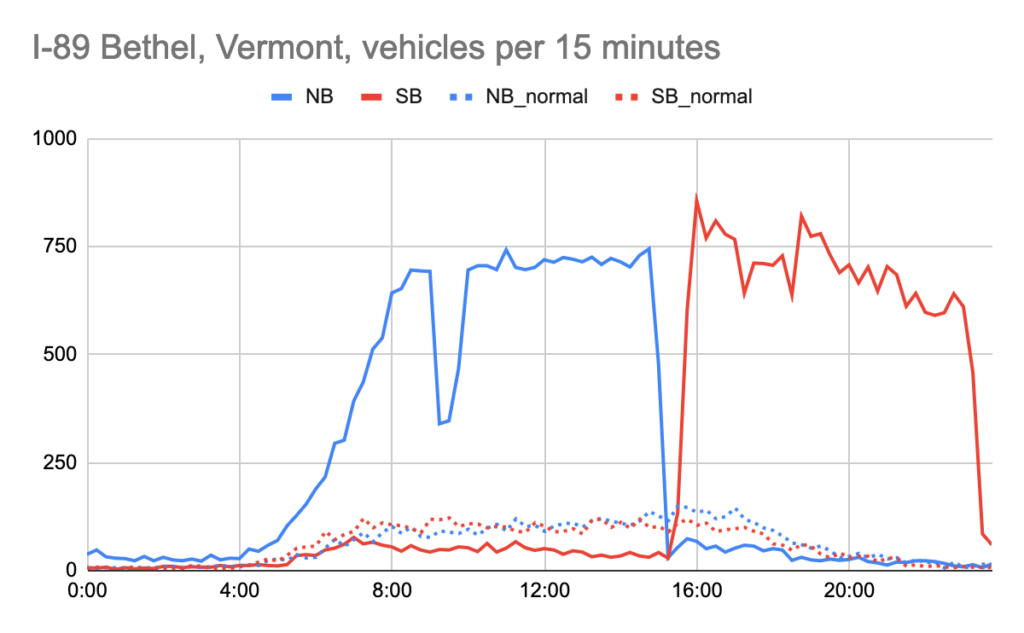
I-89 in Bethel, Vermont is a counter on the north-south portion of the roadway just south of totality. This shows the traffic volume going in and out of Vermont before and after totality. Observations:
- Some people drove north overnight. Typical overnight traffic bottoms out around 30 vehicles per hour, the day of the eclipse there were about 100 vehicles per hour even between midnight and 4 a.m., when volumes increased.
- Volumes increased to about 2800 vehicles per hour, which is the capacity of the roadway, dropping around 9 a.m., which was likely due to an accident or other event blocking throughput. 2800 vehicles is the approximate capacity of a two-lane roadway, and about 7 times normal.
- 15-minute traffic counts dropped from 744 between 2:45 and 3:00 to 29 between 3:15 and 3:30, a 26-fold decrease
- Non-peak traffic was well below normal all day, with about 30% of normal before and after the eclipse.
- Almost immediately after the eclipse, the roadway returned to capacity, but in the other direction, peaking above 3200 between 4 and 5 p.m. Traffic levels decreased somewhat but stayed elevated until nearly midnight when they finally decreased.
- Overall, this portion of I-89 processed about 48,000 vehicles on eclipse day, four times more than normal.
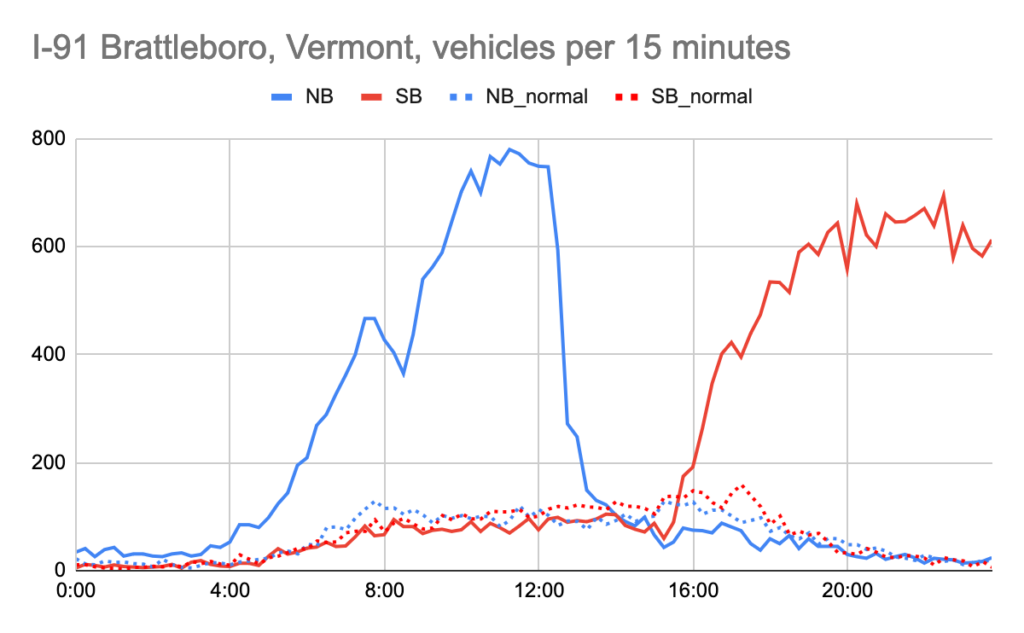
Our next data point comes from I-91 near the southern border of Vermont, about two hours south of totality (without traffic).
- As with I-89, traffic was higher than normal overnight and began to pick up around 4 a.m., peaking close to 3000 vehicles per hour (about 8 times normal) until a steep dropoff around 12:15, since if you weren’t through by that point you had little hope of making it to totality (although traffic did remain elevated for another hour).
- It mostly stayed below average for the afternoon, but only somewhat, before returning to normal.
- Southbound traffic was elevated the rest of the day, around 2400 per hour. These rates were lower since traffic had been metered at various bottlenecks further north, but the further-south location means that traffic remained elevated until well after midnight.
- The roadway processed 19,000 vehicles northbound and 21,000 southbound, with a normal of 6000 in each direction.
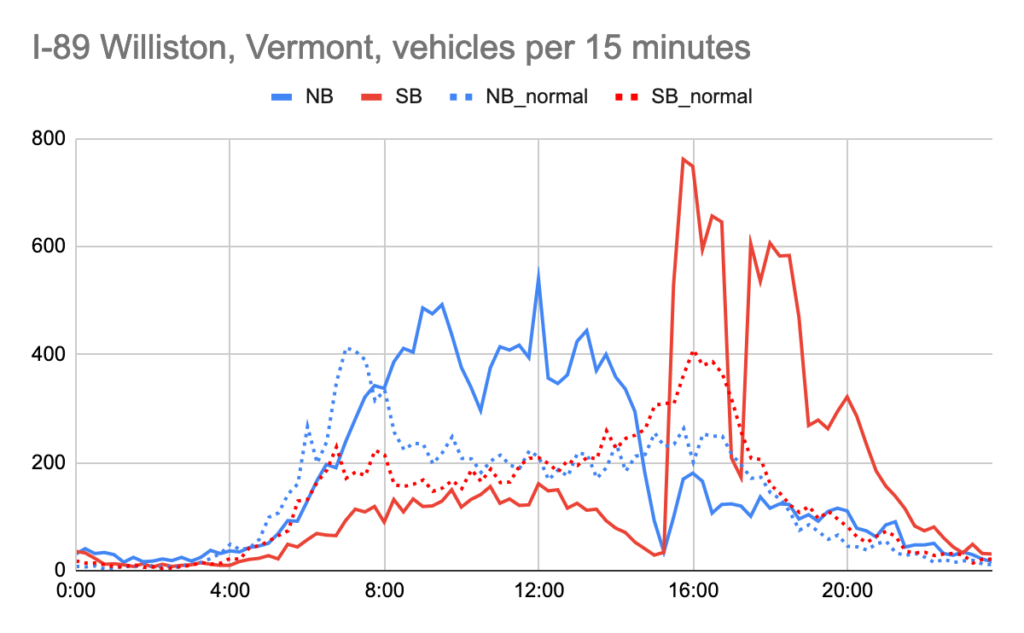
I-89 in Williston shows traffic in a higher-volume area in totality, where traffic has some commuter patterns in and out of Burlington, with higher northbound traffic in the morning and southbound in the afternoon. It is also well within totality, so significant traffic volume had exited the highway at this point.
- Here traffic volumes did not begin earlier than normal. Northbound traffic actually was delayed, since it was not commute-based, and rose higher than normal but never reached 2000 vehicles per hour.
- Southbound traffic was lower than normal all day, as normal commuting patterns did not occur.
- At eclipse time, traffic fell far below normal. There were just 67 vehicles during the 15 minutes of the eclipse, just 12% of normal. Given that, we can surmise that nearly 90% of people were watching the eclipse!
- Northbound traffic then spiked but, given that it was in totality, began to drop by 7 p.m. and had fallen to normal by midnight.
- Here traffic was just about 20% more than normal, since normal traffic near Burlington is higher.
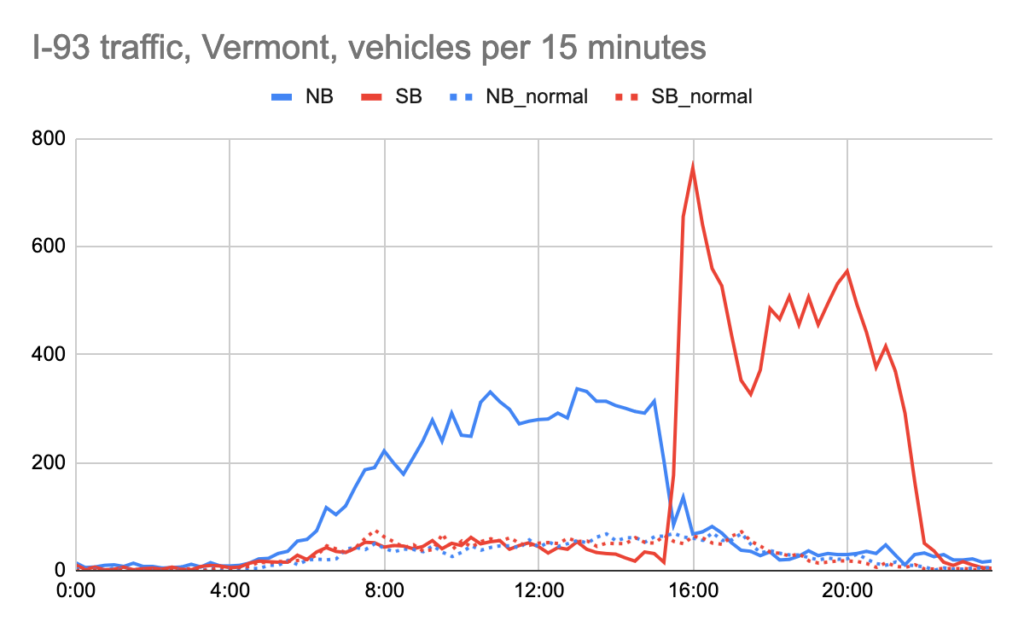
I-93 is the lowest-volume roadway in this dataset, running between the single-lane Franconia Notch and I-91 in St Johnsbury, with only about 5500 vehicles per day.
- On the day of the eclipse, northbound traffic began to increase around 5:30 in the morning, but never increased above about 1250 vehicles per hour, even though the volume of a two-lane roadway is double this. This is because Franconia Notch, about 20 miles south, metered traffic into a single lane, so there was no way for any more traffic to enter the roadway, and some of the traffic through the notch was exiting onto other roads in New Hampshire.
- During the eclipse, northbound traffic never fell below normal; these are likely latecomers who missed the eclipse (or watched it from the roadway, as this was on the very edge of totality). Northbound traffic returned to normal not long after.
- Southbound traffic was normal throughout the day until it began to fall off around 1 p.m. From 2:30 to 3:30, only 97 vehicles passed going southbound, just 40% of normal.
- After the event, southbound traffic spiked to nearly 2500 vehicles per hour quickly, but then fell off as upstream congestion and bottlenecks (probably mostly the single-lane offramp from I-91 southbound in St J). Volume fell back to half of this level around 5:30 before some bottlenecks cleared and traffic increased further to around 2000 vehicles per hour, which continued until 10 p.m. before falling back towards normal levels (these vehicles ran into a wall of traffic downstream which didn’t clear out until nearly dawn).
- The roadway processed about 11,000 vehicles northbound and 14,000 southbound. This is significantly lower volume than the other Vermont roadways (although more than four times normal, the highest ratio of these data sets), but because of the bottleneck at Franconia Notch, had the worst traffic.
Estimating the Franconia Notch Queue
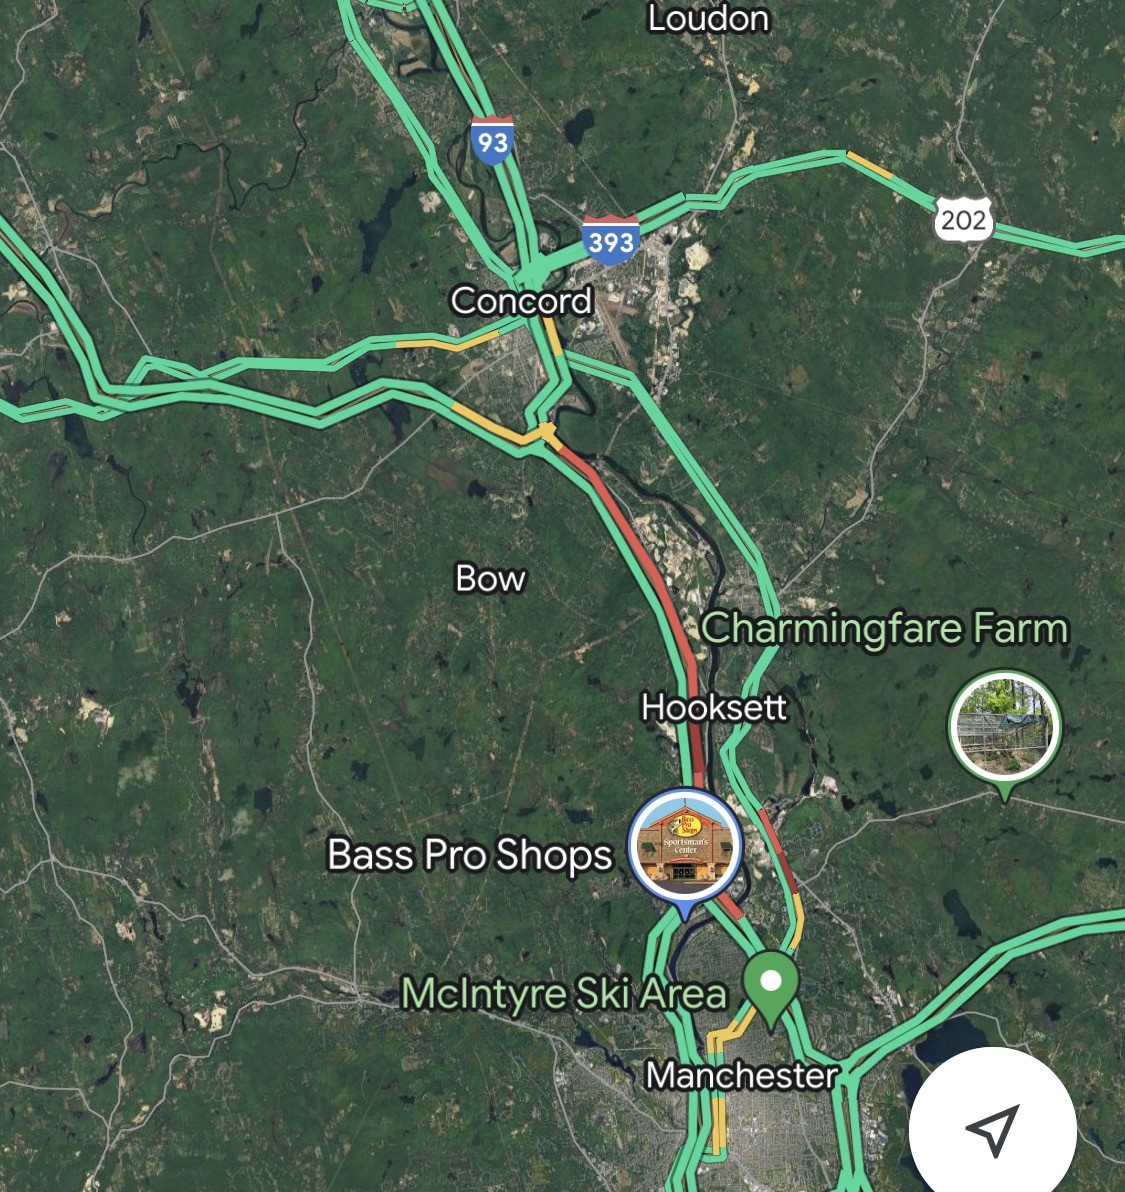
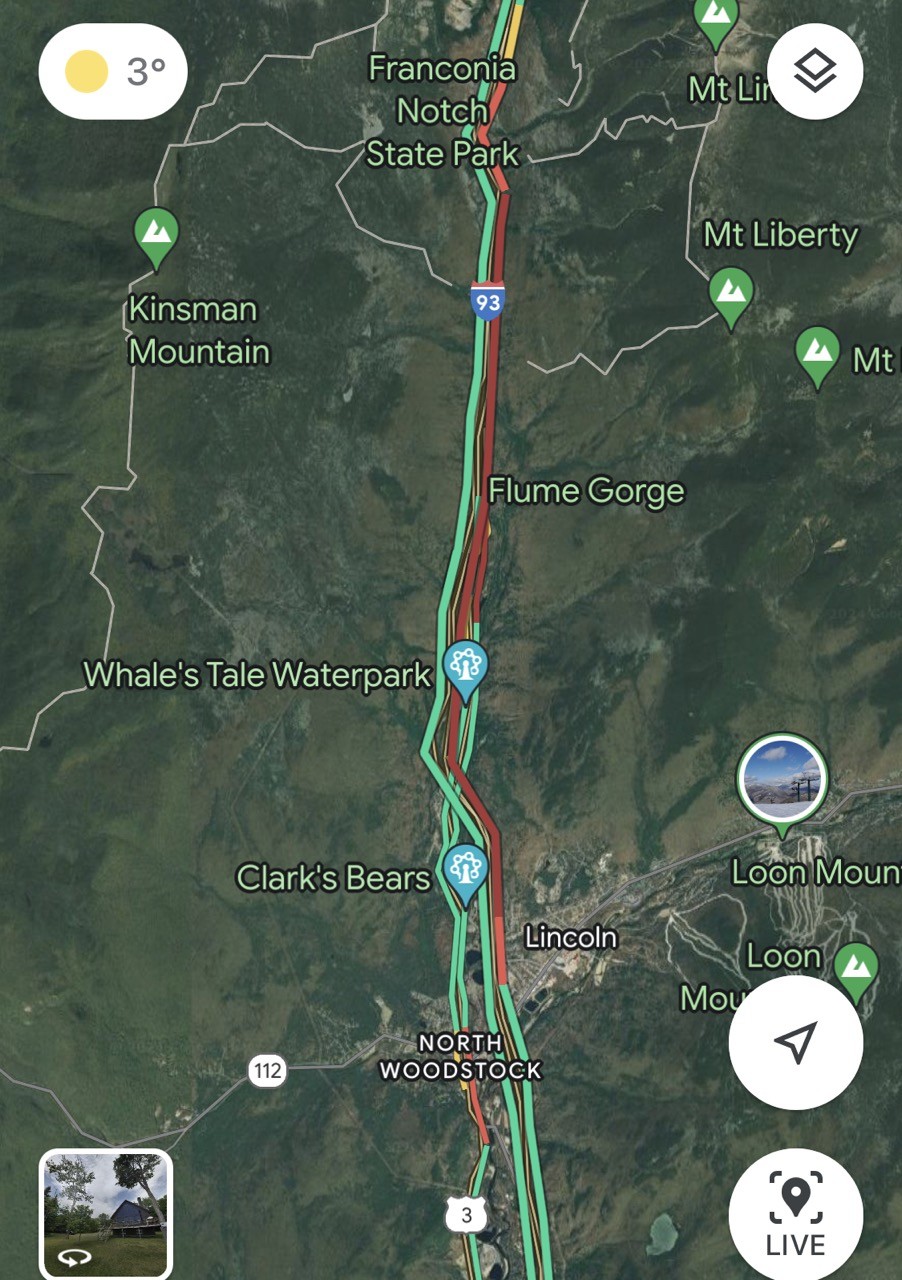
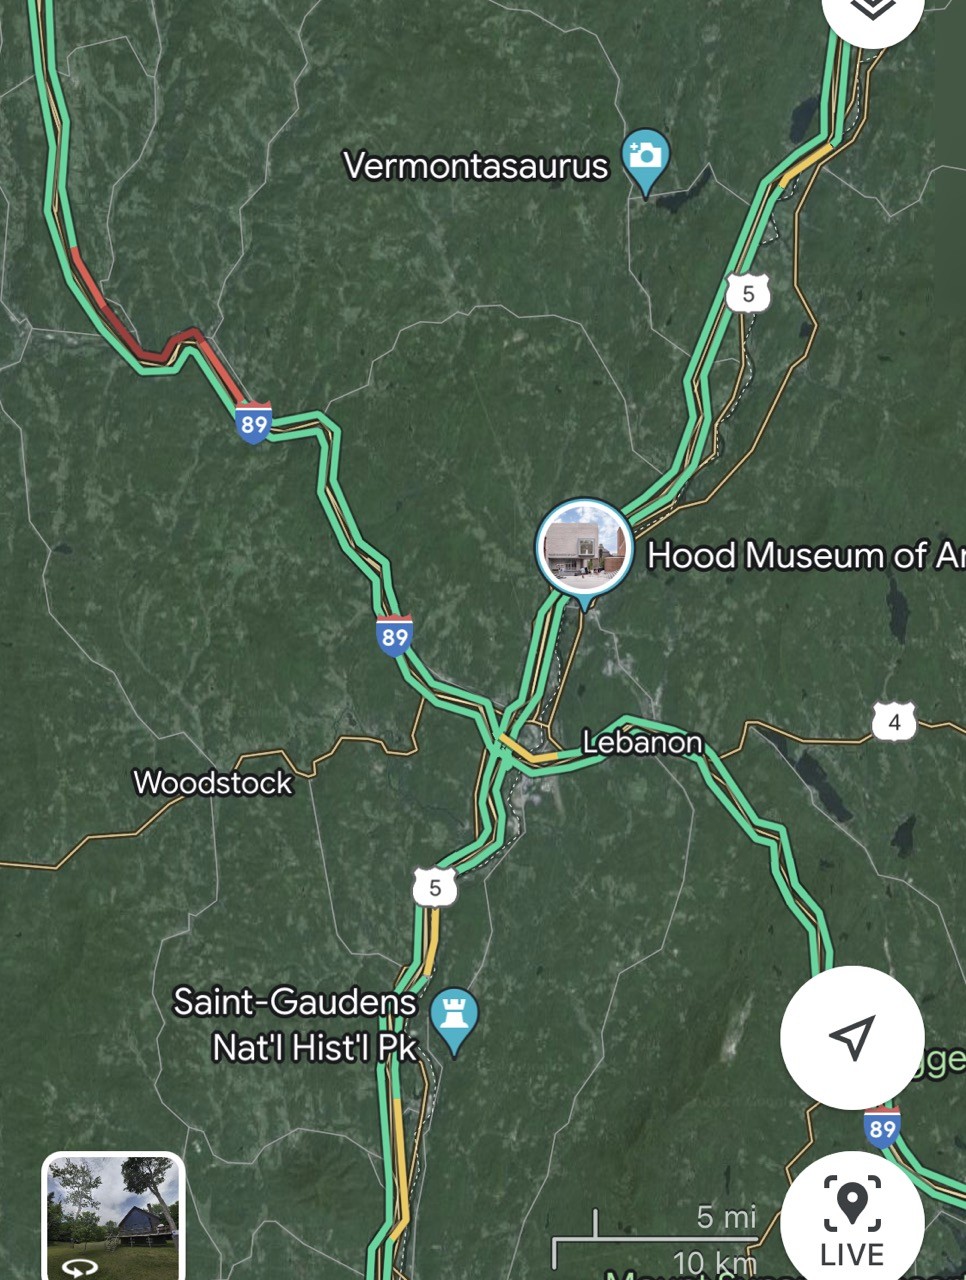
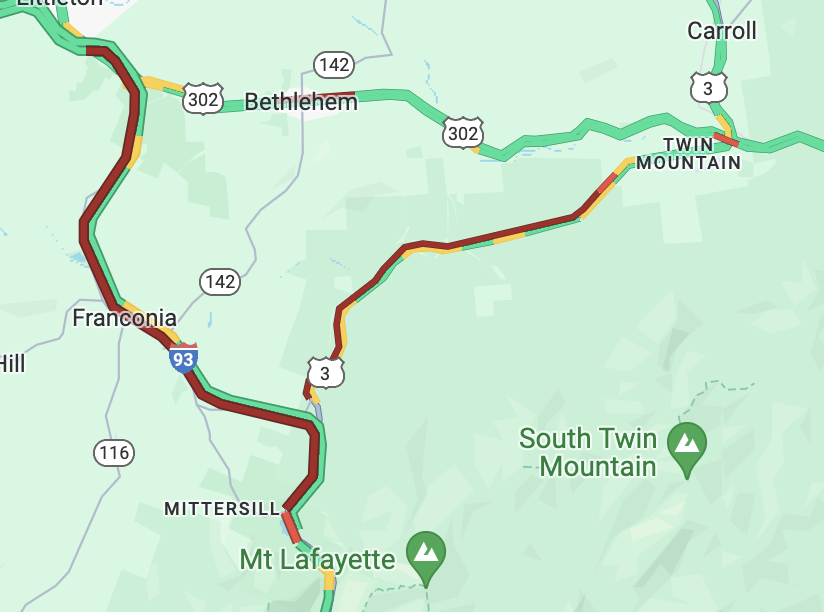
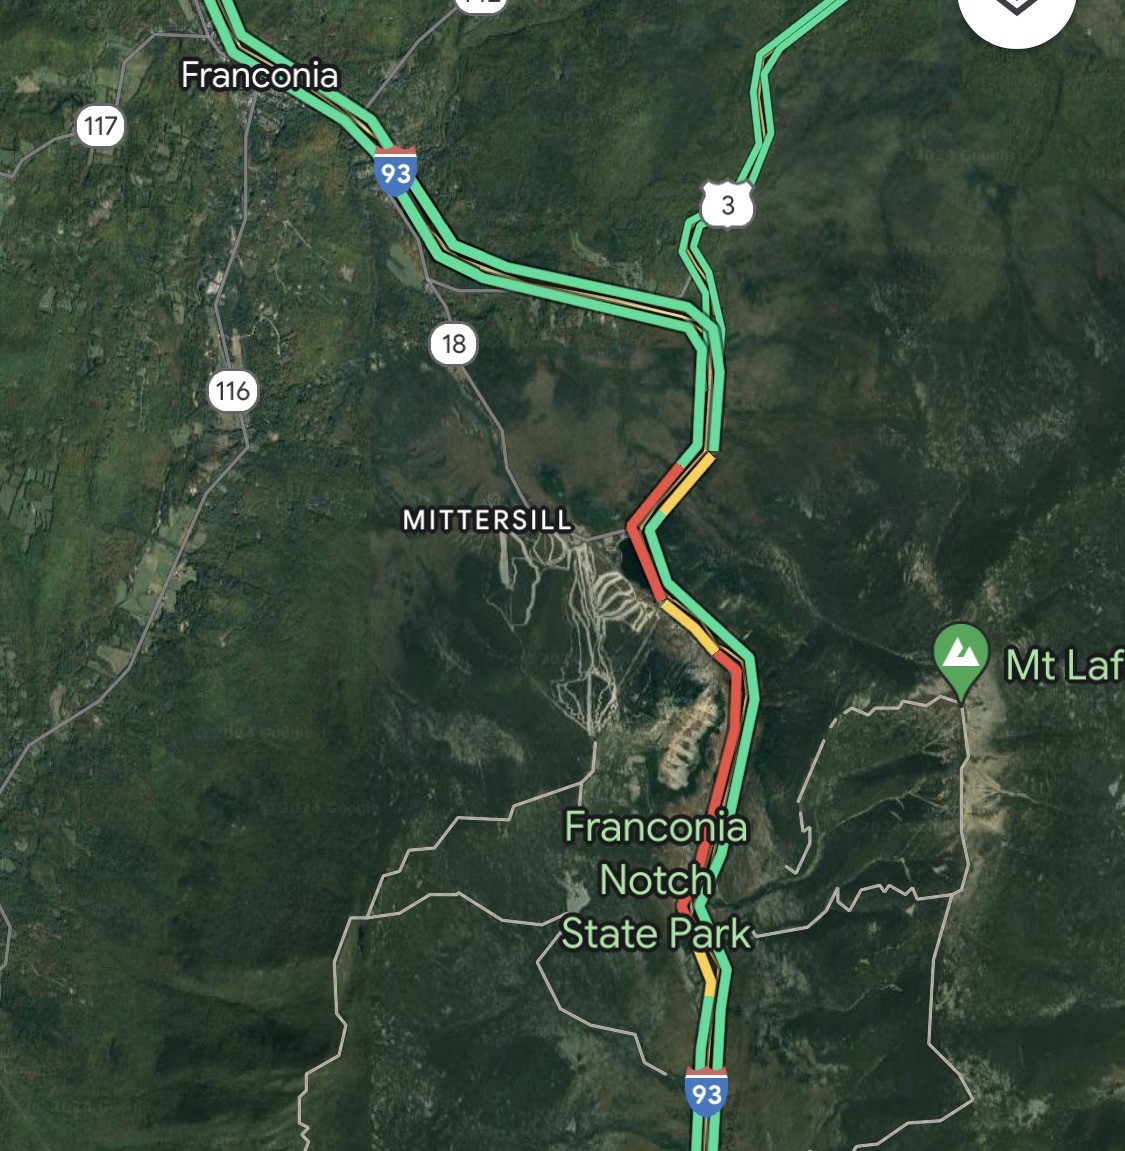
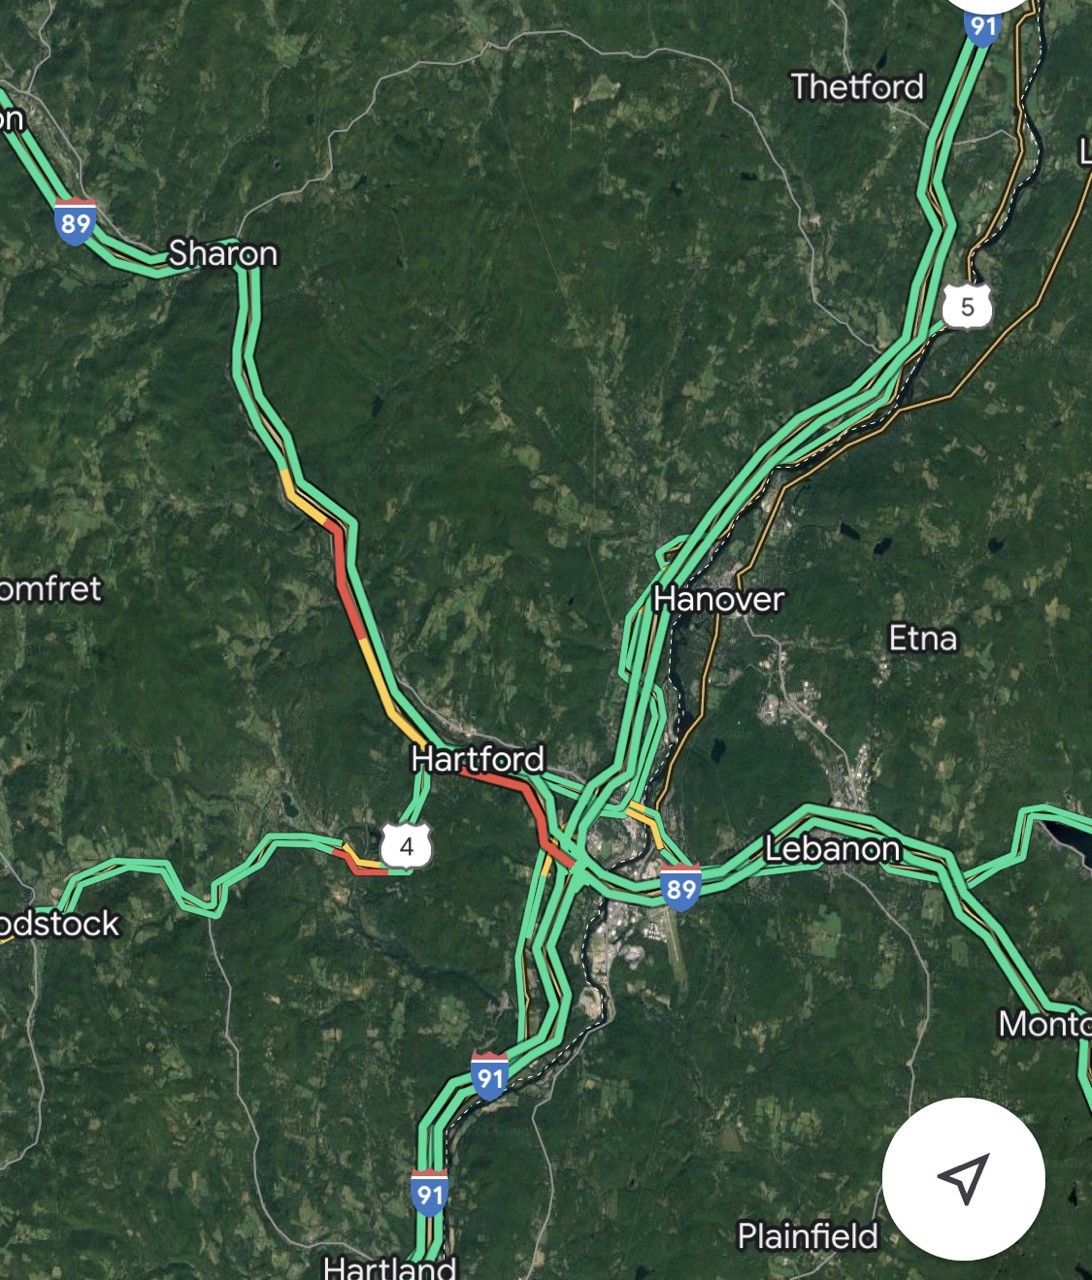
When I wasn’t driving and had cell reception, I took screenshots of traffic. Here was the situation at 10 p.m., nearly 7 hours after the eclipse:
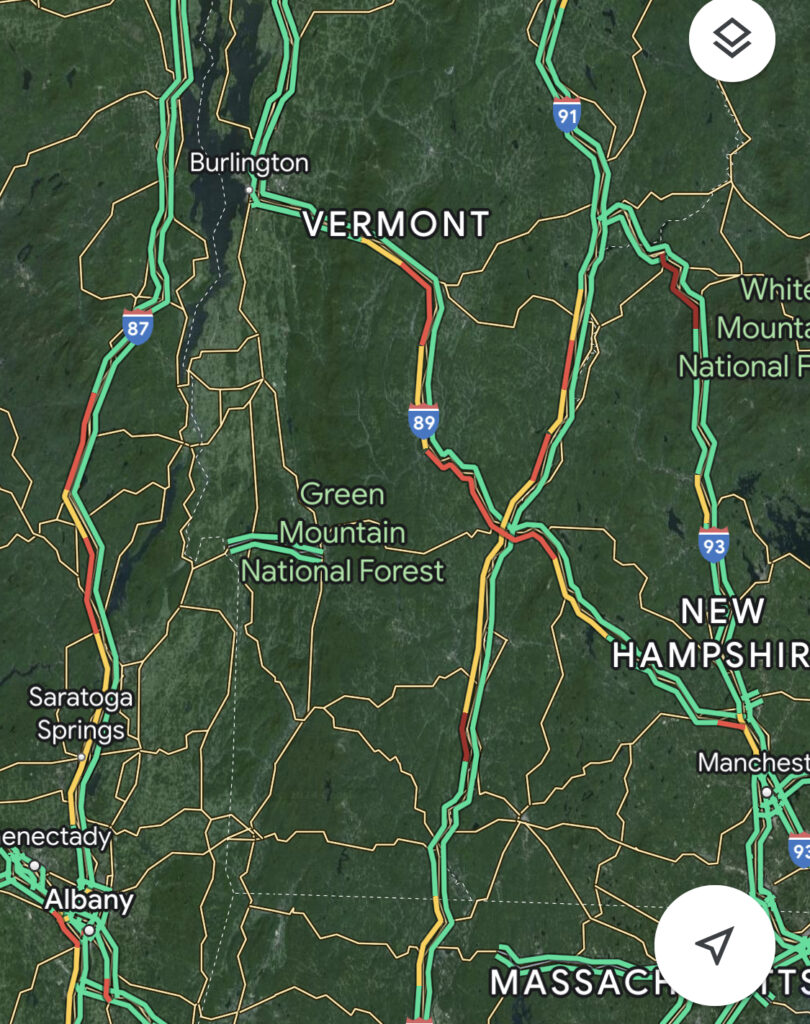
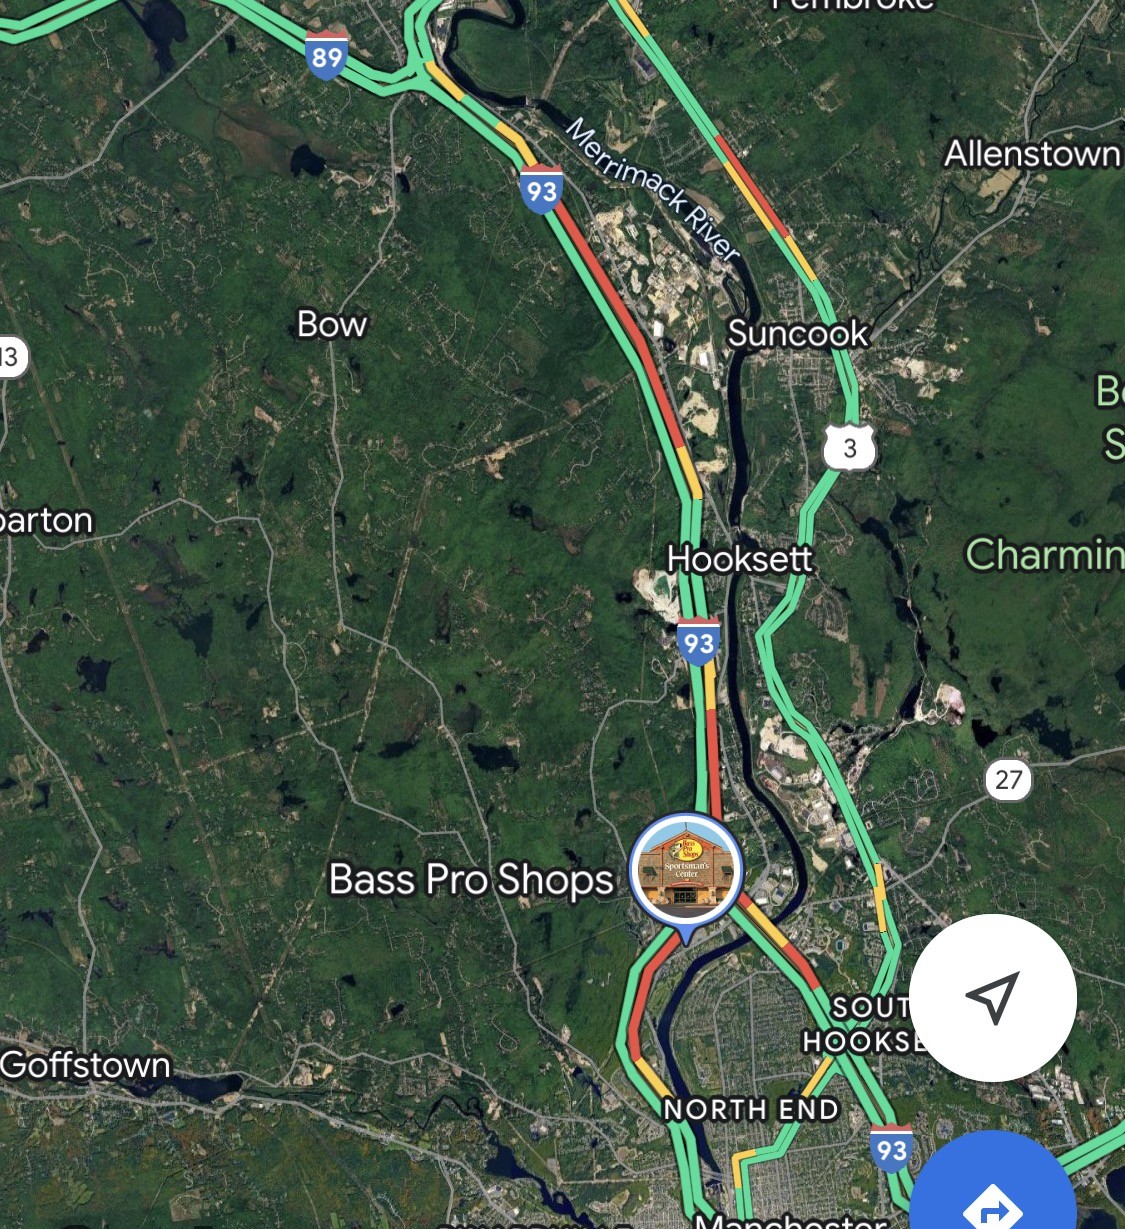
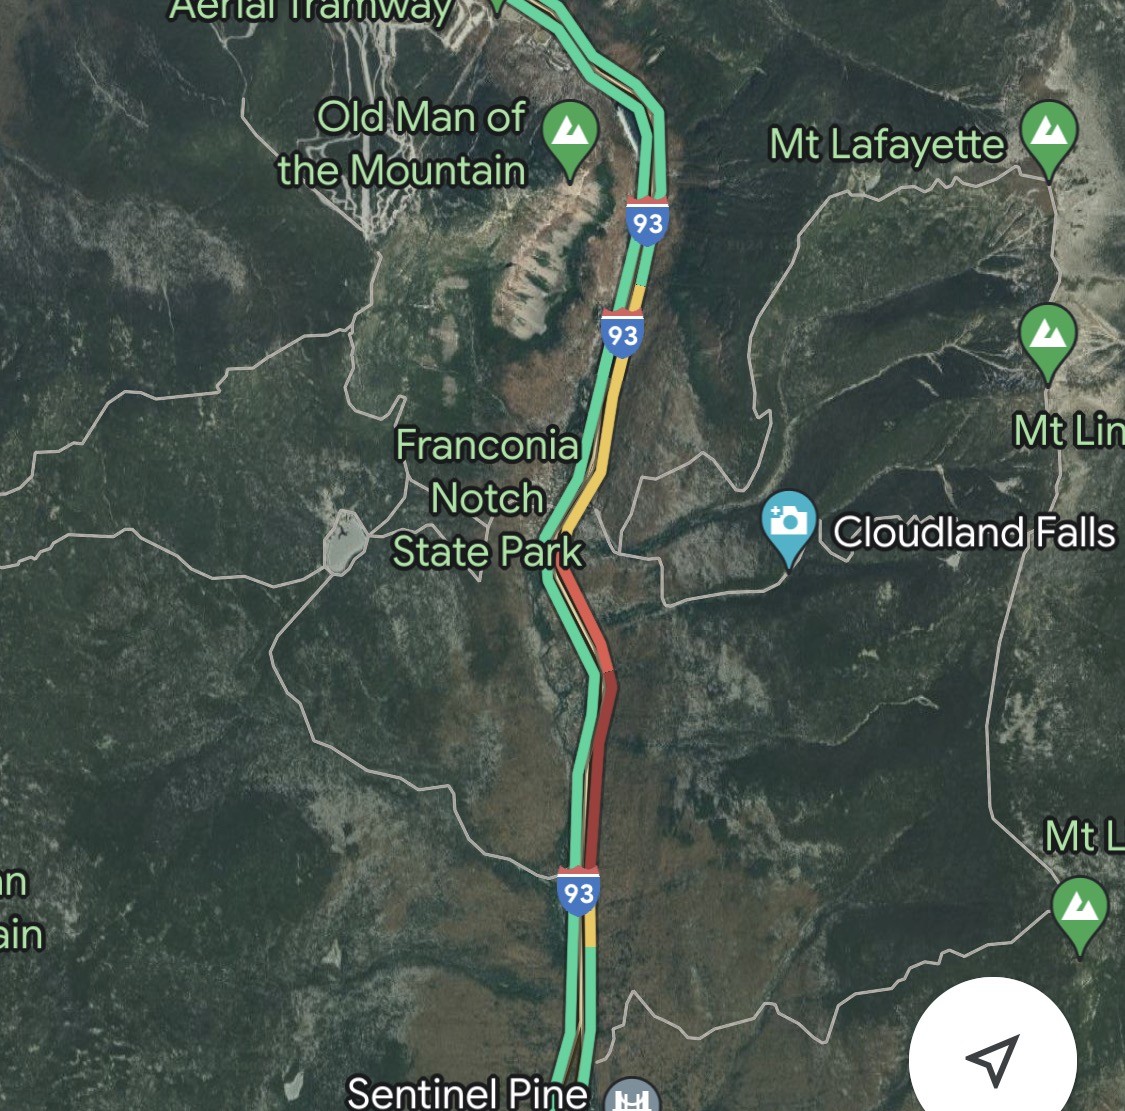
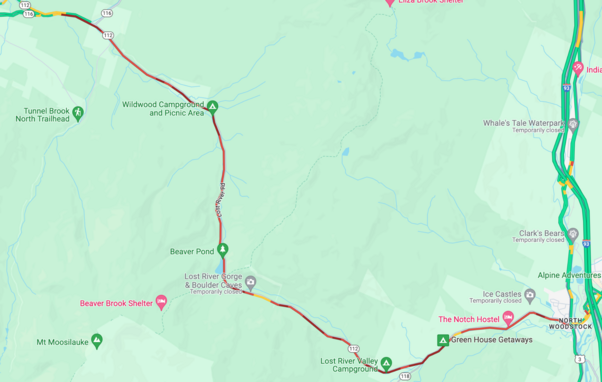
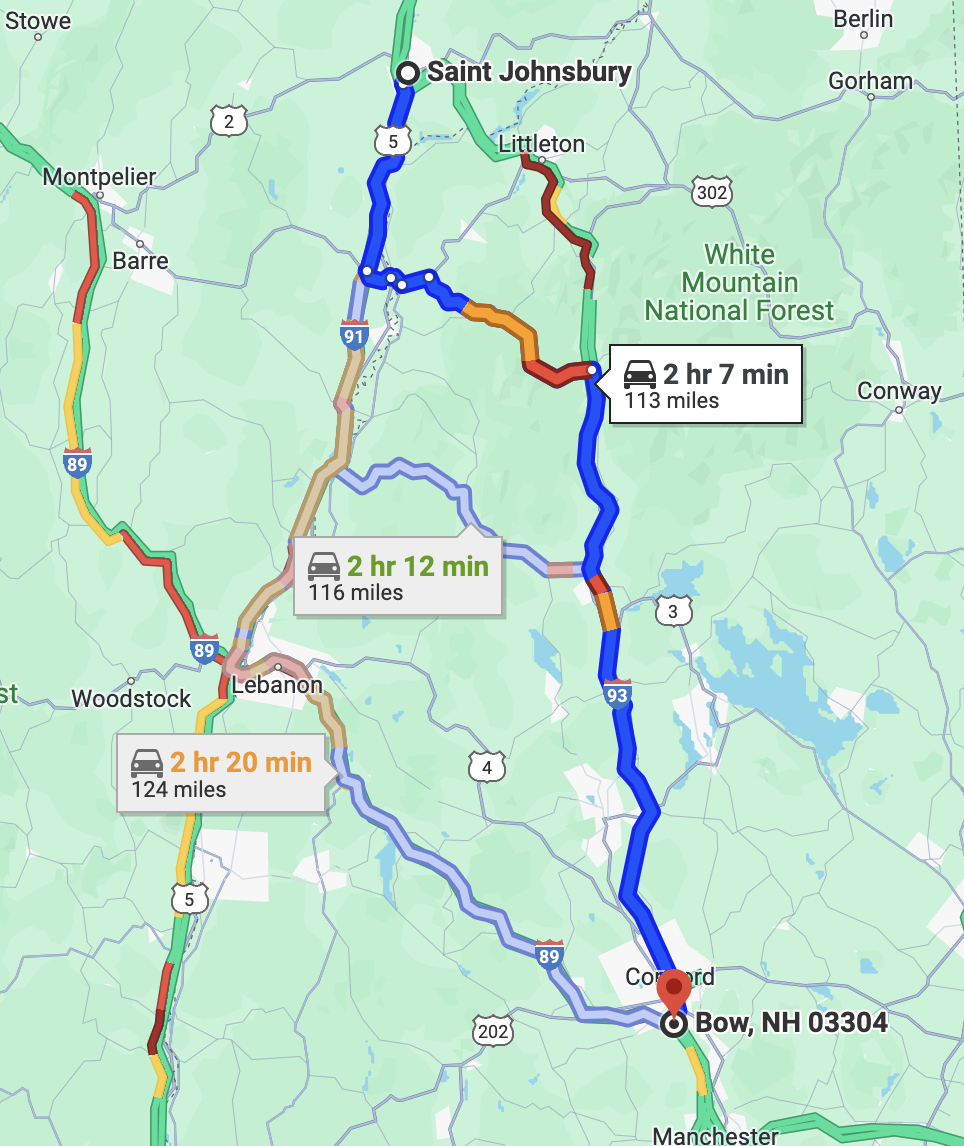
By this point traffic had mostly cleared out of the eclipse zone, but was stacked up on roadways flowing south. Some of these delays were bottleneck delays, notably at Franconia Notch where three lanes feed into one, but also approaching Concord where I-89 and I-93 merge. The latter has a minimal backup because of the metering effect of the notch, while I-89 is backed up because of the single-lane ramp onto 93. At 10 p.m. on a Monday there is minimal additional traffic and what traffic there is has already been metered upstream. The delays on the other interstates is mostly due to volume; with enough vehicles any friction (exit and entry ramps, minor collisions or other vehicles on the side of the roadway, curves, slow-moving vehicles) can create waves of congestion that back up; this is akin to rush hour traffic when there are move vehicles on the road than the road can safely process.
The worst traffic by this point was approaching Franconia Notch. I predicted it would be bad, but I’m not sure I knew it would be quite as bad as it wound up. Franconia Notch merges down to a single lane, and has not only two lanes of I-93 feeding it, but also Route 3 from Coos County in New Hampshire merging in just before the notch. We know from the I-93 southbound traffic counter that there were about 12,000 vehicles crossing into New Hampshire between 3:30 and 9:30, or about 2000 per hour. Let’s assume that there were an additional 1000 vehicles per hour entering in New Hampshire. 3000 vehicle per hour would cause some congestion on a two-lane highway. But 3000 vehicles per hour into a system which can only process maybe half that creates an exponentially-growing queue.
I am not qualified to write about queuing theory (but you can read more about it here) but one interesting tidbit is that it’s relatively recently explained; for instance, one of the theorems of queuing theory is Little’s Law, which is named after someone who died this fall (RIP Little). Queuing theory assumes random arrivals and allows a calculation of a queue length given arrivals and “servers” allowing systems to be optimized to minimize both queue length and overall capacity. So a bank may be okay with having a line which is 10 minutes long 5% of the time (when a bunch of people arrive) if it means they don’t have an additional teller who is idle most of the day. Or a traffic department may be okay with a two lane roadway if the third lane would only be required 30 minutes per day (although usually they’re happy to build the third lane).
For our purposes, it is important to know that when there are more arrivals than servers, the queue grows exponentially. This is why when there’s a major snowstorm, airline call center times can be days long: the airlines don’t have the ability to expand their staffing levels to meet demand, and once the system is over capacity, new people stack in line faster than they can be processed. In this case, a line of traffic formed north of Franconia Notch.
Let’s assume the Notch (plus the alternate route though Kinsman Notch, on a curvy mountain road with stop signs at the end, which also backed up) can process 1800 vehicles per hour. And let’s assume that the demand for the Notch is 1.8 times the traffic demand from 93 in Vermont. (This is based on reports and twitters that the queue cleared around 3:30 a.m.) We can use this to estimate the queue as follows:
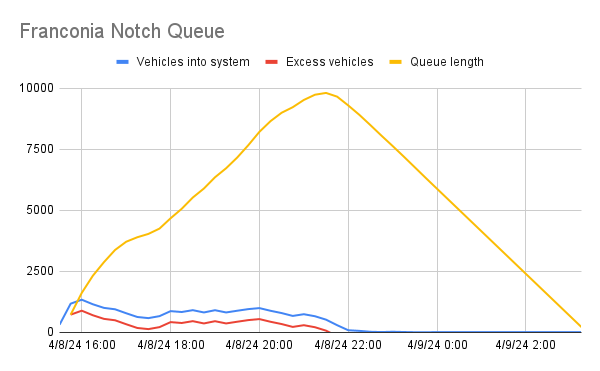
This shows the queue growing quickly after the event, slowing slightly before resuming growth, and reaching a maximum length of about 10,000 vehicles after 9 p.m. before arrivals fell below departures and the queue emptied out. Someone arriving at 9:30 would spend 5.5 hours in the queue crawling forward as vehicles were processed out before getting to the notch and resuming free-flow travel south of the notch (and would have already been in other queues if they’d started out from, say, Newport). This may be an underestimate, as some reports were of 12 to 14 hour trips from Northern Vermont to Boston, although additional delay may have accrued elsewhere: 4:30 p.m. leaving Newport, 9:00 p.m. getting to Littleton, 2:30 a.m. getting through the Notch, 4:30 a.m. getting to Boston. 10,000 vehicles across three lanes (two lanes of 93 plus Route 3) would be about a 15 mile backup, which is about what was observed on 93 and Route 3: back to Littleton and Twin Mountain.
People on Twitter and in the news asked two questions of NHDOT: why did they close exits onto Route 18 and why didn’t they reverse the northbound lanes in the Notch. The first of these is easy: it just would have moved the bottleneck, since it didn’t create new lanes through the Notch (Kinsman Notch was just as bad). The queues may have been shorter, but they would have moved slower. (This is why widening a highway without fixing a bottleneck doesn’t work, and also why lane diets like those on the Longfellow and Harvard bridges between Boston and Cambridge do: the bottlenecks aren’t due to the number of lanes on the bridges; reducing the number of lanes increases the length of the queue, but the queue moves faster.)
The second is a bit harder, but I’d guess that no one really knew how bad it would be and if they had, they would have come up with a plan. They would have needed a northbound detour, and given the mountainous roads nearby, this would have to be communicated dozens of miles south for larger vehicles (at least Plymouth via Route 25, if not Concord), which would have to have been established in time for the end of the event and run all evening. One lane of traffic could have exited at the north end of the Notch at Route 18, crossed under, and run southbound, before running south on Route 3 several miles to reenter I-93 at exit 33. Given the maneuver on and off of the highway and people switching lanes, the capacity probably would not have been a full lane of traffic, and long queues (although maybe not as long) would still have occurred.
Other eclipse bottlenecks
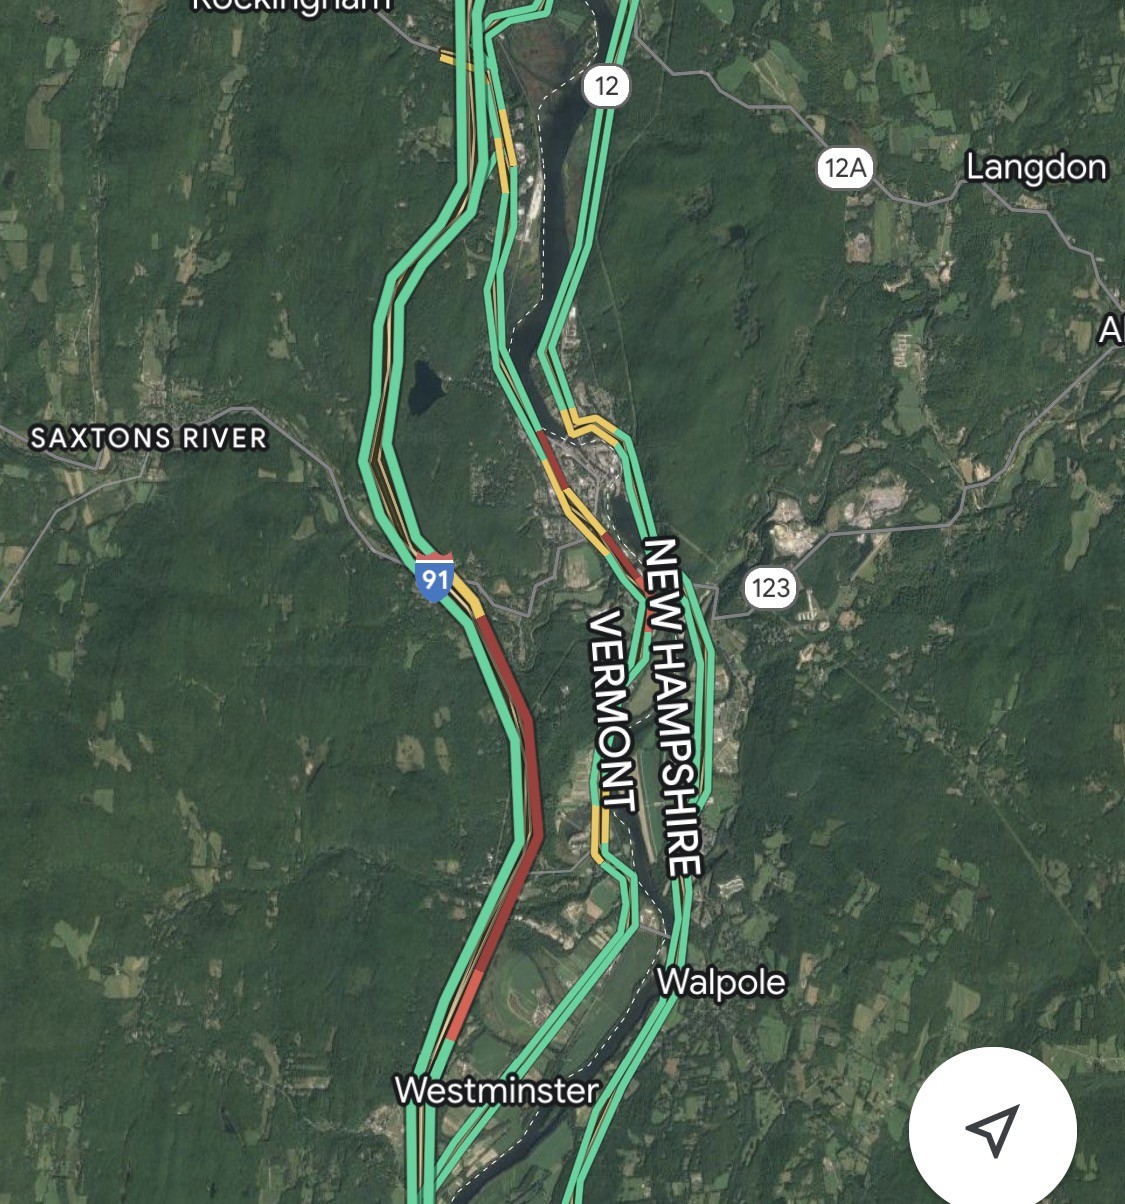
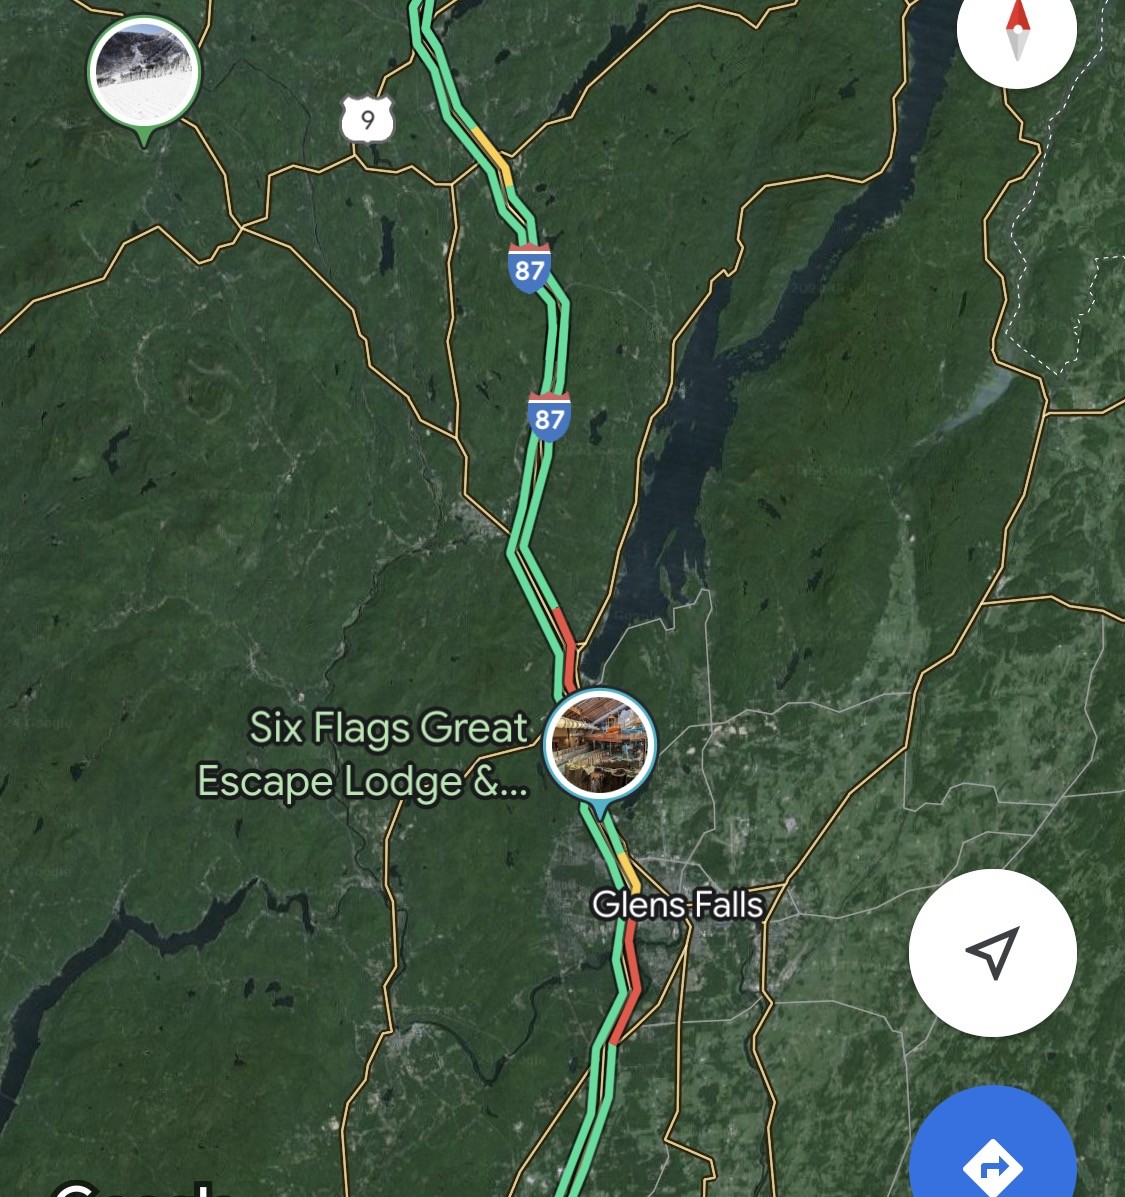
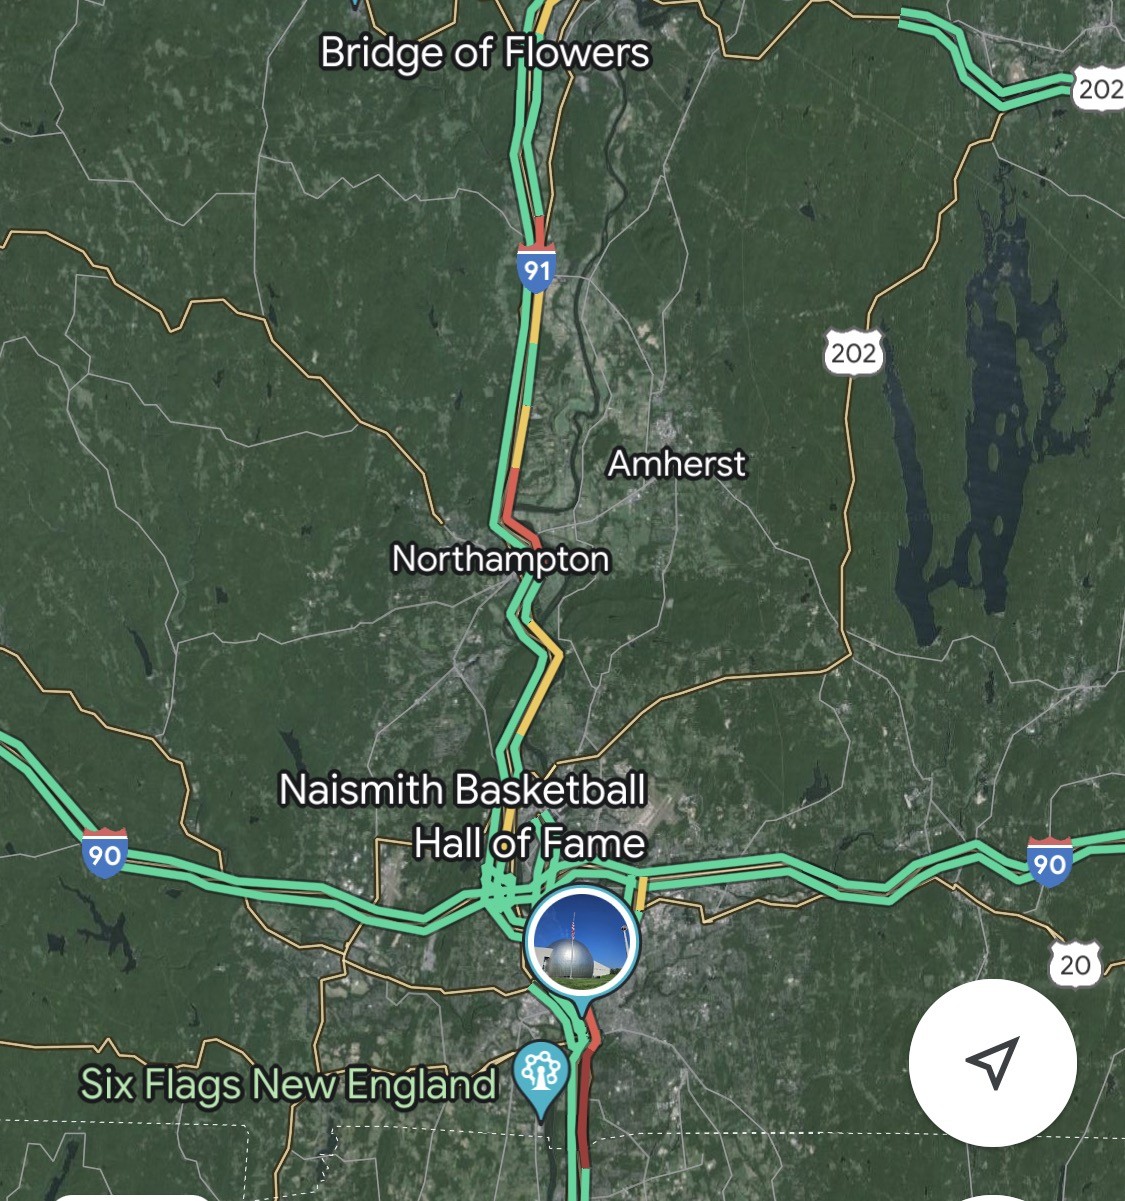
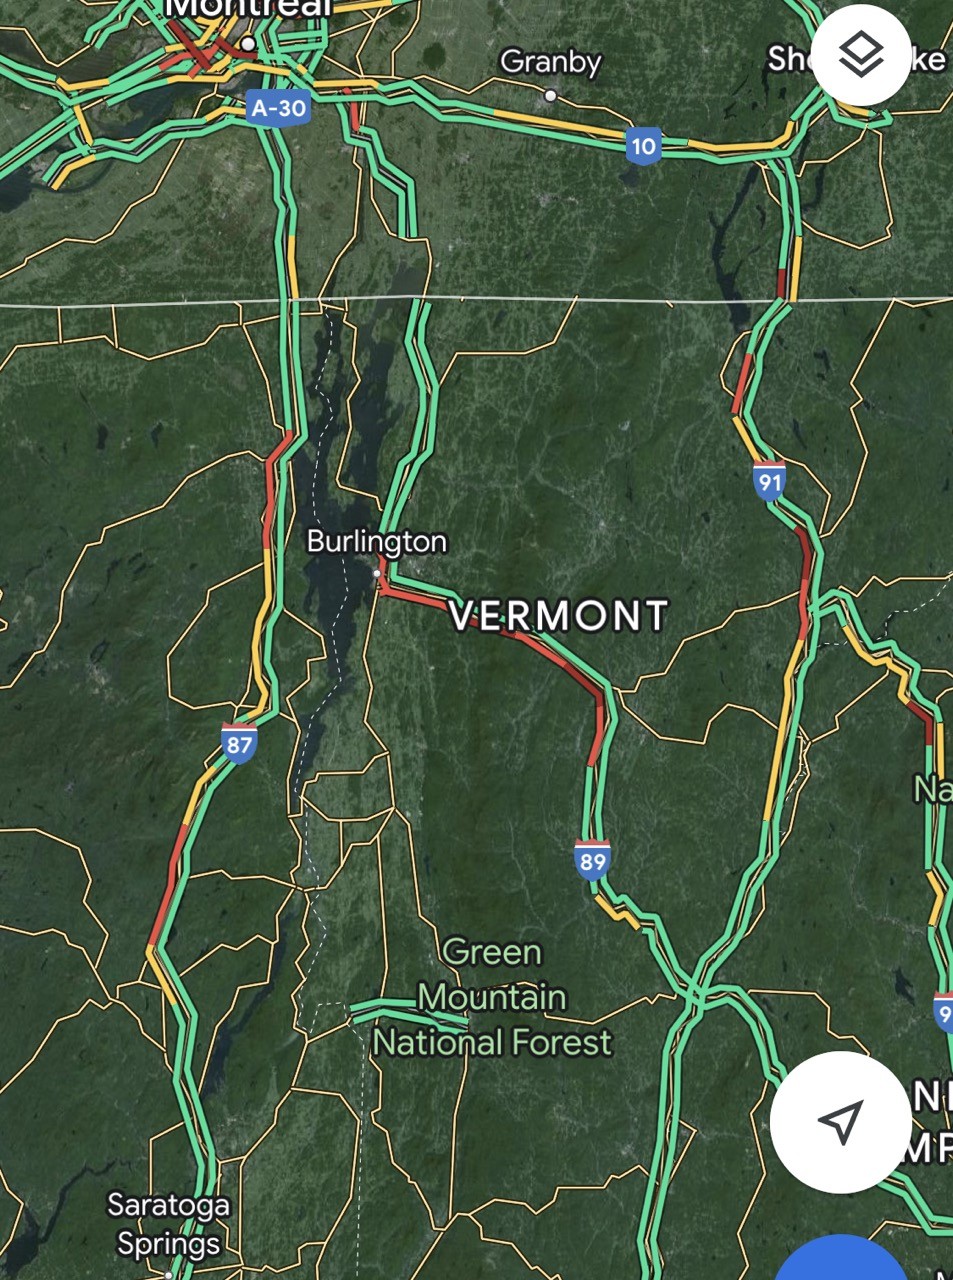
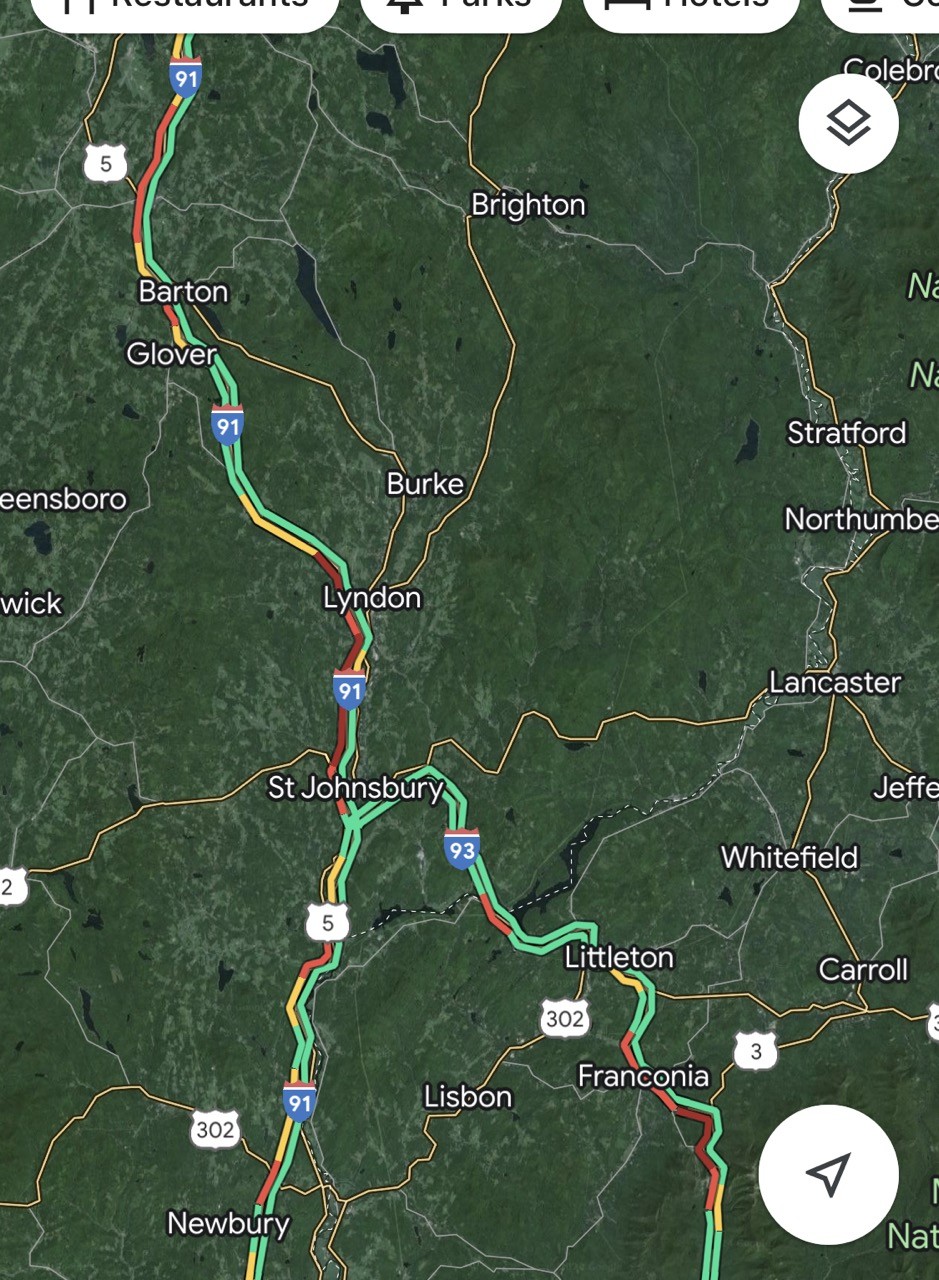
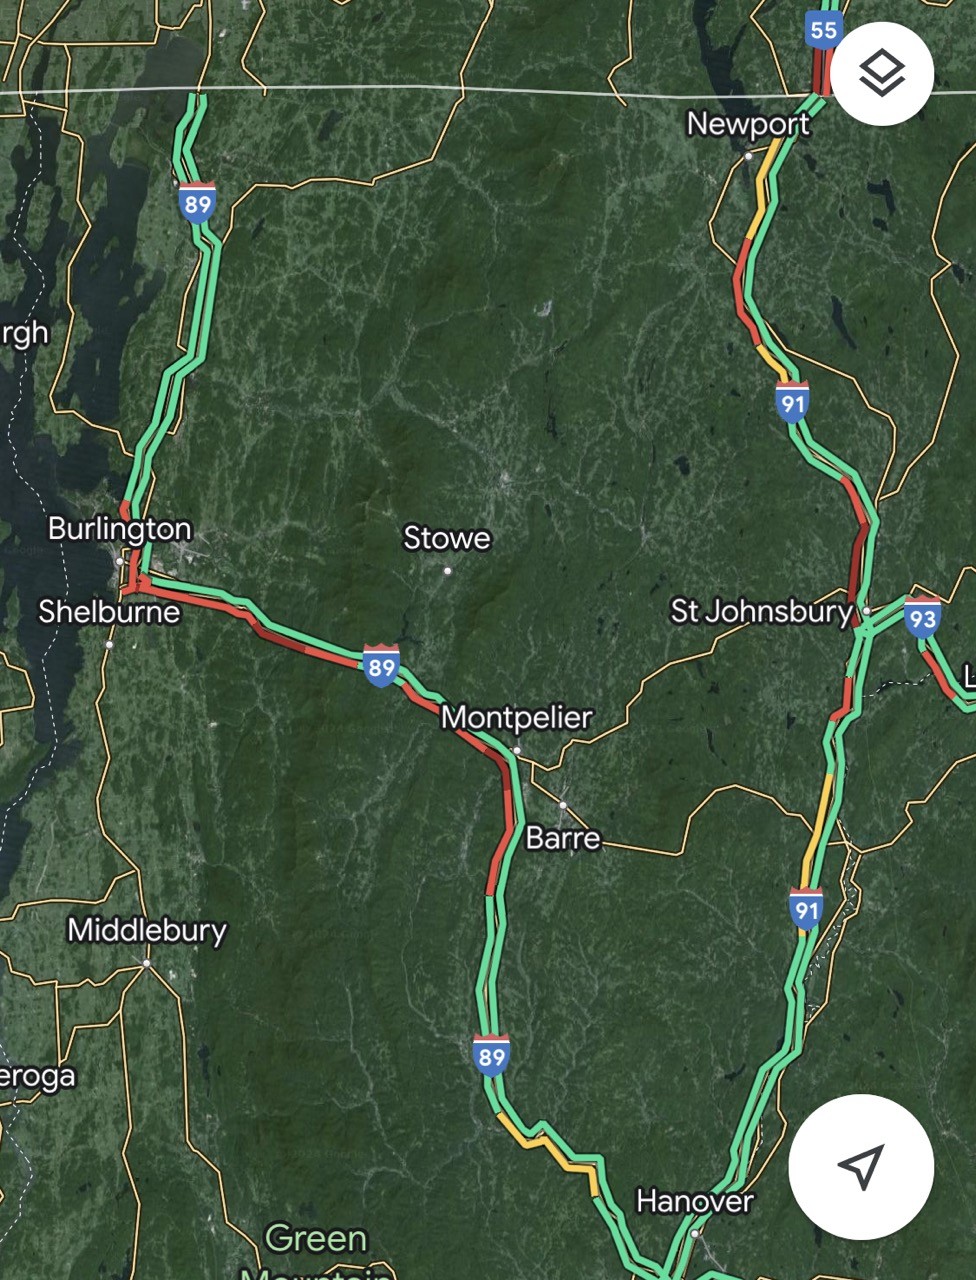
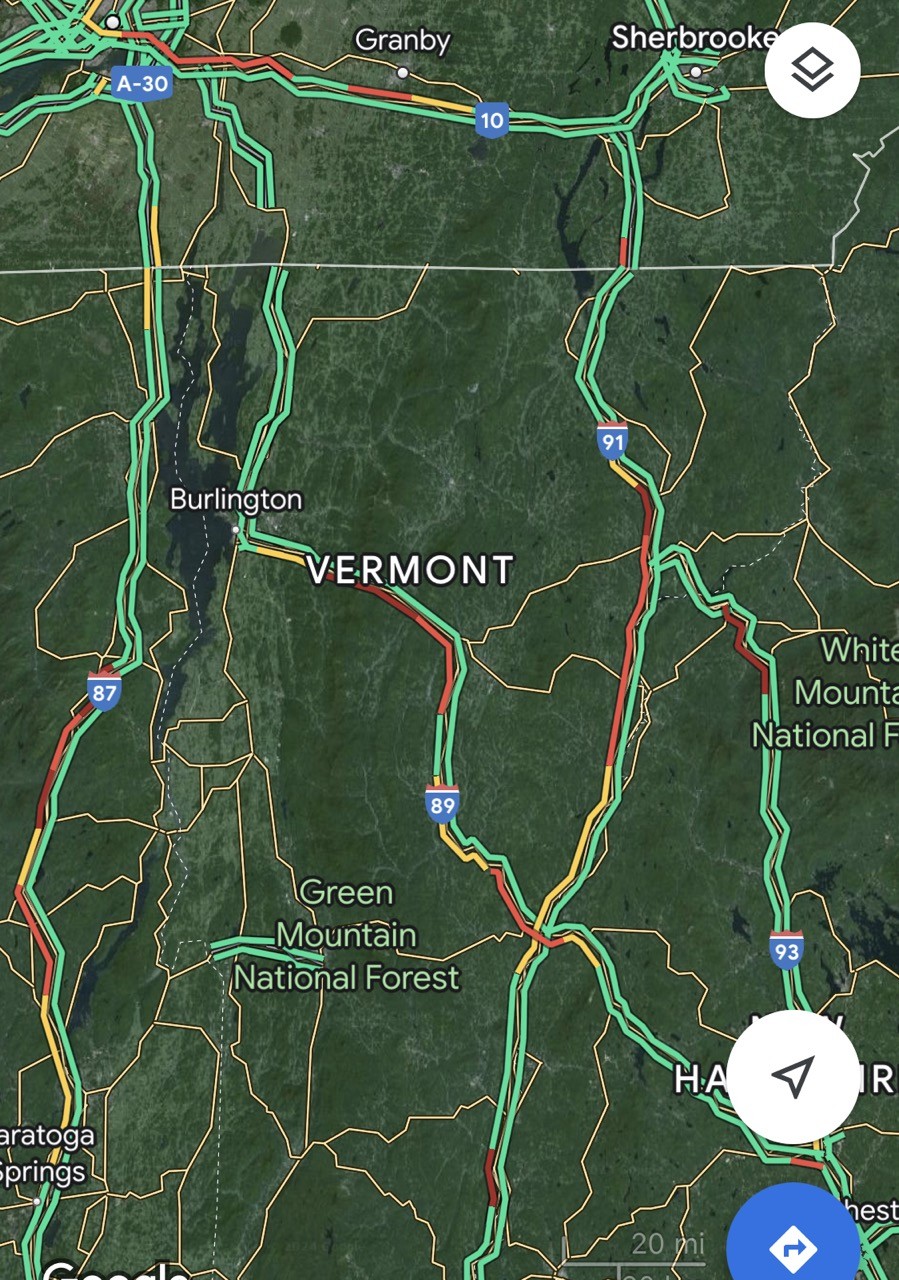
I took screenshots of traffic all day (and the day before and after, see this hashtag on mastodon; I’ll mirror most of these below). These images show traffic the day of the event. There were usual holiday-weekend bottlenecks in Concord and Franconia Notch around 8 a.m., which were getting worse by 10 a.m.
Note: to view these images larger, right-click and open in a new tab. At some point, I will change them to link automatically, figuring out how to do that right now.
There were also some backups on other roads leading north, along 87 and 91.
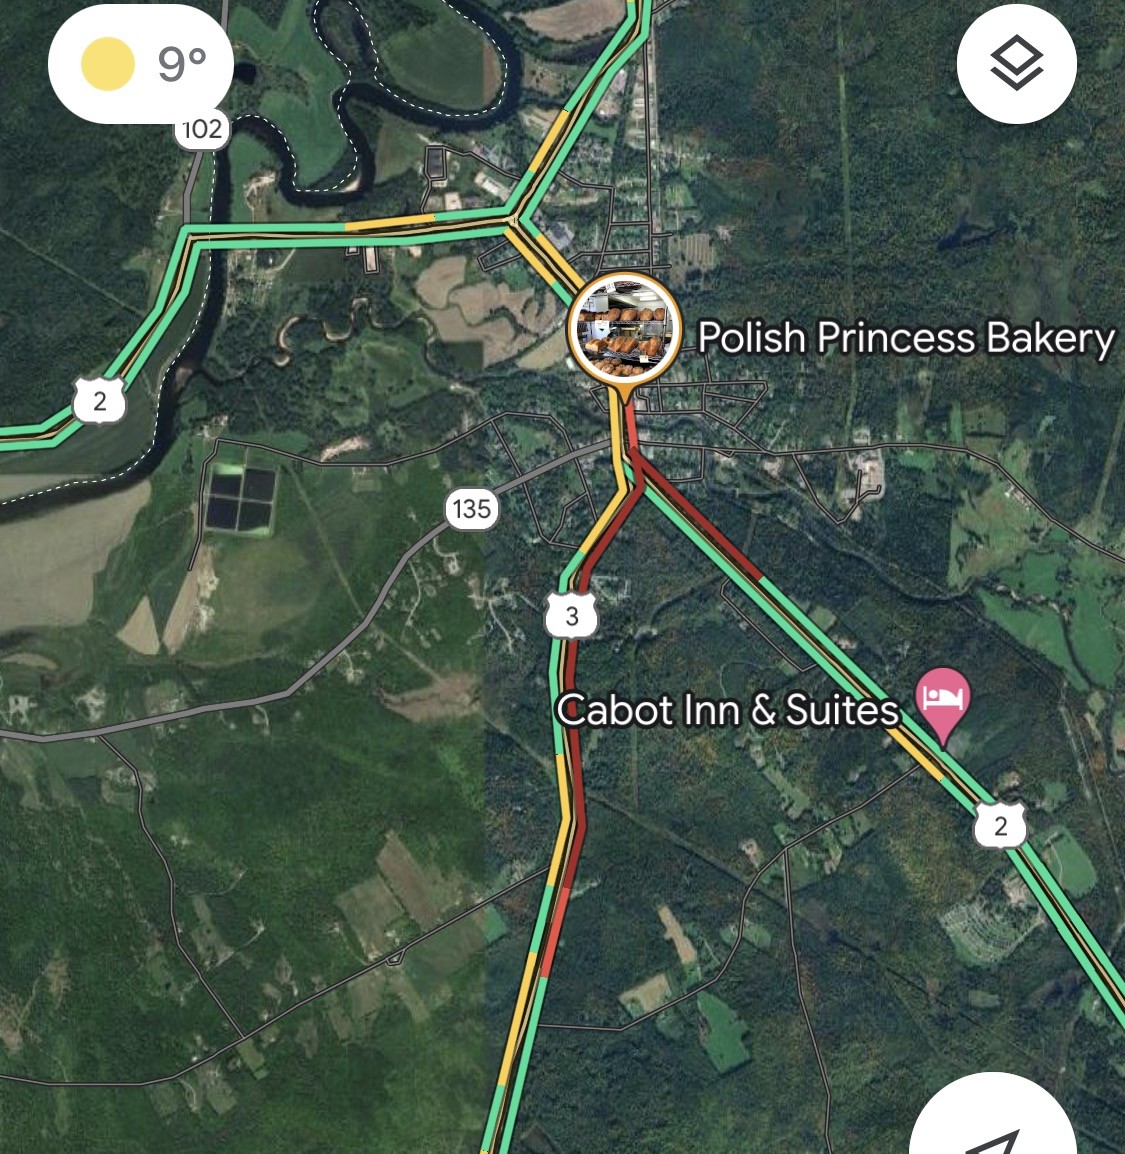
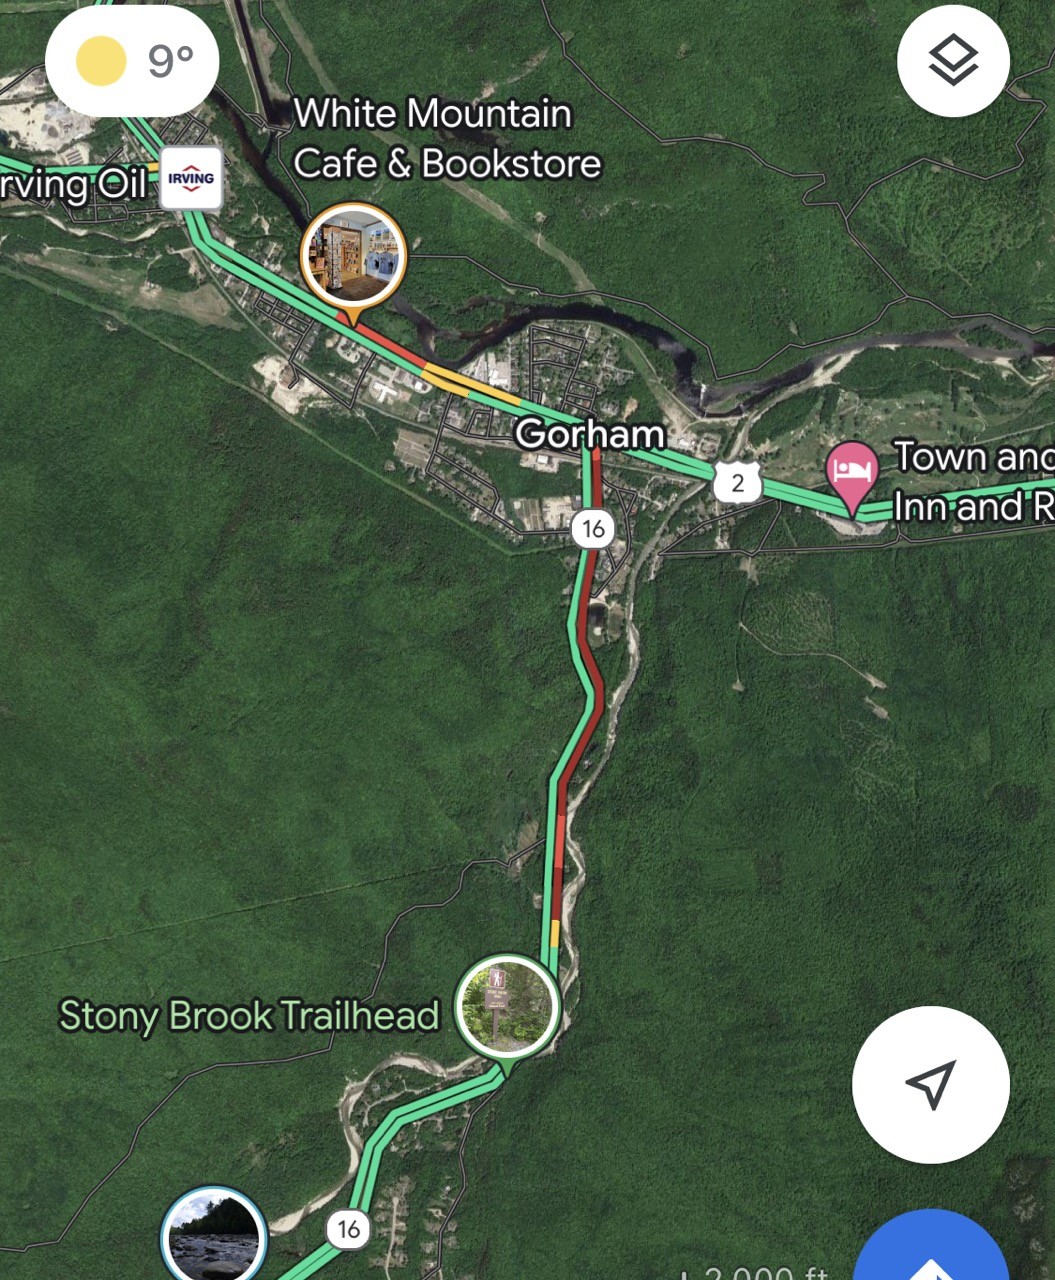
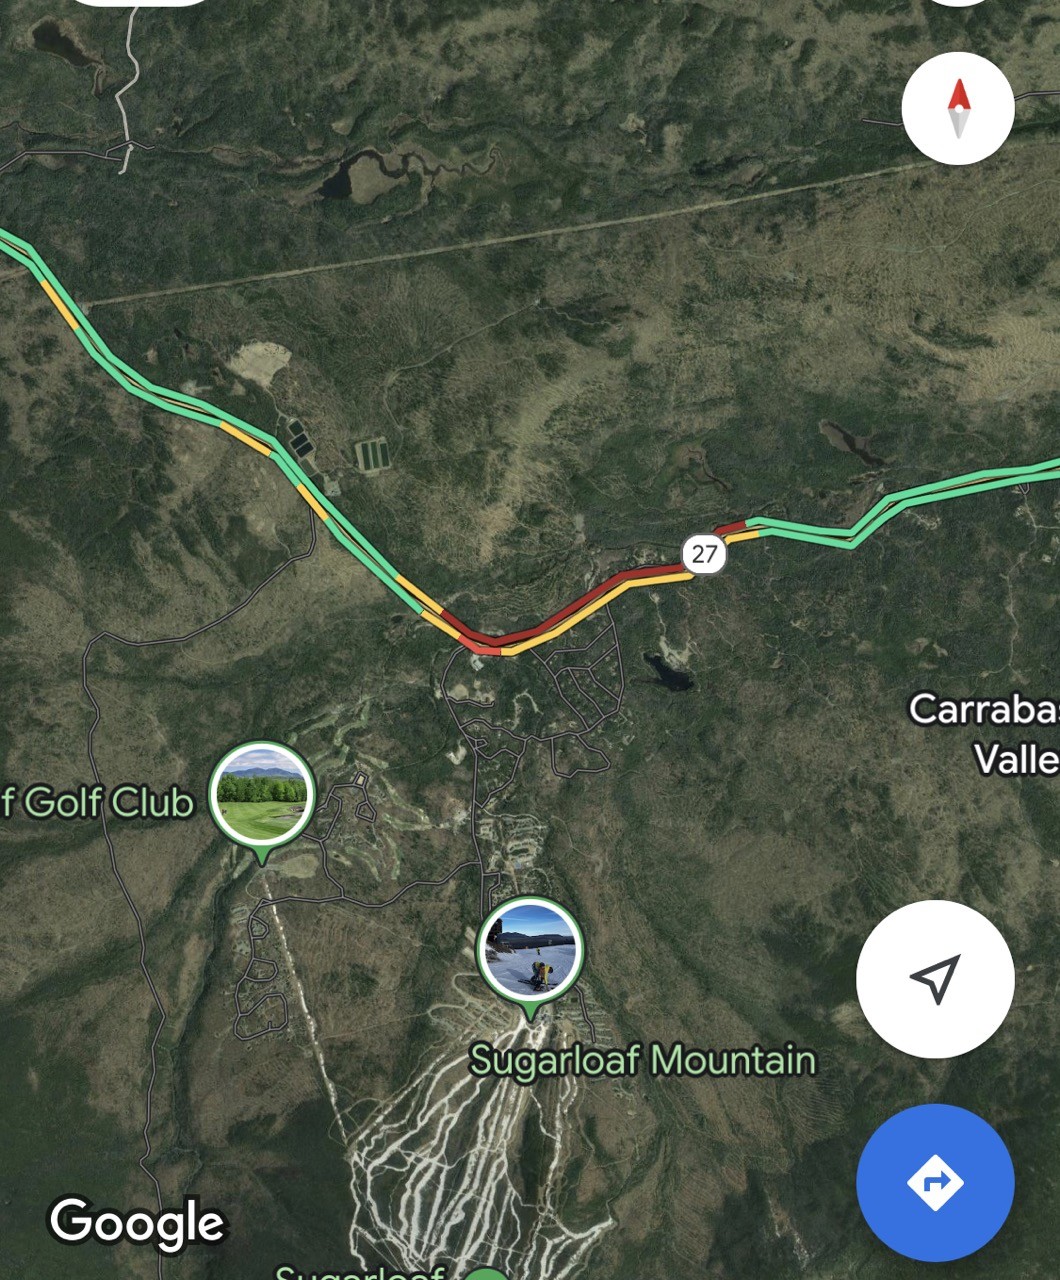
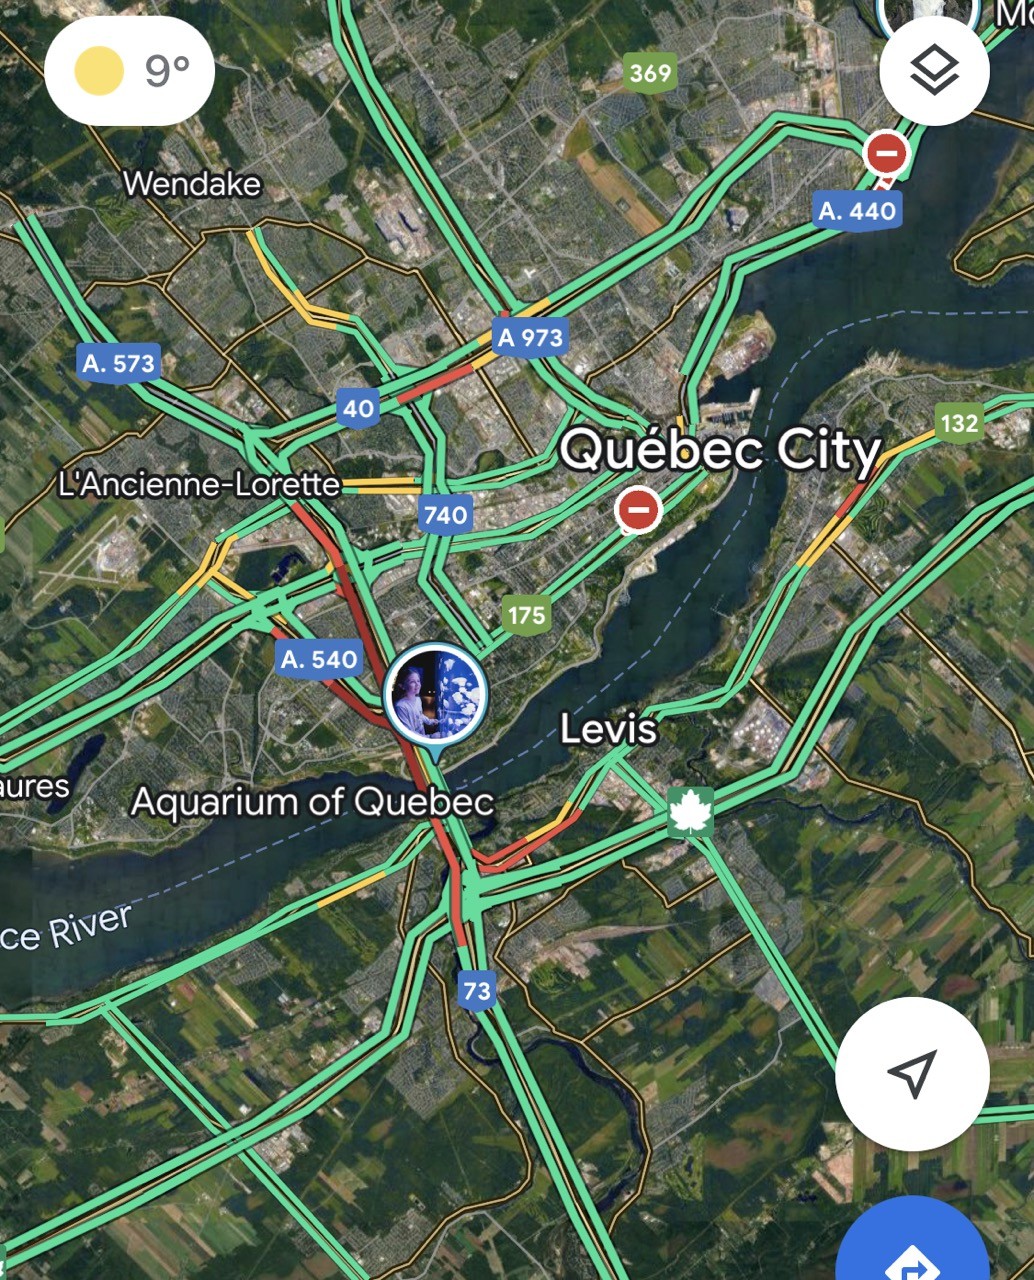
Bottlenecks formed in other places not used to them, including Lancaster and Gorham in New Hampshire. Sugarloaf saw traffic based on a busy ski day in April, also anomalous, especially for a Monday (Sugarloaf and Saddleback were sold out months in advance, and wound up having perfect spring skiing conditions). Quebec City is north of totality, so everyone was clogging the bridge to get south.
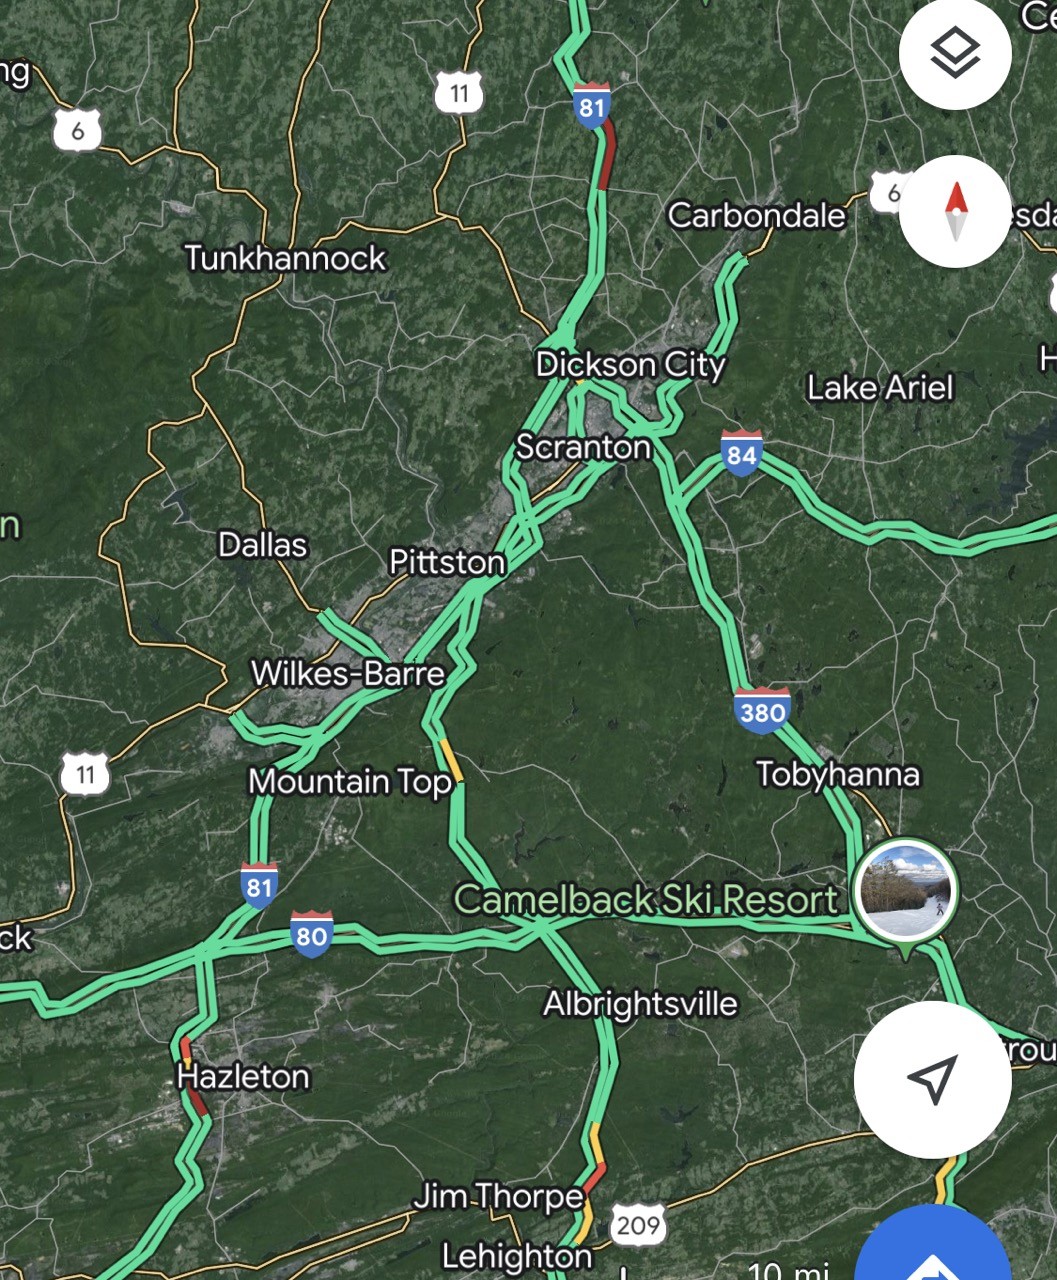
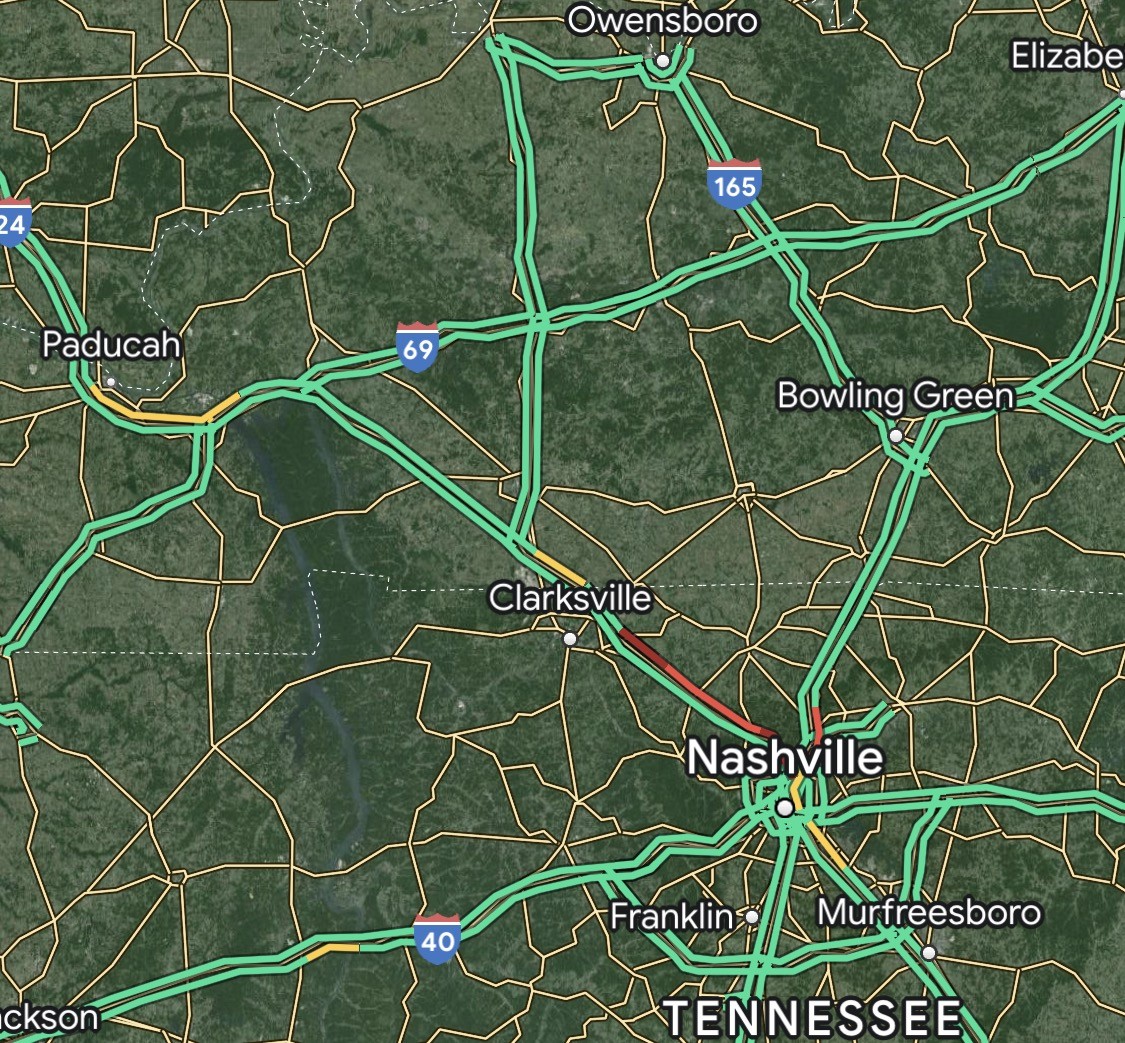
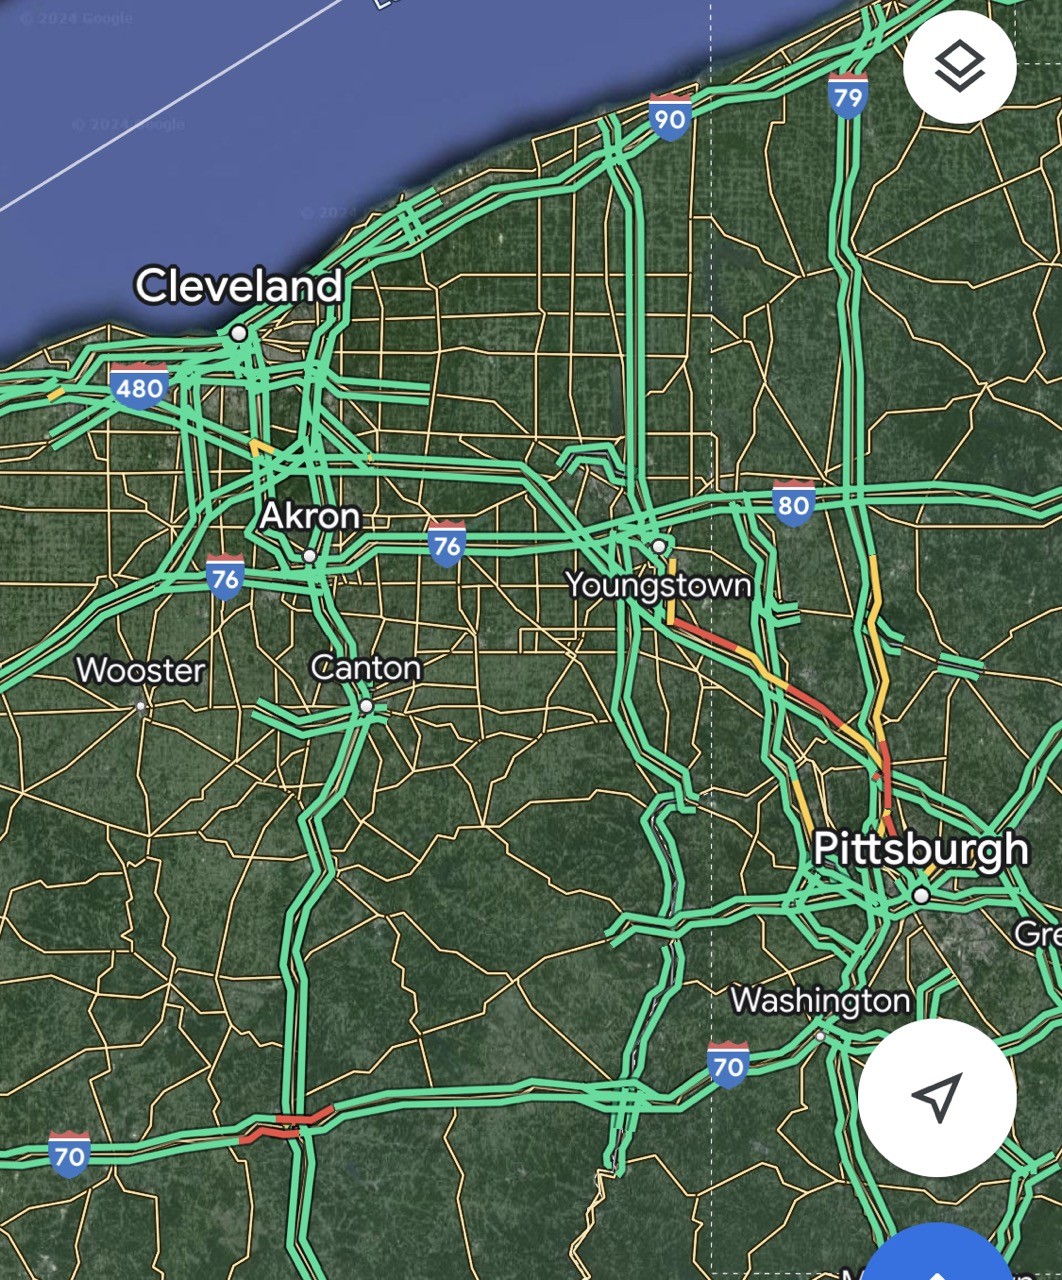
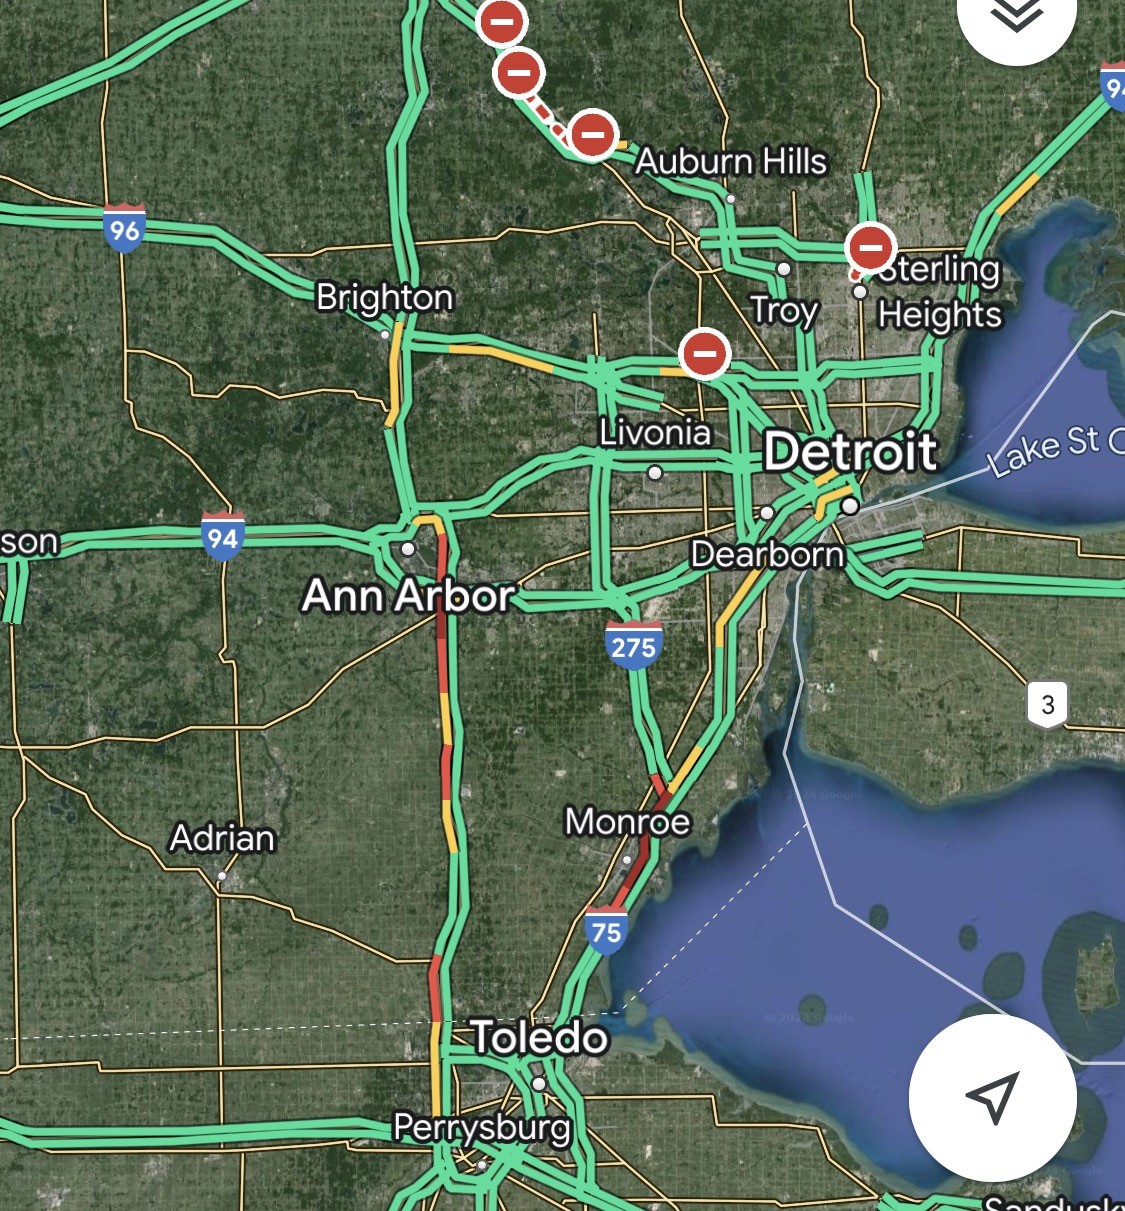
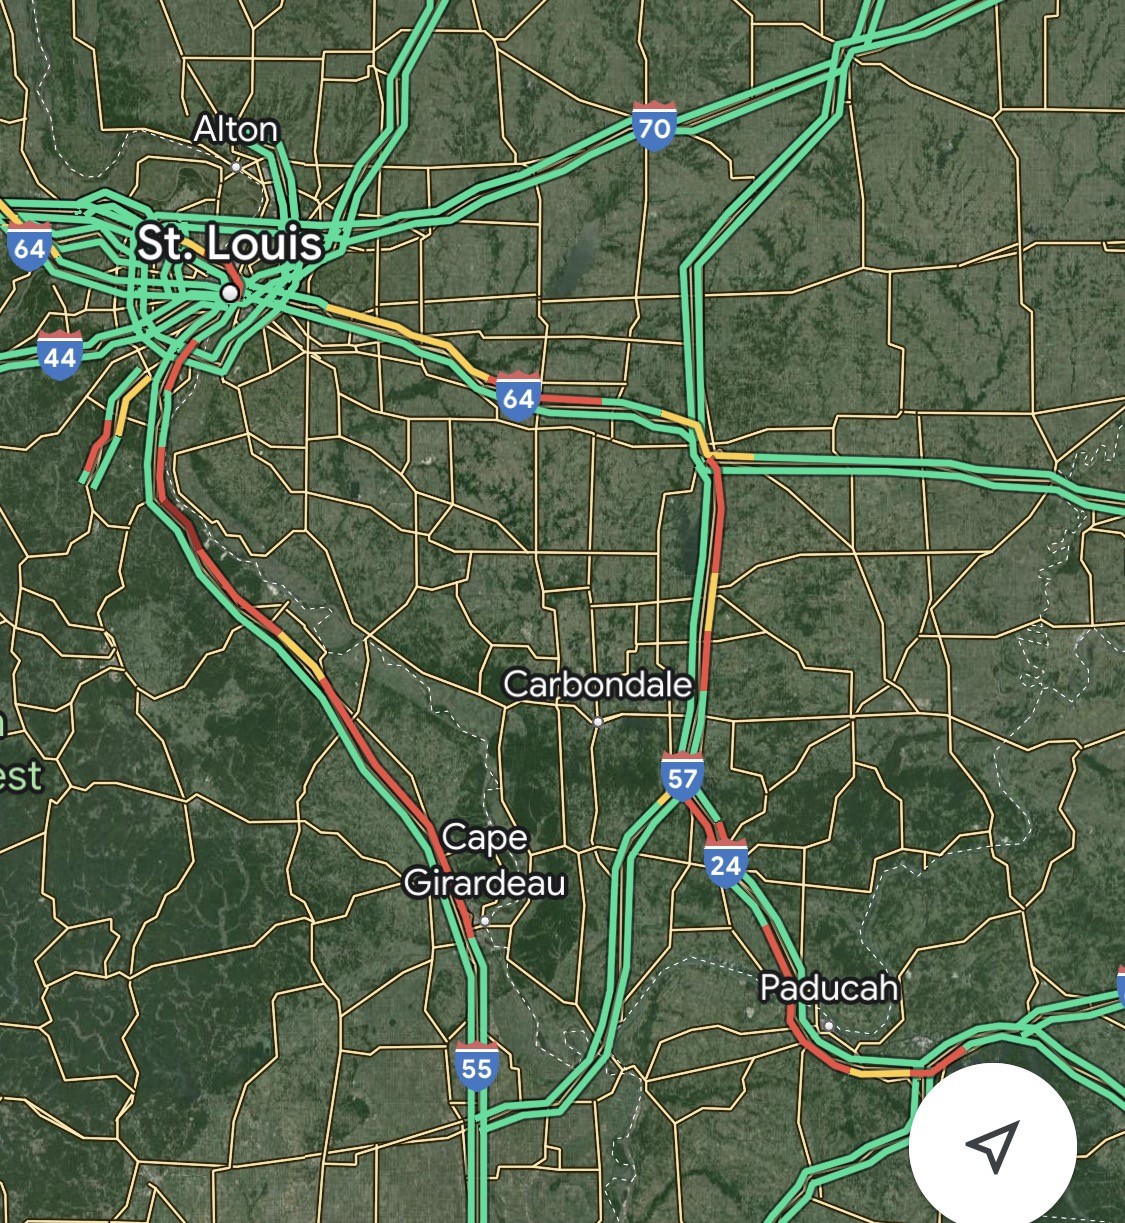
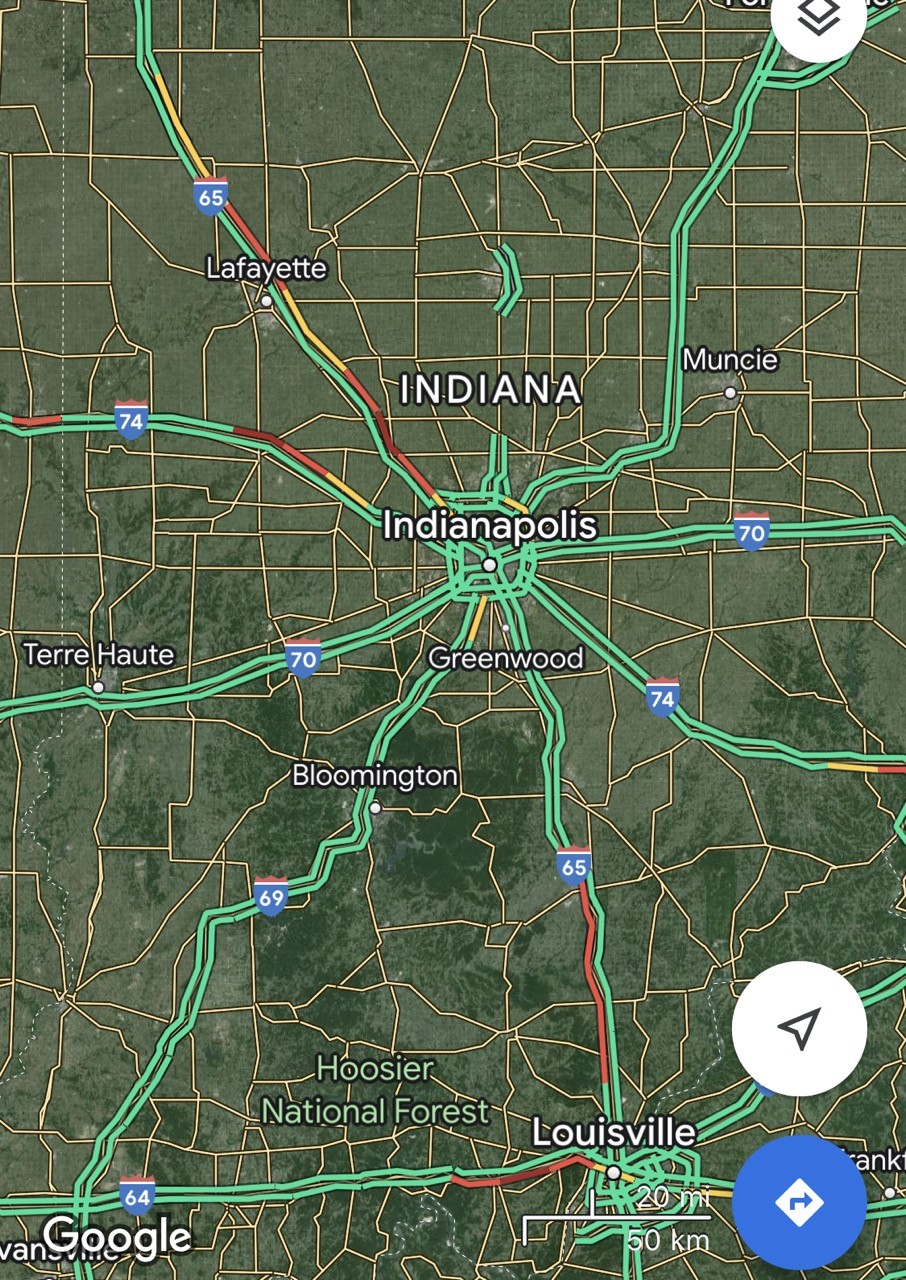
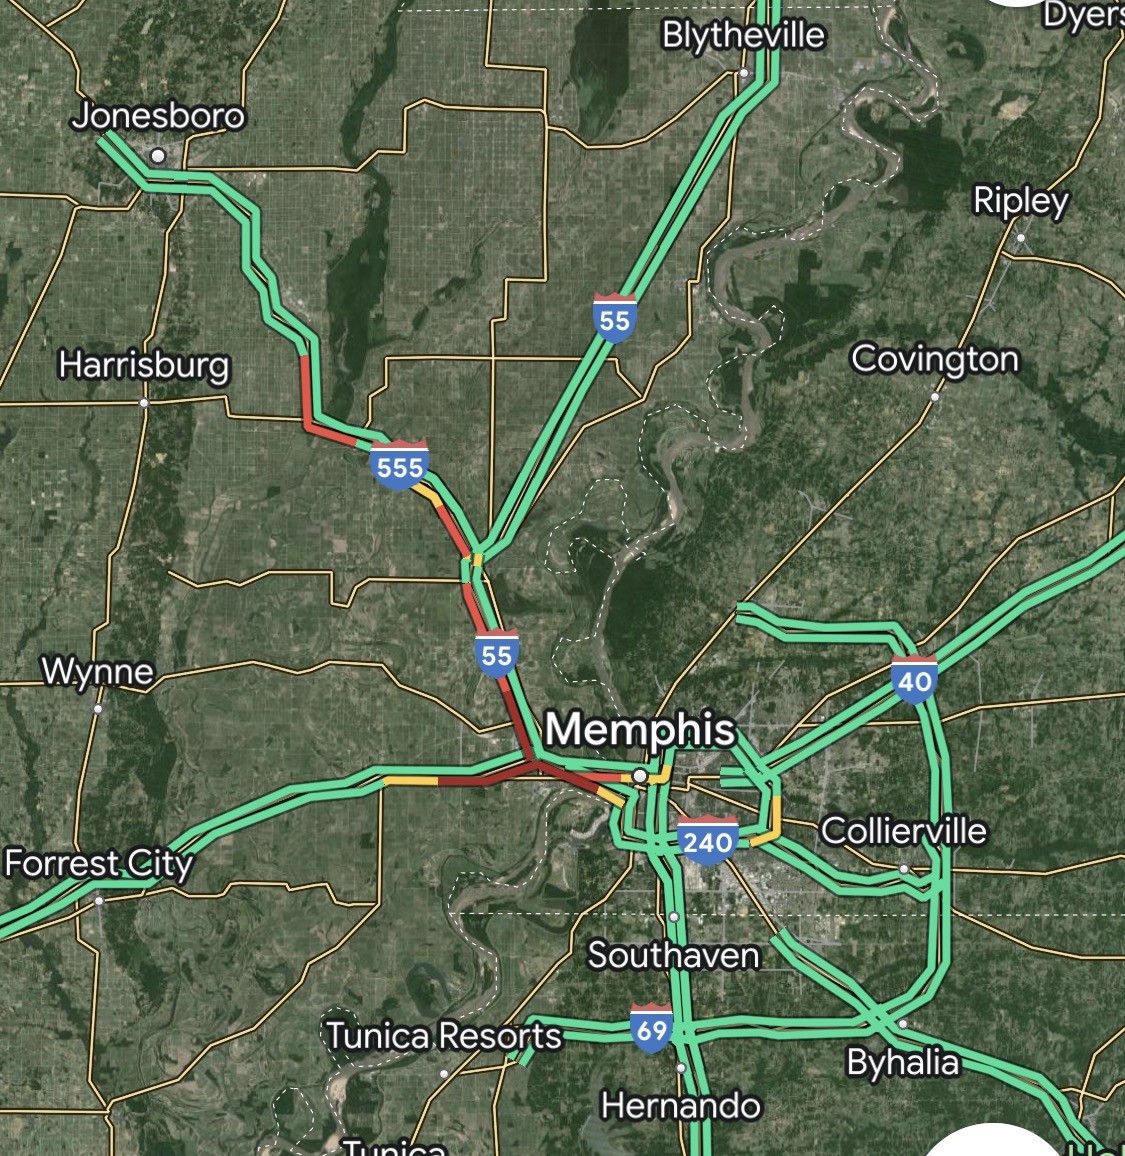
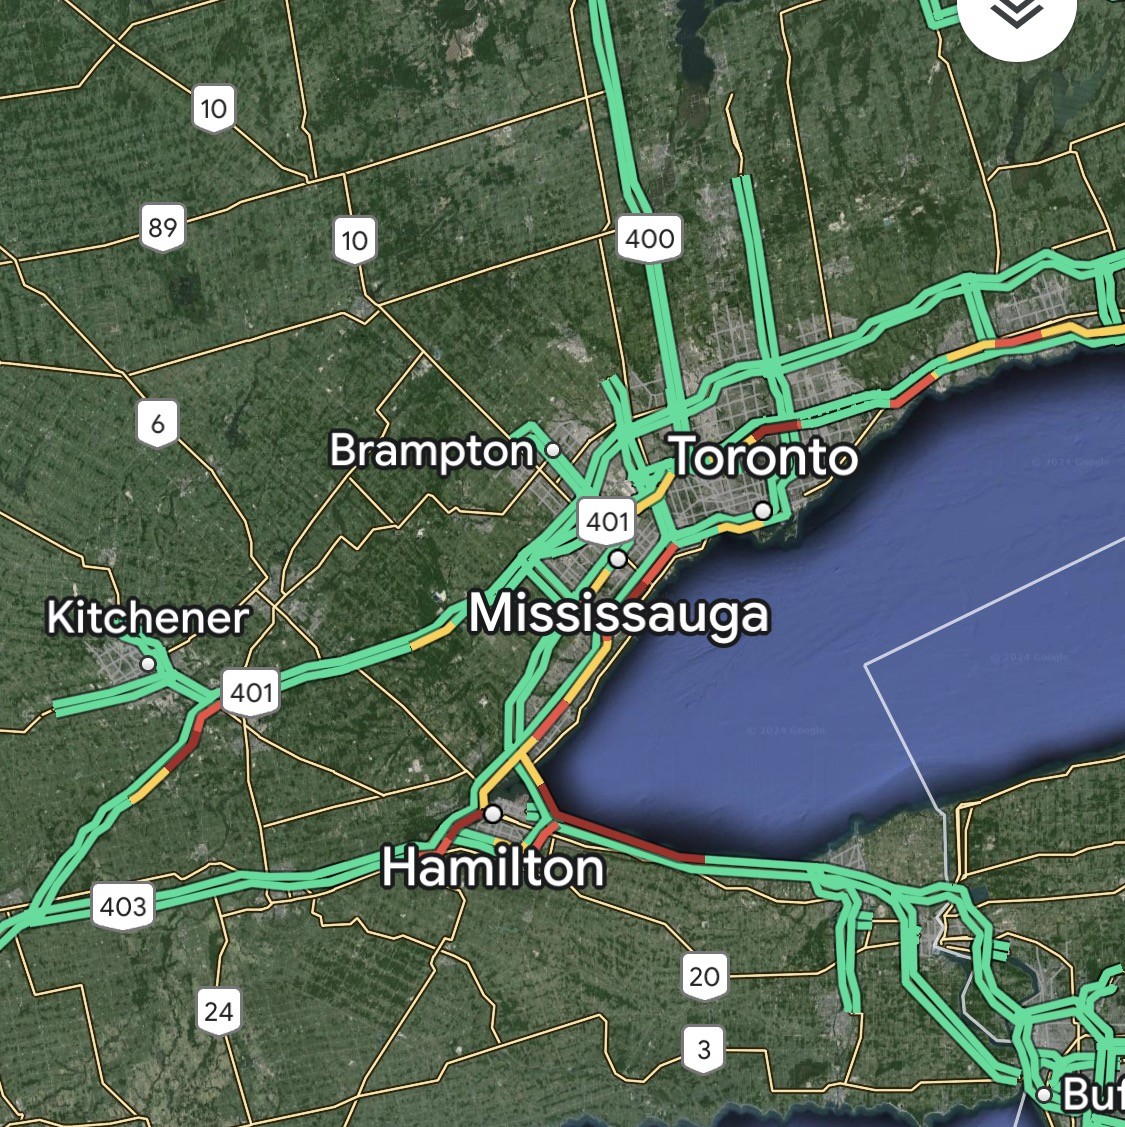
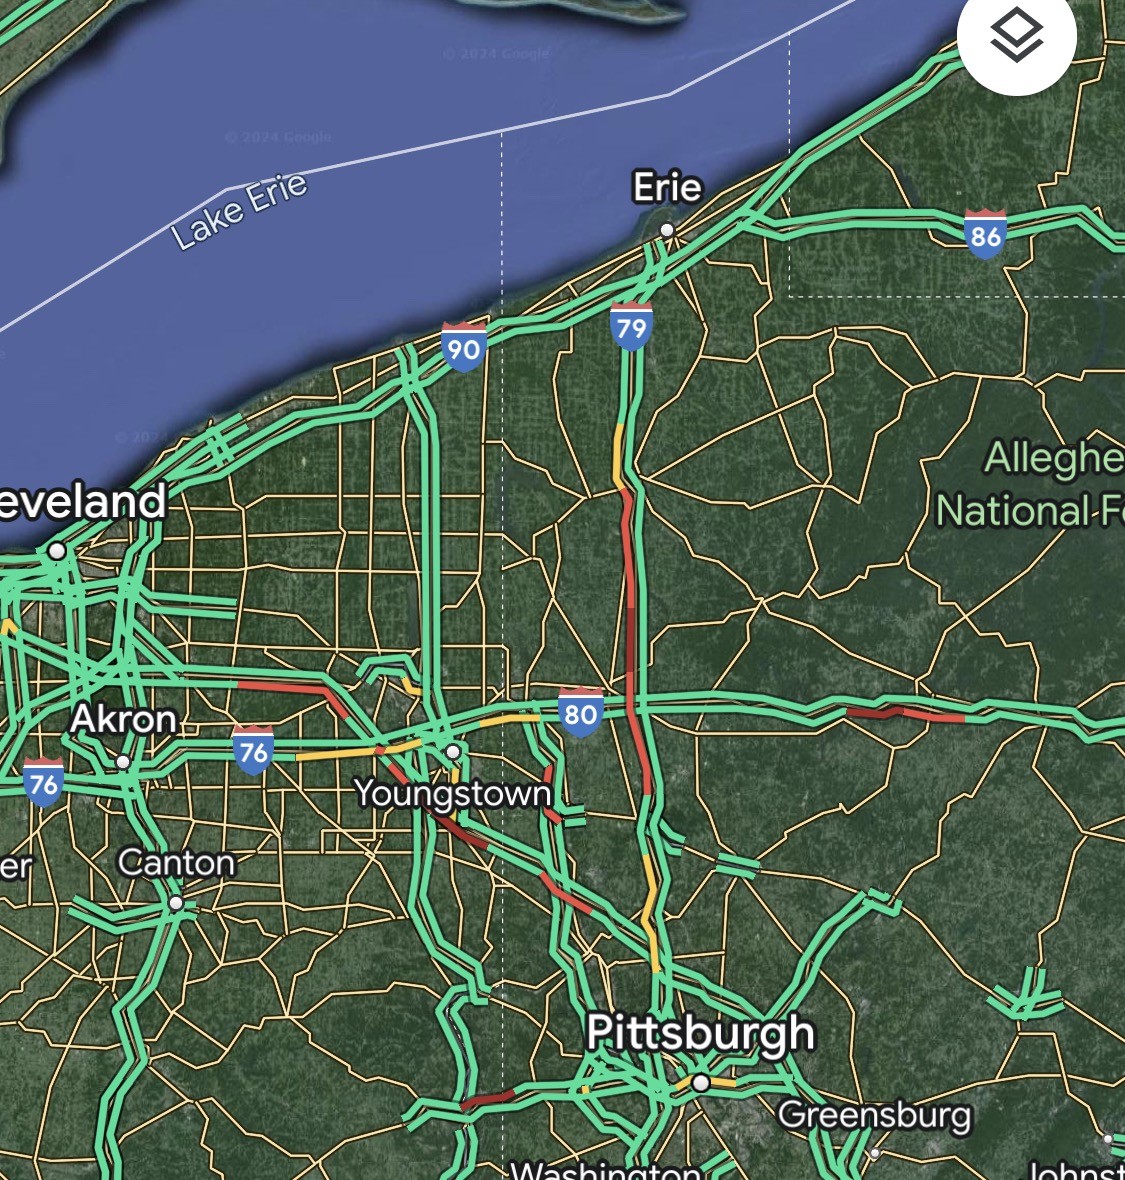
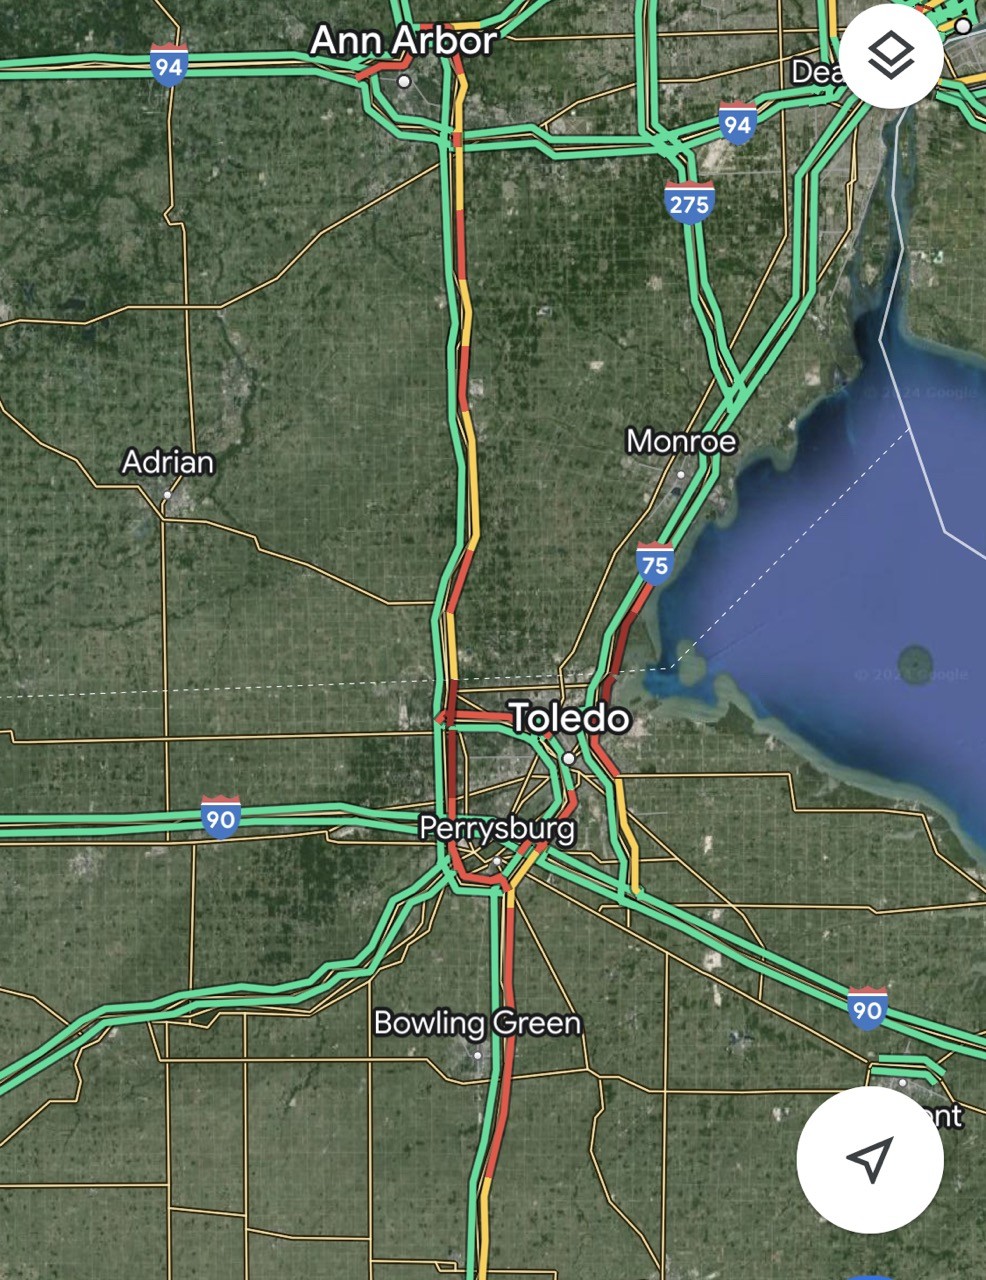
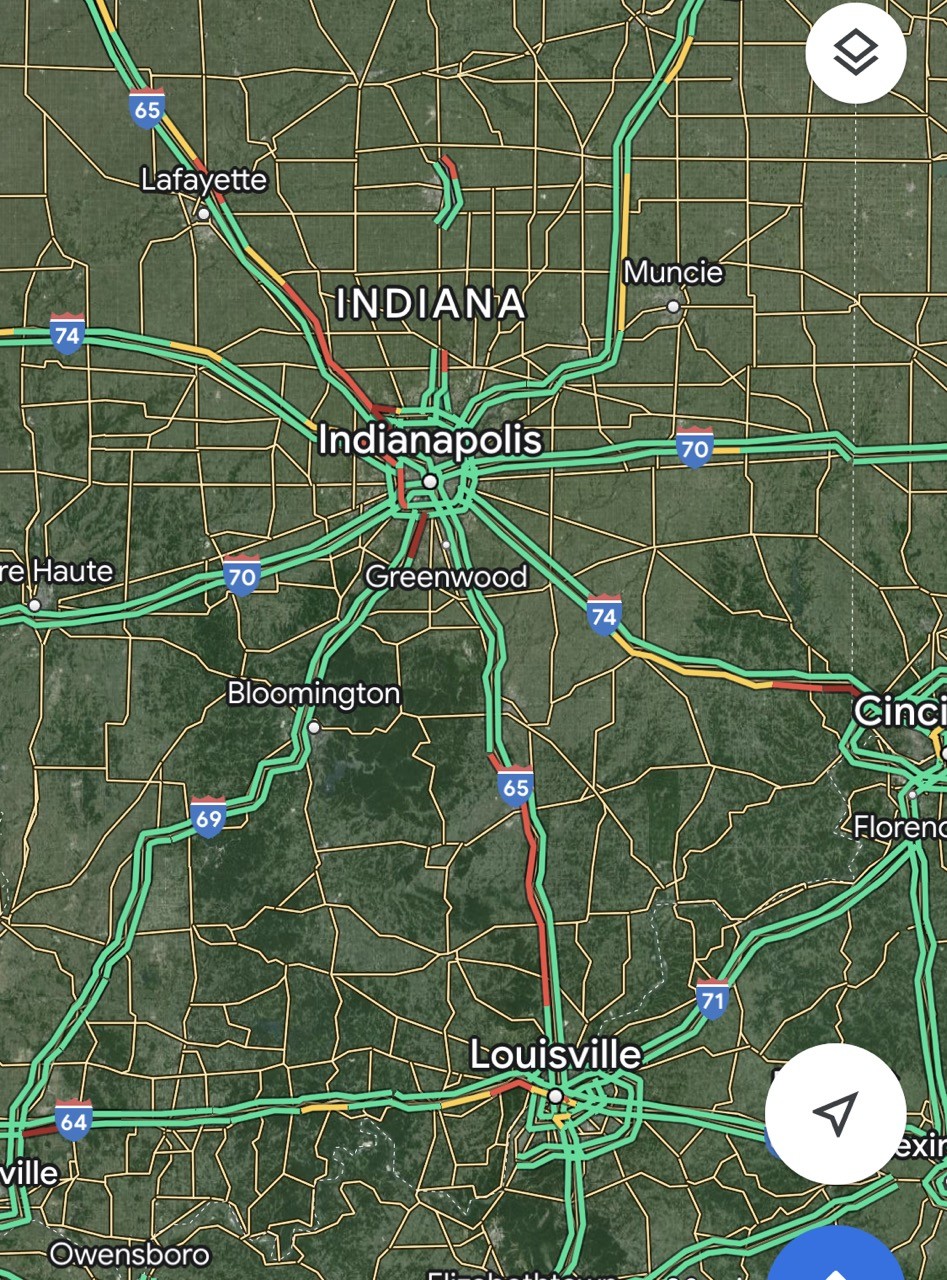
There was additional traffic elsewhere, including Northeast Pennsylvania, Nashville, Ohio and Detroit.
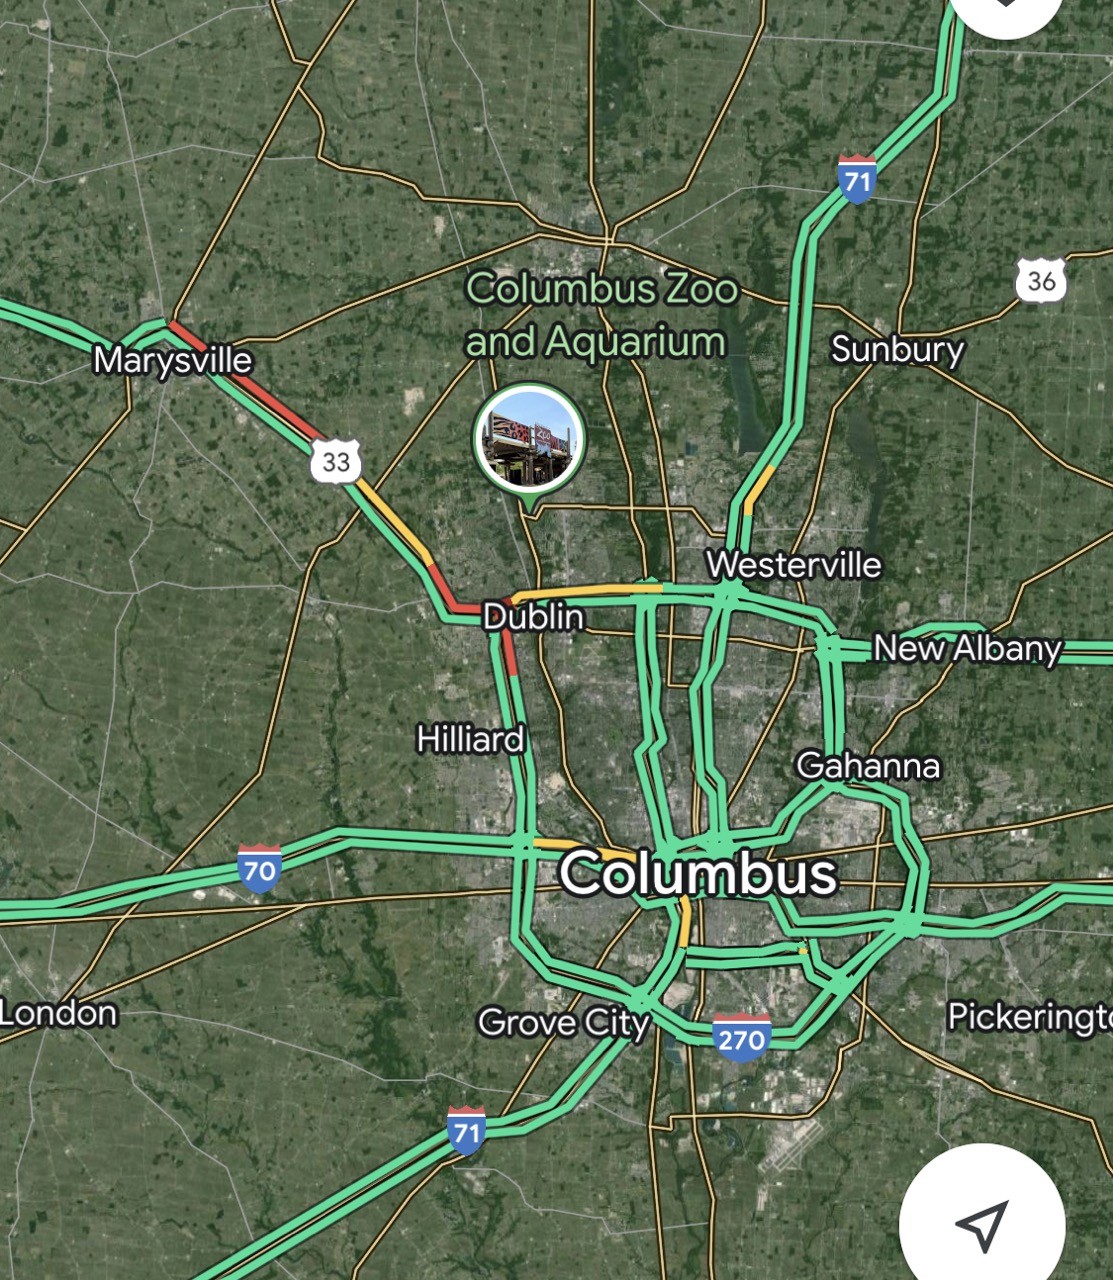
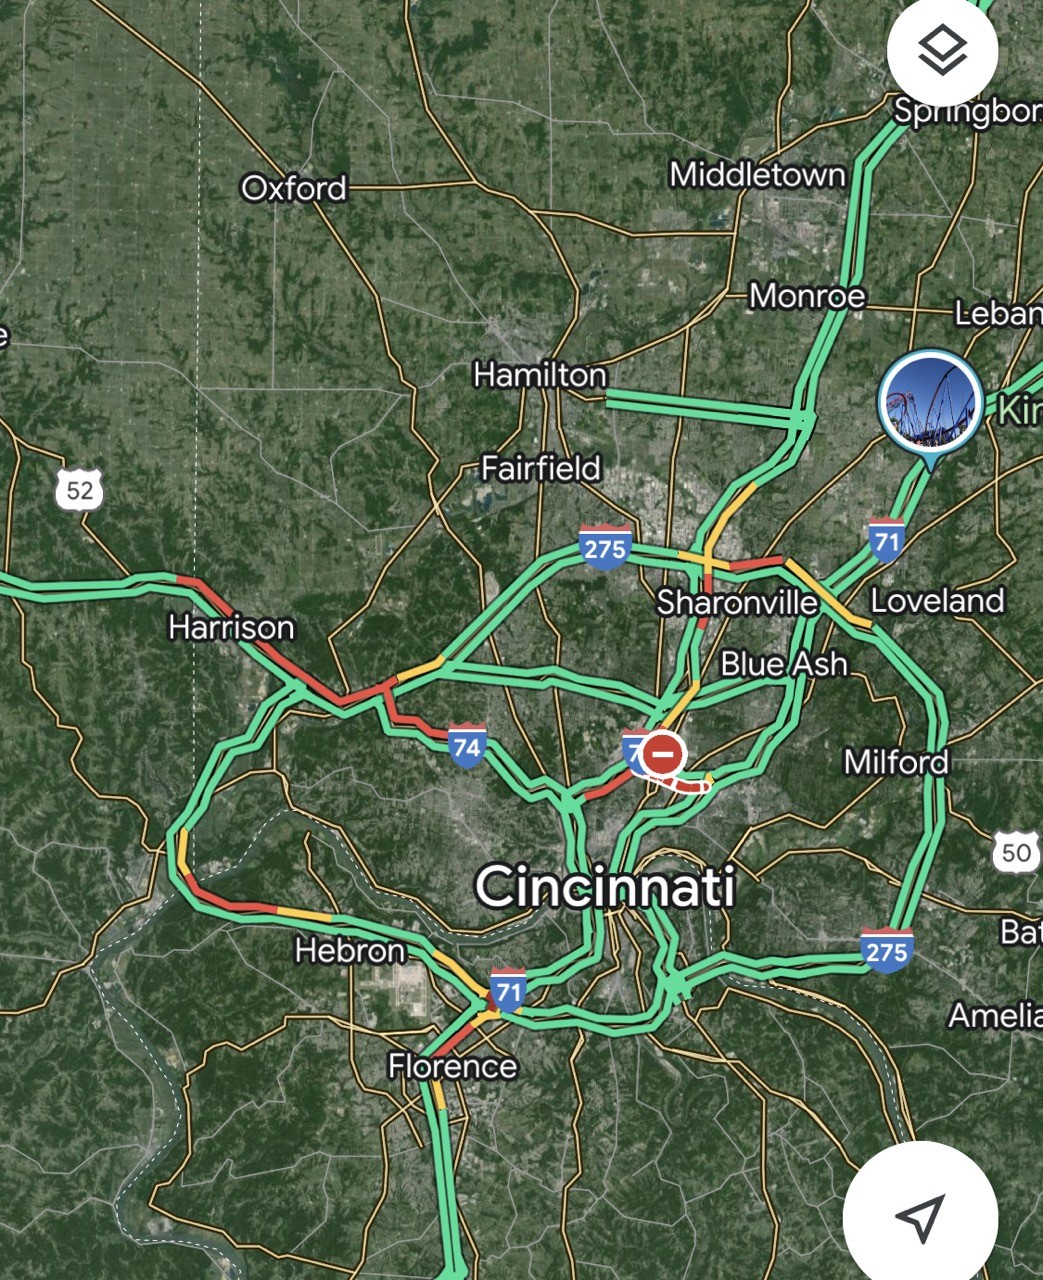
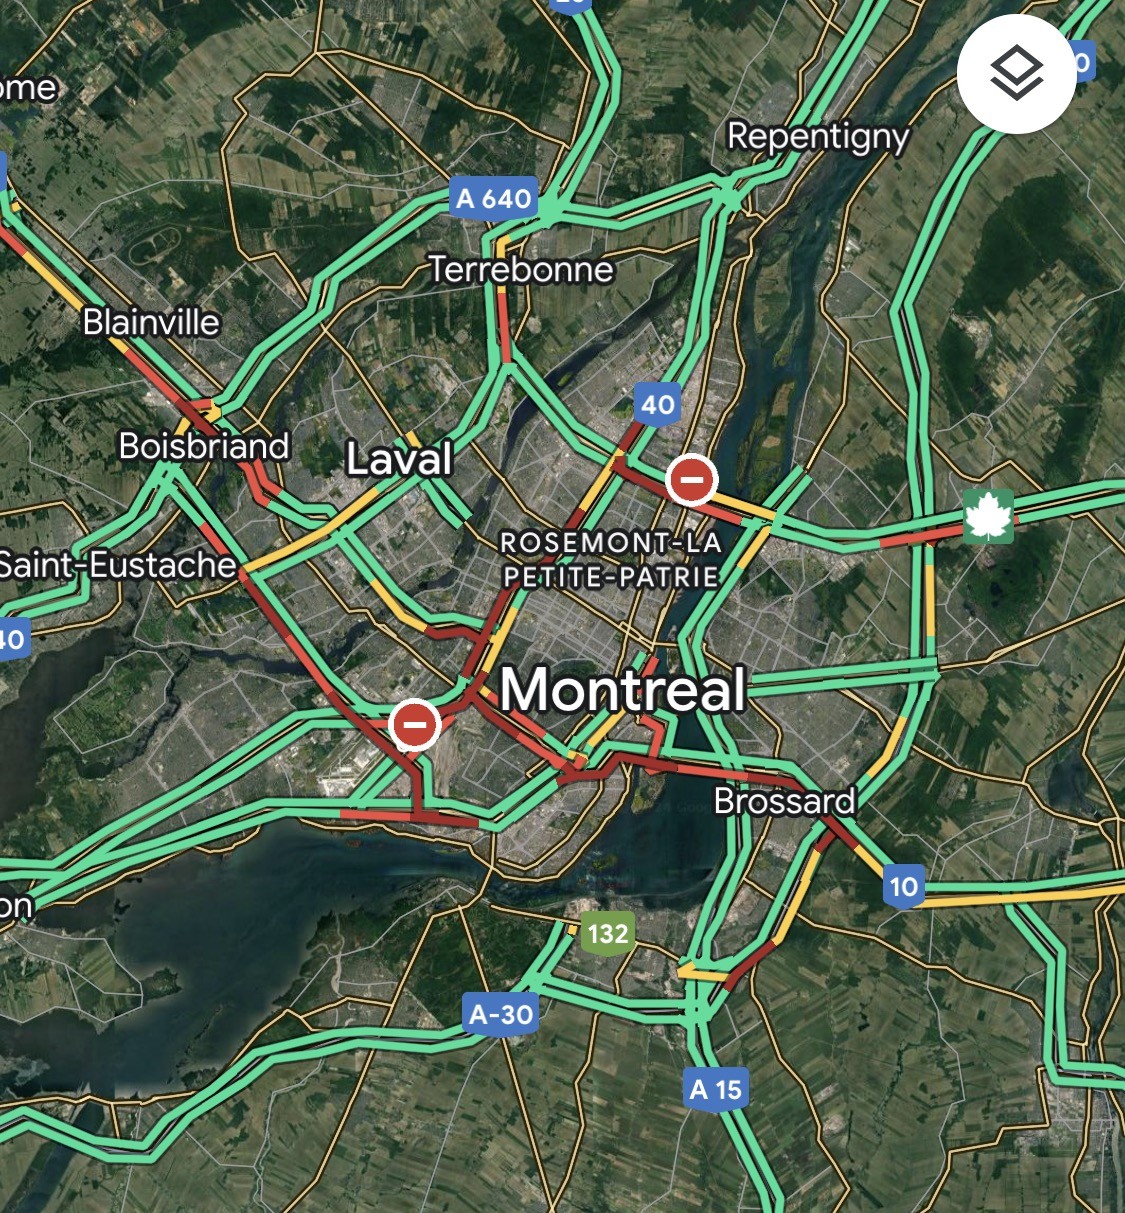
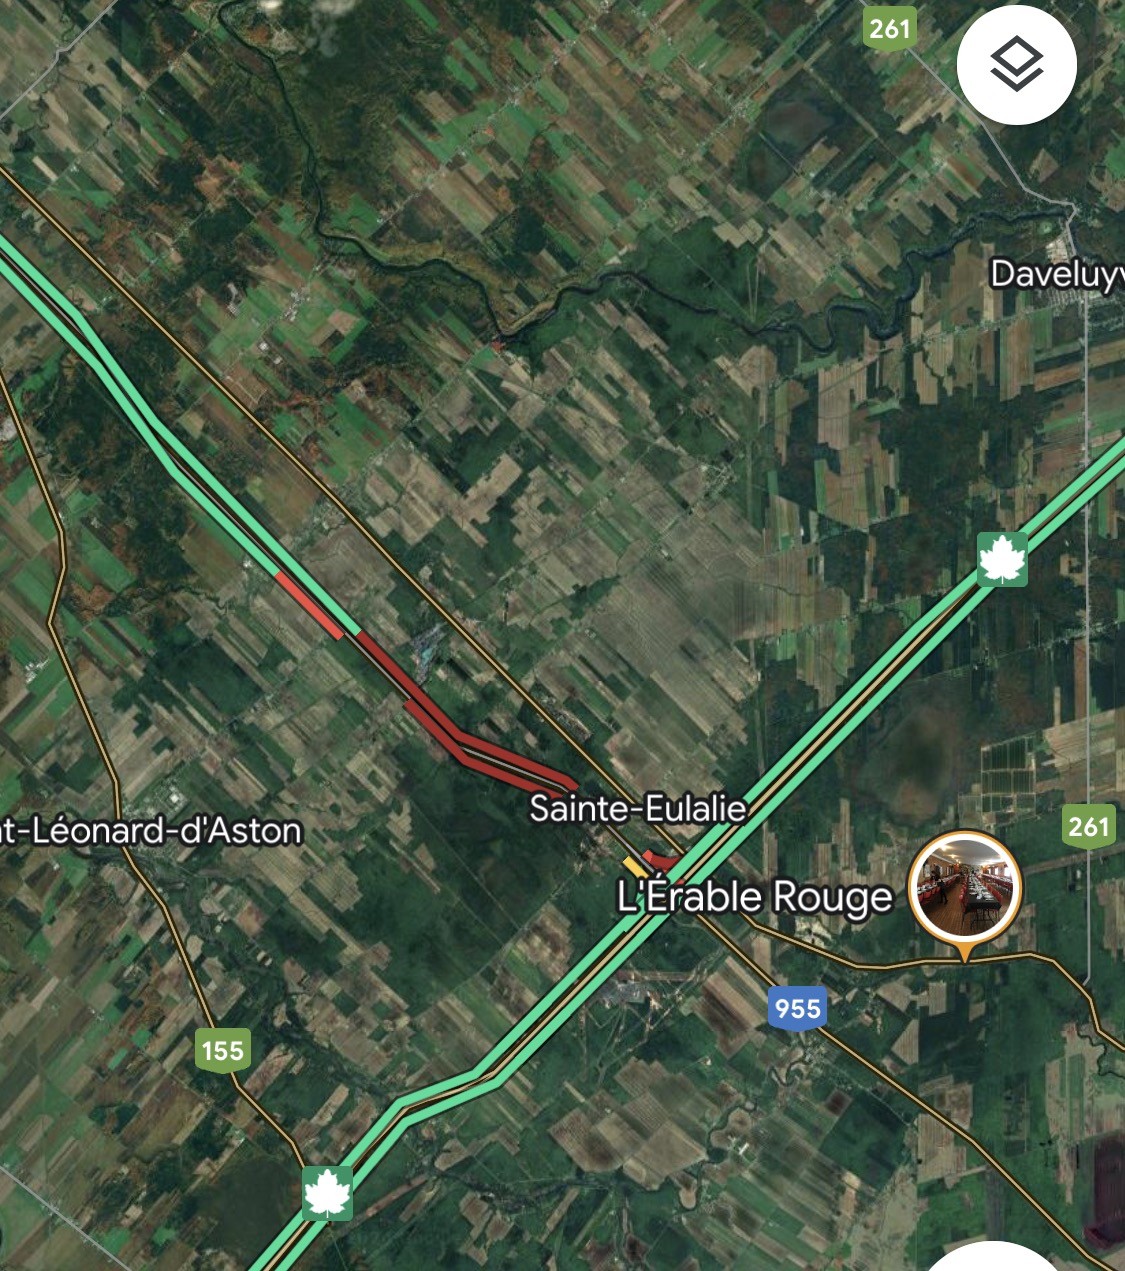
Here’s Columbus, Cincy, Montreal (more traffic than typical trying to get across the bridge; Montreal was on the edge of totality so people were trying to get to more darkness) and then where the Autoroute from Trois-Rivieres dumps onto the main Quebec-Montreal highway.
Then the Eclipse happened.
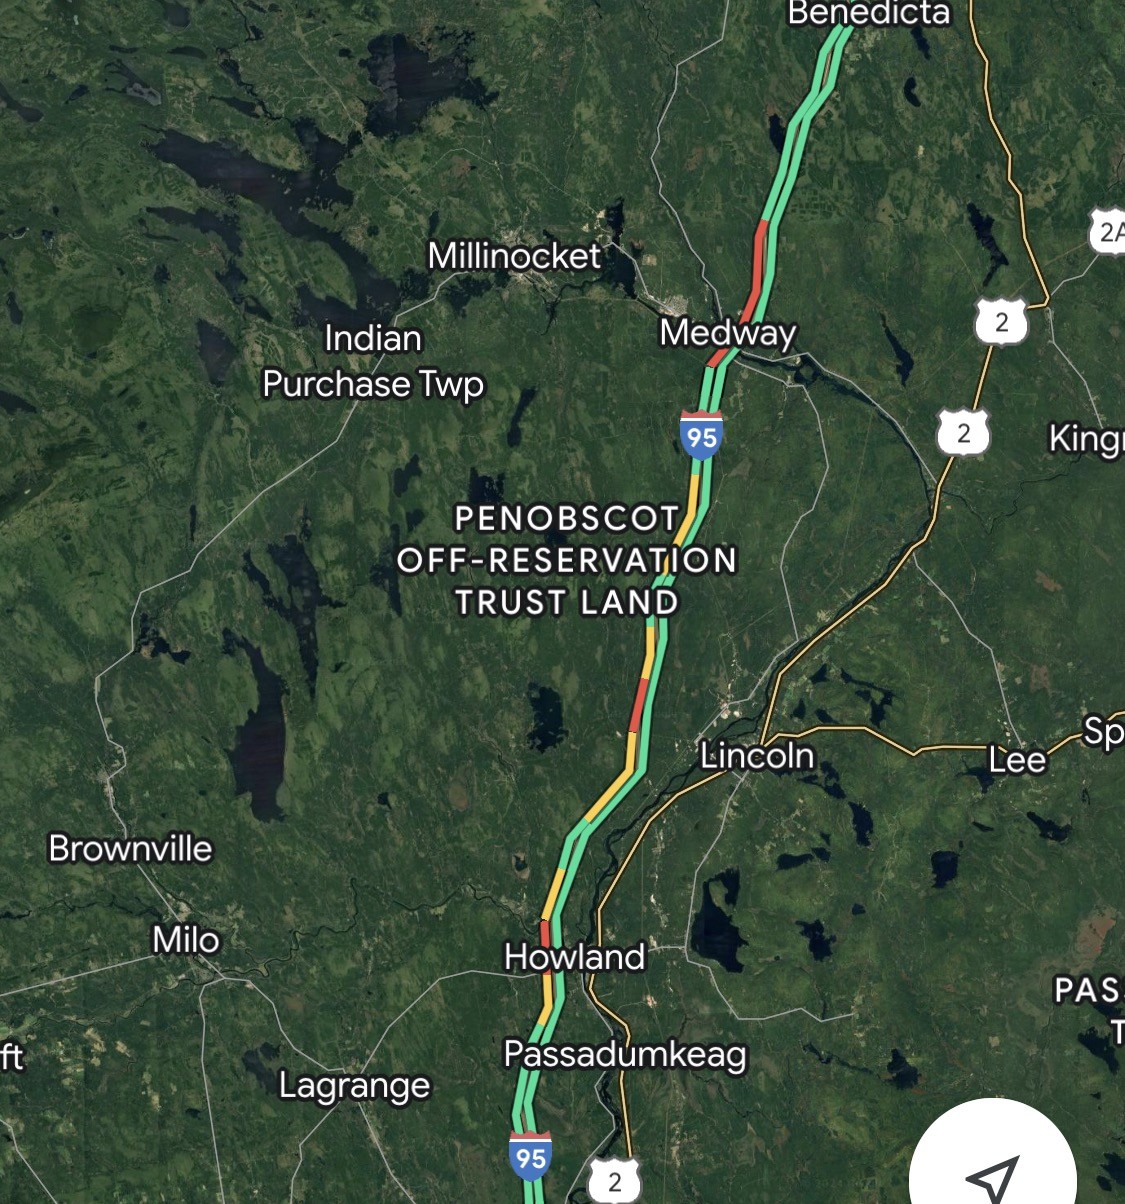
And minutes after, the drive home, although I didn’t have cell reception until after 5 p.m. By that time there were long backups on highways which never see them, and even on I-95 north of Bangor, a portion of highway so sparsely traveled they only built a dual-lane carriageway in 1982. There were long queues on 89, 91 and 93 in Vermont and New Hampshire, with bottlenecks forming where demand outstripped capacity.
By 8 p.m. traffic had spread out from the center line across the country (and Canada). Most anywhere with a bottleneck or a demand corridor had a backup.
By 10:30 p.m. I was back at a desktop and had changed my background. If we’d gone to Vermont, I might still be in traffic in Franconia Notch. 93 was back to Littleton, Route 3 to Twin Mountain; Kinsman Notch was jammed, too. Google Maps had eventually figured out that people should go down 89 and cut across the un-jammed Route 25 (or even further south) to avoid the bottlenecks. That had been my plan had we gone to Vermont: get south of the notch and take Route 25 (but there was actually an even better plan, see below).
Not everyone got stuck in traffic on Monday. Some people stayed put and got stuck in traffic midday on Tuesday. (Less traffic, but still not normal.)
How did some people avoid traffic?
What was the best strategy to see the eclipse and avoid traffic? Go diagonally across the demand lines. In New England, the demand to see the eclipse ran almost entirely north-south along major highways. It then spilled over onto secondary and tertiary roads (Kinsman Notch, for example, and some smaller roads in Vermont and elsewhere). But if you managed to find a route which connected the eclipse path to somewhere which was more sparsely populated, you could get home from the eclipse without seeing much in the way of tail lights. Here are two examples.
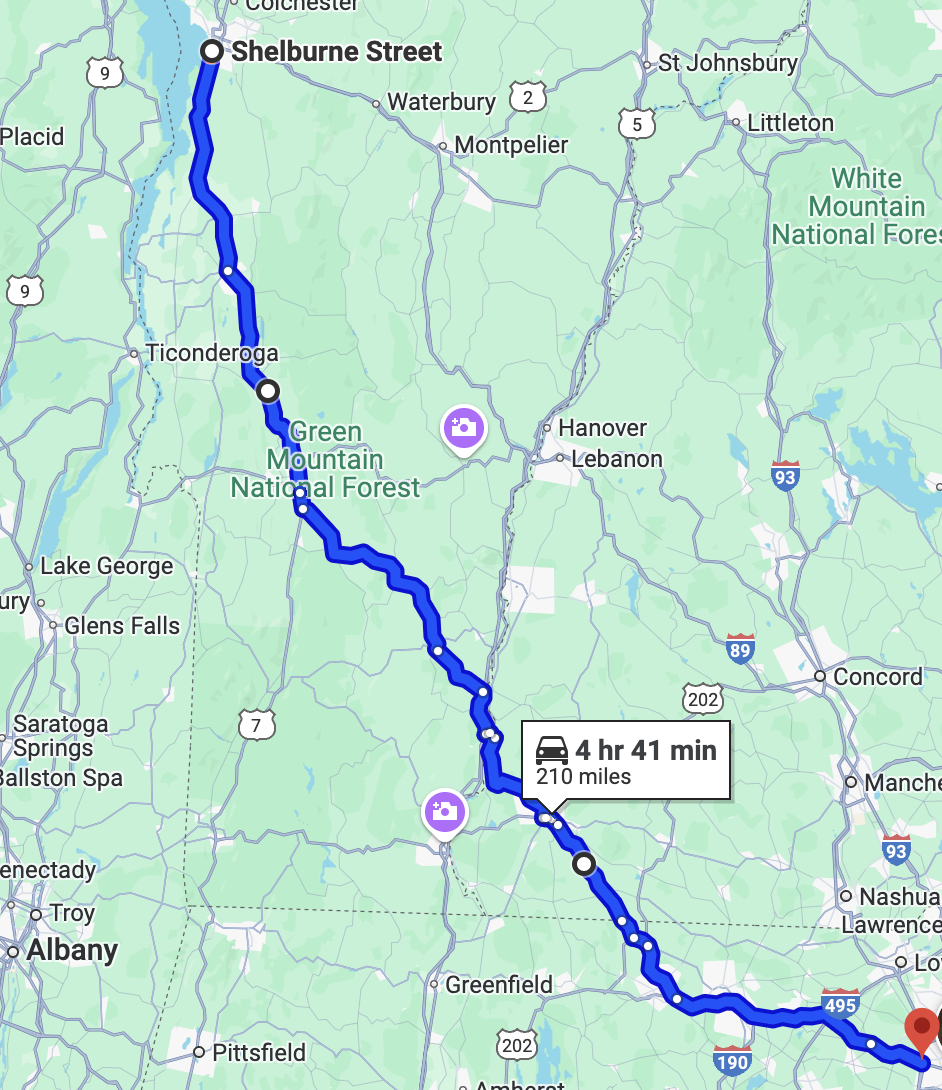
The Champlain Valley in Vermont to Boston. Middlebury was right near the edge of totality, but even a few miles north would have been in totality without hitting the worst traffic. This would have worked from Burlington as well. Rather than get onto 89 and sit in hours of traffic, the diagonal route, nearly entirely on back roads outside of totality and not crossing through any bottleneck points (in fact, not using an Interstate highway at all) took about 4:30, according to a friend who did just this from Middlebury and hit no traffic. Even with some traffic on Route 7 to get to Midd, this would have been far preferable to hours on I-89.
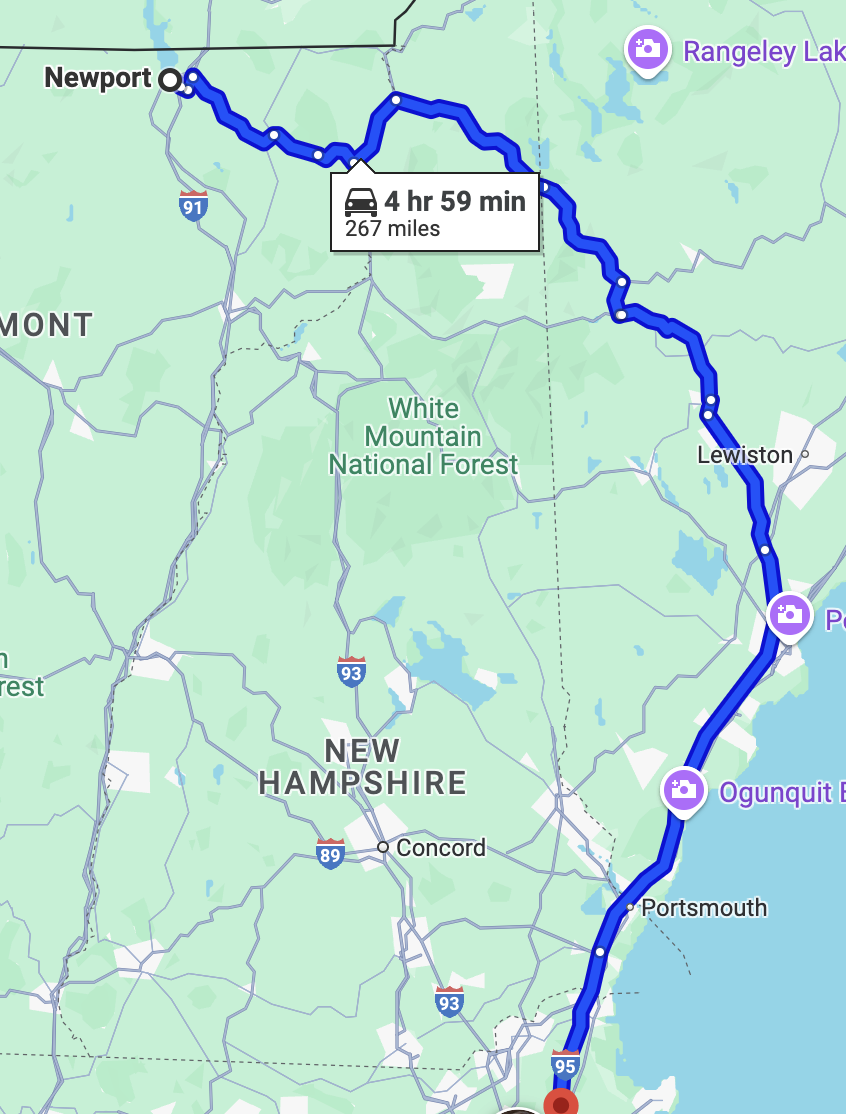
Newport, Vermont to Boston is normally a three hour trip but on eclipse day was 8 or more (unless you were the first car out of town). But if you were to drive east far enough and then drop diagonally through Maine, you’d avoid the demand lines and would have made the five hour drive with minimal traffic, through Dixville Notch in New Hampshire and Grafton Notch in Maine before picking up the Maine Turnpike home. In both cases, you would have enjoyed a beautiful drive as well.
What about trains?
Some people mentioned: what if we had reasonable passenger rail lines which could have taken people to the eclipse? If we did have a robust rail service to these low-population areas, it still would have required significant capacity to move the requisite number of people. For a sporting event, there is a finite number of people needing transportation from a fixed point, even a large stadium only needs 50,000 people, and these are usually traveling a short distance (within a city). Here, millions of people need to to be moved hundreds of miles to multiple locations (maybe if we had a European-style rail network we could have mustered every rail car on the East Coast to run trains to Burlington).
Because the trains can only reasonably satisfy one trip given the time it takes to get to and from a population center, even with vastly improved infrastructure, rail lines would only have so much utility). The New York City subway has about 5000 cars in service at peak hour, with capacity for about 800,000 people. But on a busy weekday, 6 million people rode the system, nearly 8 times the instantaneous capacity. But if everyone in New York decided to take a subway trip at the same time, the system would be overwhelmed. (It’s why serving outlying stadium events is logistically difficult.)
A note on EVs
Some people drove their electric vehicles to watch the eclipse, using up most of their range to travel 200 miles. On the way home, they attempted to recharge, only to find that there were very few chargers of any kind, and the fast ones were, let’s just say, oversubscribed. Now to be fair, the family described in the article probably would have just sat in traffic had they gotten recharged faster. But the experience shows the scalability of high energy density fuels (gasoline) versus lower-density batteries and has some corollary to the pitfalls of electrifying transit fleets and charging them centrally.
Most of the time, the low number of chargers in rural New England doesn’t matter. Most local drivers charge at home, other users don’t overwhelm infrastructure. And pumps don’t really function the same way as gas stations. Gas stations have almost limitless capacity with the energy stored on-site. Rural stations usually have a few pumps, which are rarely oversubscribed, and if they are the queue moves fast enough because fuel can be moved quickly. Gas pumps can run at up to 10 gallons per minute, so a Prius can get 500 miles of range in 50 seconds, while a less-efficient vehicle may take up to 2 or 3 minutes (plus a minute or two to begin and end the transaction. On average, it’s probably about 3 minutes per 500 miles, or 10,000 miles per pump hour. A small, rural gas station with four pumps could push our 40,000 miles of range over the course of an hour, and doubling the pumps to 8 (many are this size) could get 80,000 miles with minimal additional infrastructure. Over 10 hours, 8 pumps would probably run down much of the capacity of a gas station, but during that time it would service 2000 vehicles (as far as I can tell, no gas stations ran out of gas, even if anecdotally one we stopped at in Maine had their busiest day on record). Gas stations probably had to schedule additional tanker dropoffs after the eclipse, but other than that, there were no knock-on effects.
Meanwhile the fastest EV charger can run at about 250kW. This is a lot of power, and charging 100kW, enough for about 300 miles of range under ideal conditions, would only take about 24 minutes. But this is only a rate, with transaction time, of about 650 miles per charger per hour; to reach the capacity of an eight-pump gas station would require about 120 charging stations. Even if the stations were scalable, bringing enough power into the installation would be a challenge: this would require 30MW of power, enough power for a town of about 25,000 people. The cost to bring in that much power would be untenable for a once-in-a-lifetime event, which is why many EV drivers were stuck. In the long run, it would take a significant build out of electric infrastructure equal the scalability that gas stations already have. So EV drivers faced the queue before the queue, waiting hours to recharge.
Solar signals
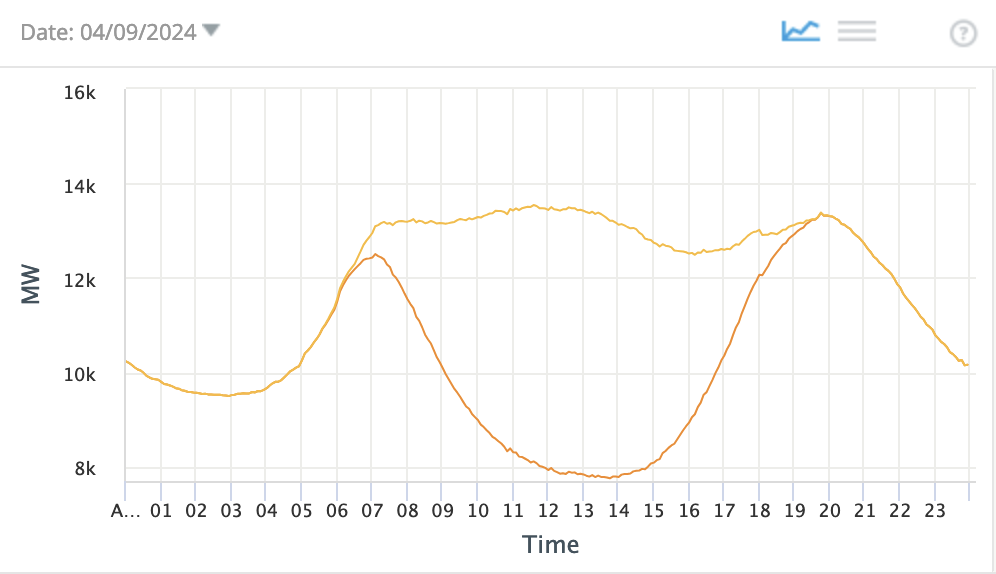
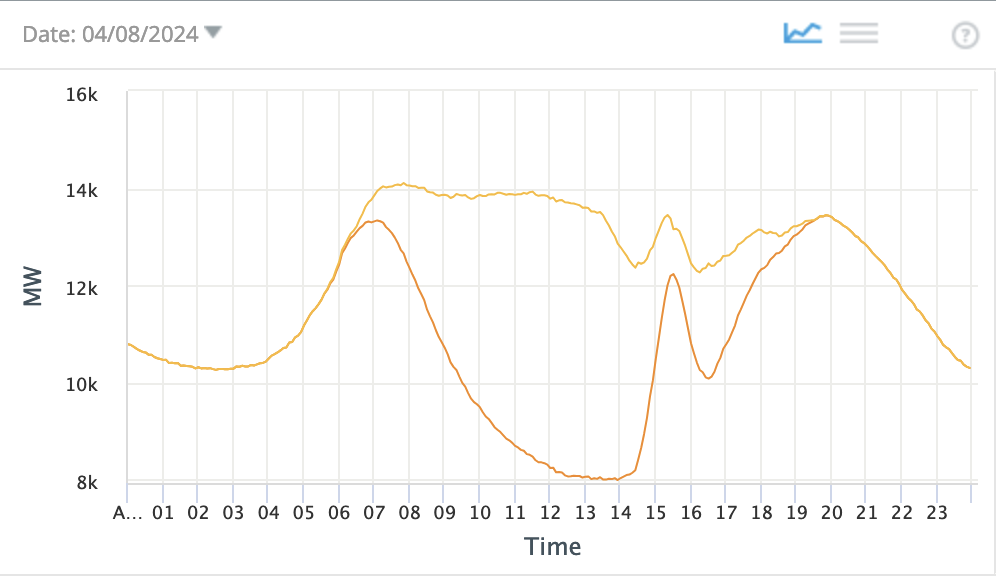
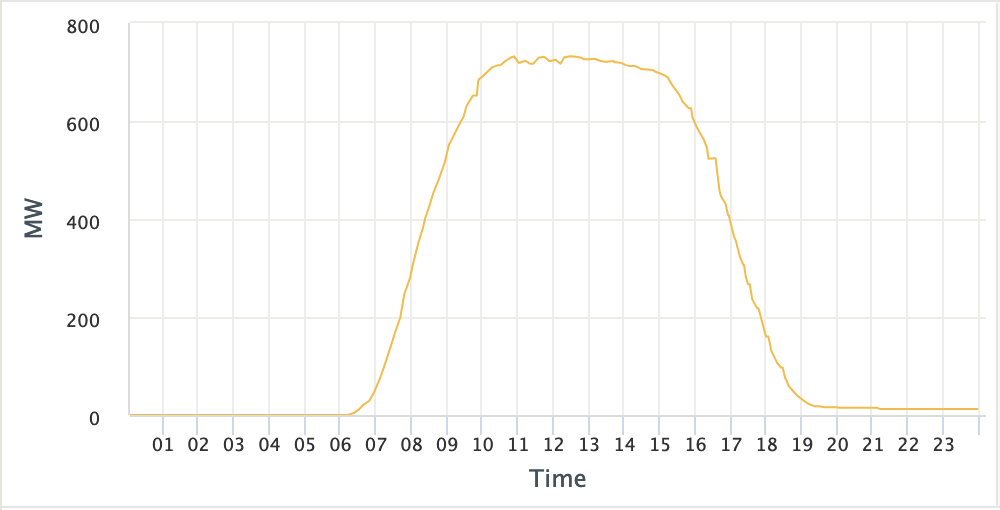
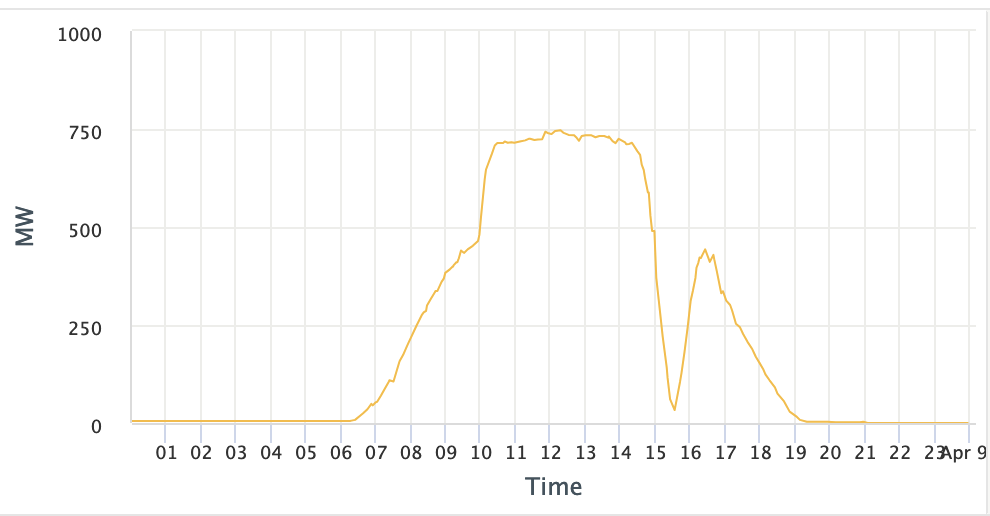
Staying in the realm of electricity, we can look at how the New England power market responded to the eclipse. On the left below is the demand for a normal, sunny spring day in New England, in this case, for the day after the eclipse. The orange line shows actual demand, the yellow line shows demand including behind-the-meter solar (mostly rooftop). This illustrates the “duck curve” well, with a huge dip in midday power generation need thanks to massive solar installation; at midday more than 6GW of the 14GW in the ISO were being generated by behind-the-meter (in addition to this, industrial-scale solar puts out another 700+ MW). On the right is the day of the eclipse: it paralleled a normal day but at eclipse time, there was only about 1.2 GW of behind-the-meter solar, about 1/4 of normal (this is estimated, actually may be even less). While totality only crossed a small swath of New England, most of the rest of the region was under 90% or more reduction in sunlight. Not visible to the naked eye, but certainly to a solar panel.
Here are charts of industrial-scale solar (the y-axes are different because the output from the ISO app is different based on other resources, sorry). Eclipse day was normal until about 2:30 when it went down to almost zero, before bouncing back for the rest of the afternoon.
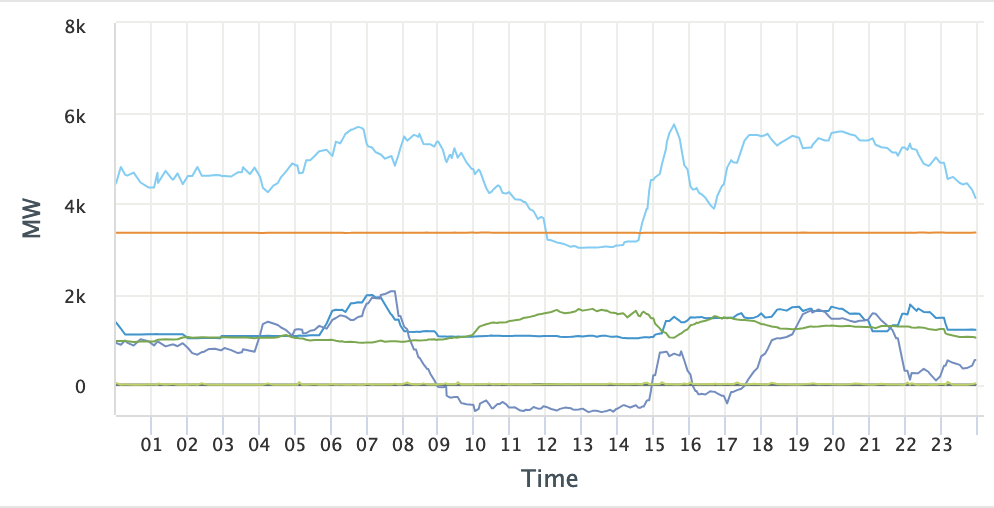
Finally, we can look at the electricity resources and real-time prices for eclipse day. For resources, you can see the spike in natural gas (the light blue line mostly at the top; the steady orange line is nuclear) and imports (the darker blue line at the bottom, which was negative most of the day since New England, with excess power, was mostly exporting). There was also an earlier bump in hydro than usual to account for the eclipse (hydro is the middle blue line, which was steady around 1GW since this was during the spring freshet and dams across the region were running high; by fall, run-of-river baseline hydro is below 300MW). Note a minimal change in renewables; the spikes in other resources were making up mostly for behind-the-meter solar, which doesn’t show up as much in the chart.
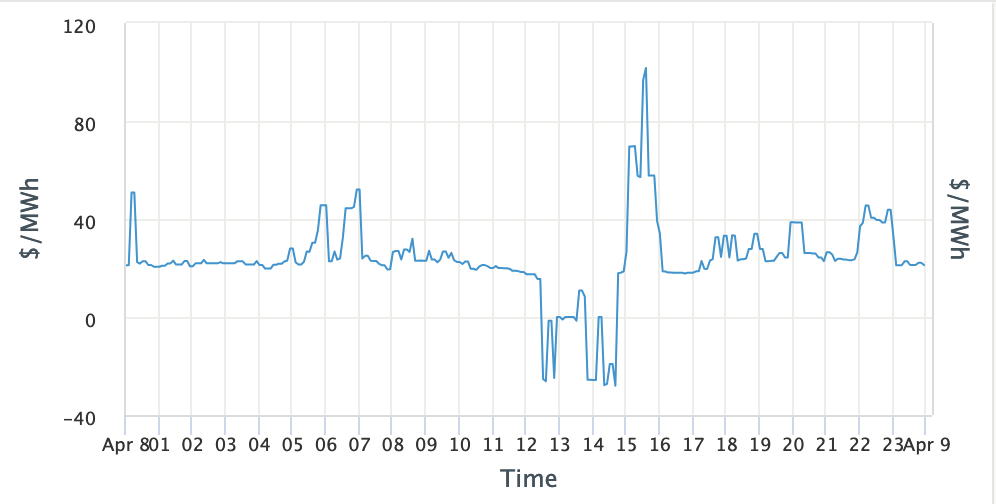
There was also a price hike. Prices during early afternoon were below $0, with lots of solar and wind the region needed to incentivize power to be cut back or exported to keep the system from overloading (this is somewhat typical on cool, breezy, sunny days in New England). Demand also dropped (which can be noted on the charts above) for the hour before and after the eclipse; people unplugged enough to reduce draw on the system when half of the region was staring at the sky. Once the eclipse shadow crossed, prices jumped up to incentivize more production, before falling back to more typical levels the rest of the day.
What did we learn?
If there’s a solar eclipse you can reasonably get to, go. But don’t make plans to fly to a specific location that may be cloudy. Be flexible. Avoid bottlenecks. Consider a longer route which avoids where everyone else is going (but don’t use the obvious backup route: Kinsman Notch was a mess, Route 25 was better, Dixville Notch was fine). Two lane highways have clear capacity constraints, and when a queuing system is over capacity, it takes along time for it to clear.
And there you have it, 5500 words about the great eclipse of 2024.

