NEW: Interactively explore these data (but still read the conclusions below).
In a word: yes. By looking at the spatial variation of taxi rides in 2014 vs 2013, we can see how these patterns have changed before and after MBTA service was introduced. Let’s go straight to maps:
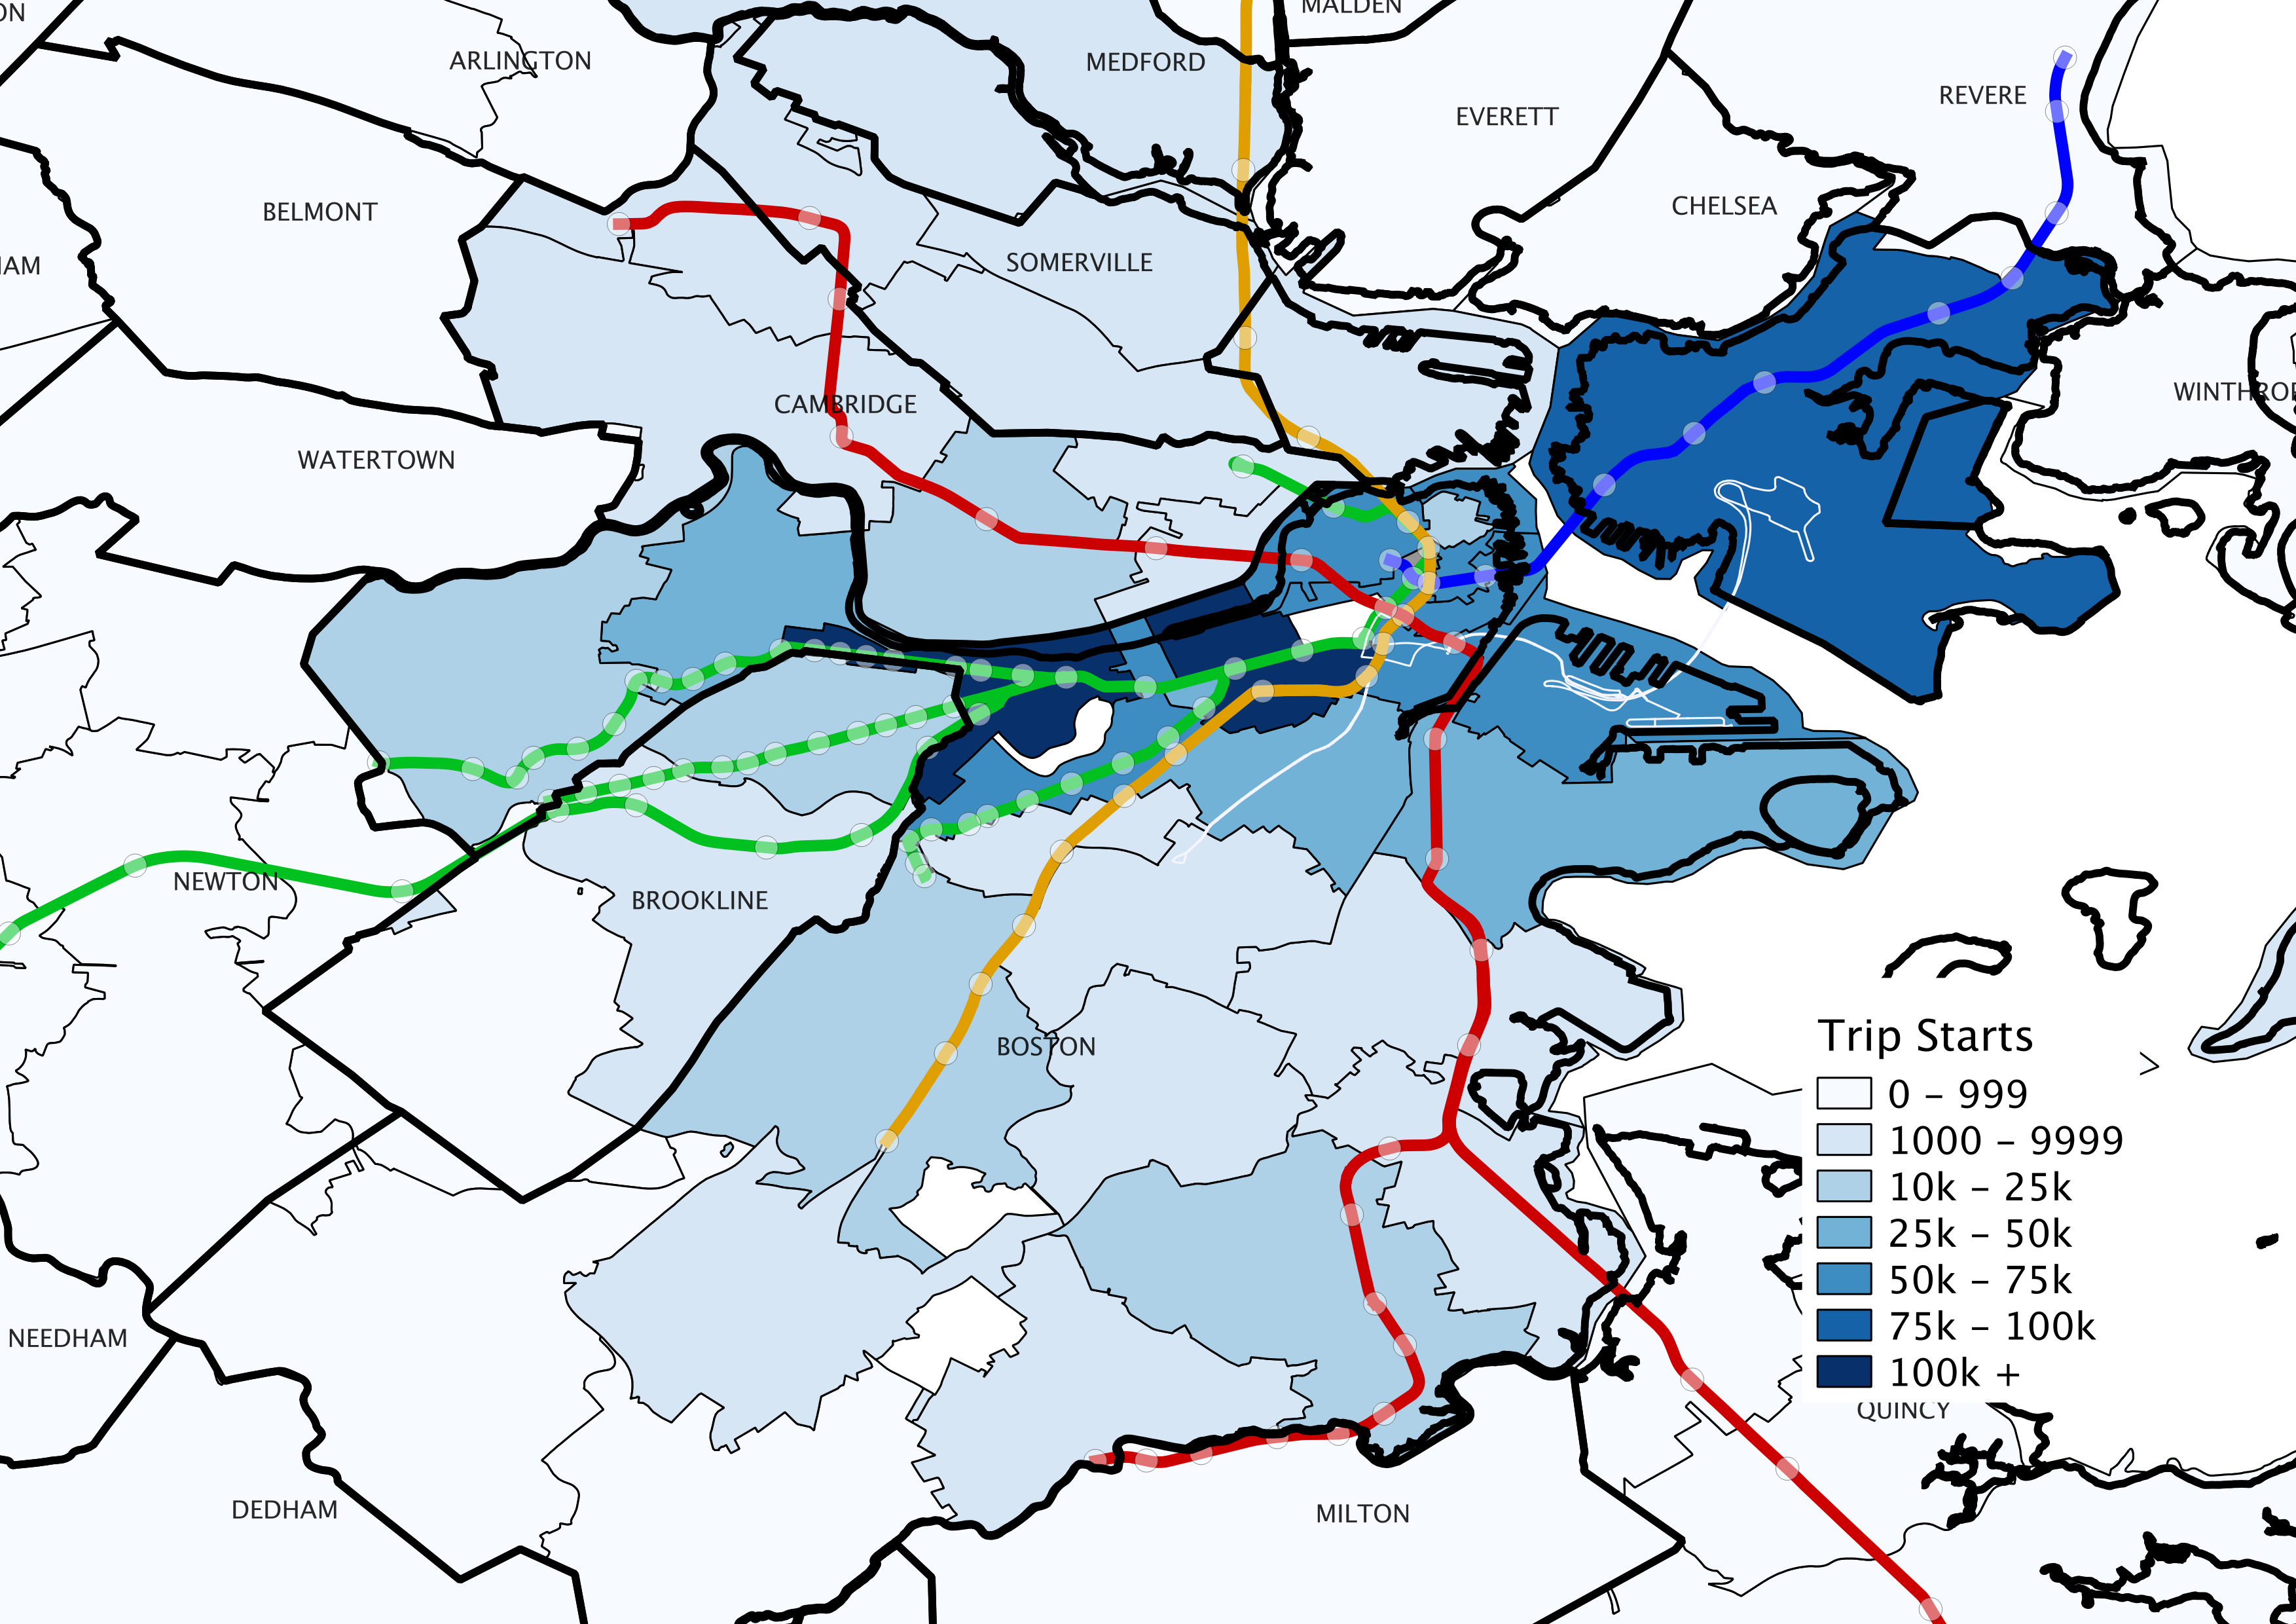
This map shows the total number of taxicab trip origins, by ZIP code. (NB: All of these data include Boston taxicabs only, and are roughly aggregated by GPS in to ZIP codes, which is how there is significant spillover in to other cities and towns.) We can see that most late night trips originate in the Allston-to-Downtown area and at the airport.
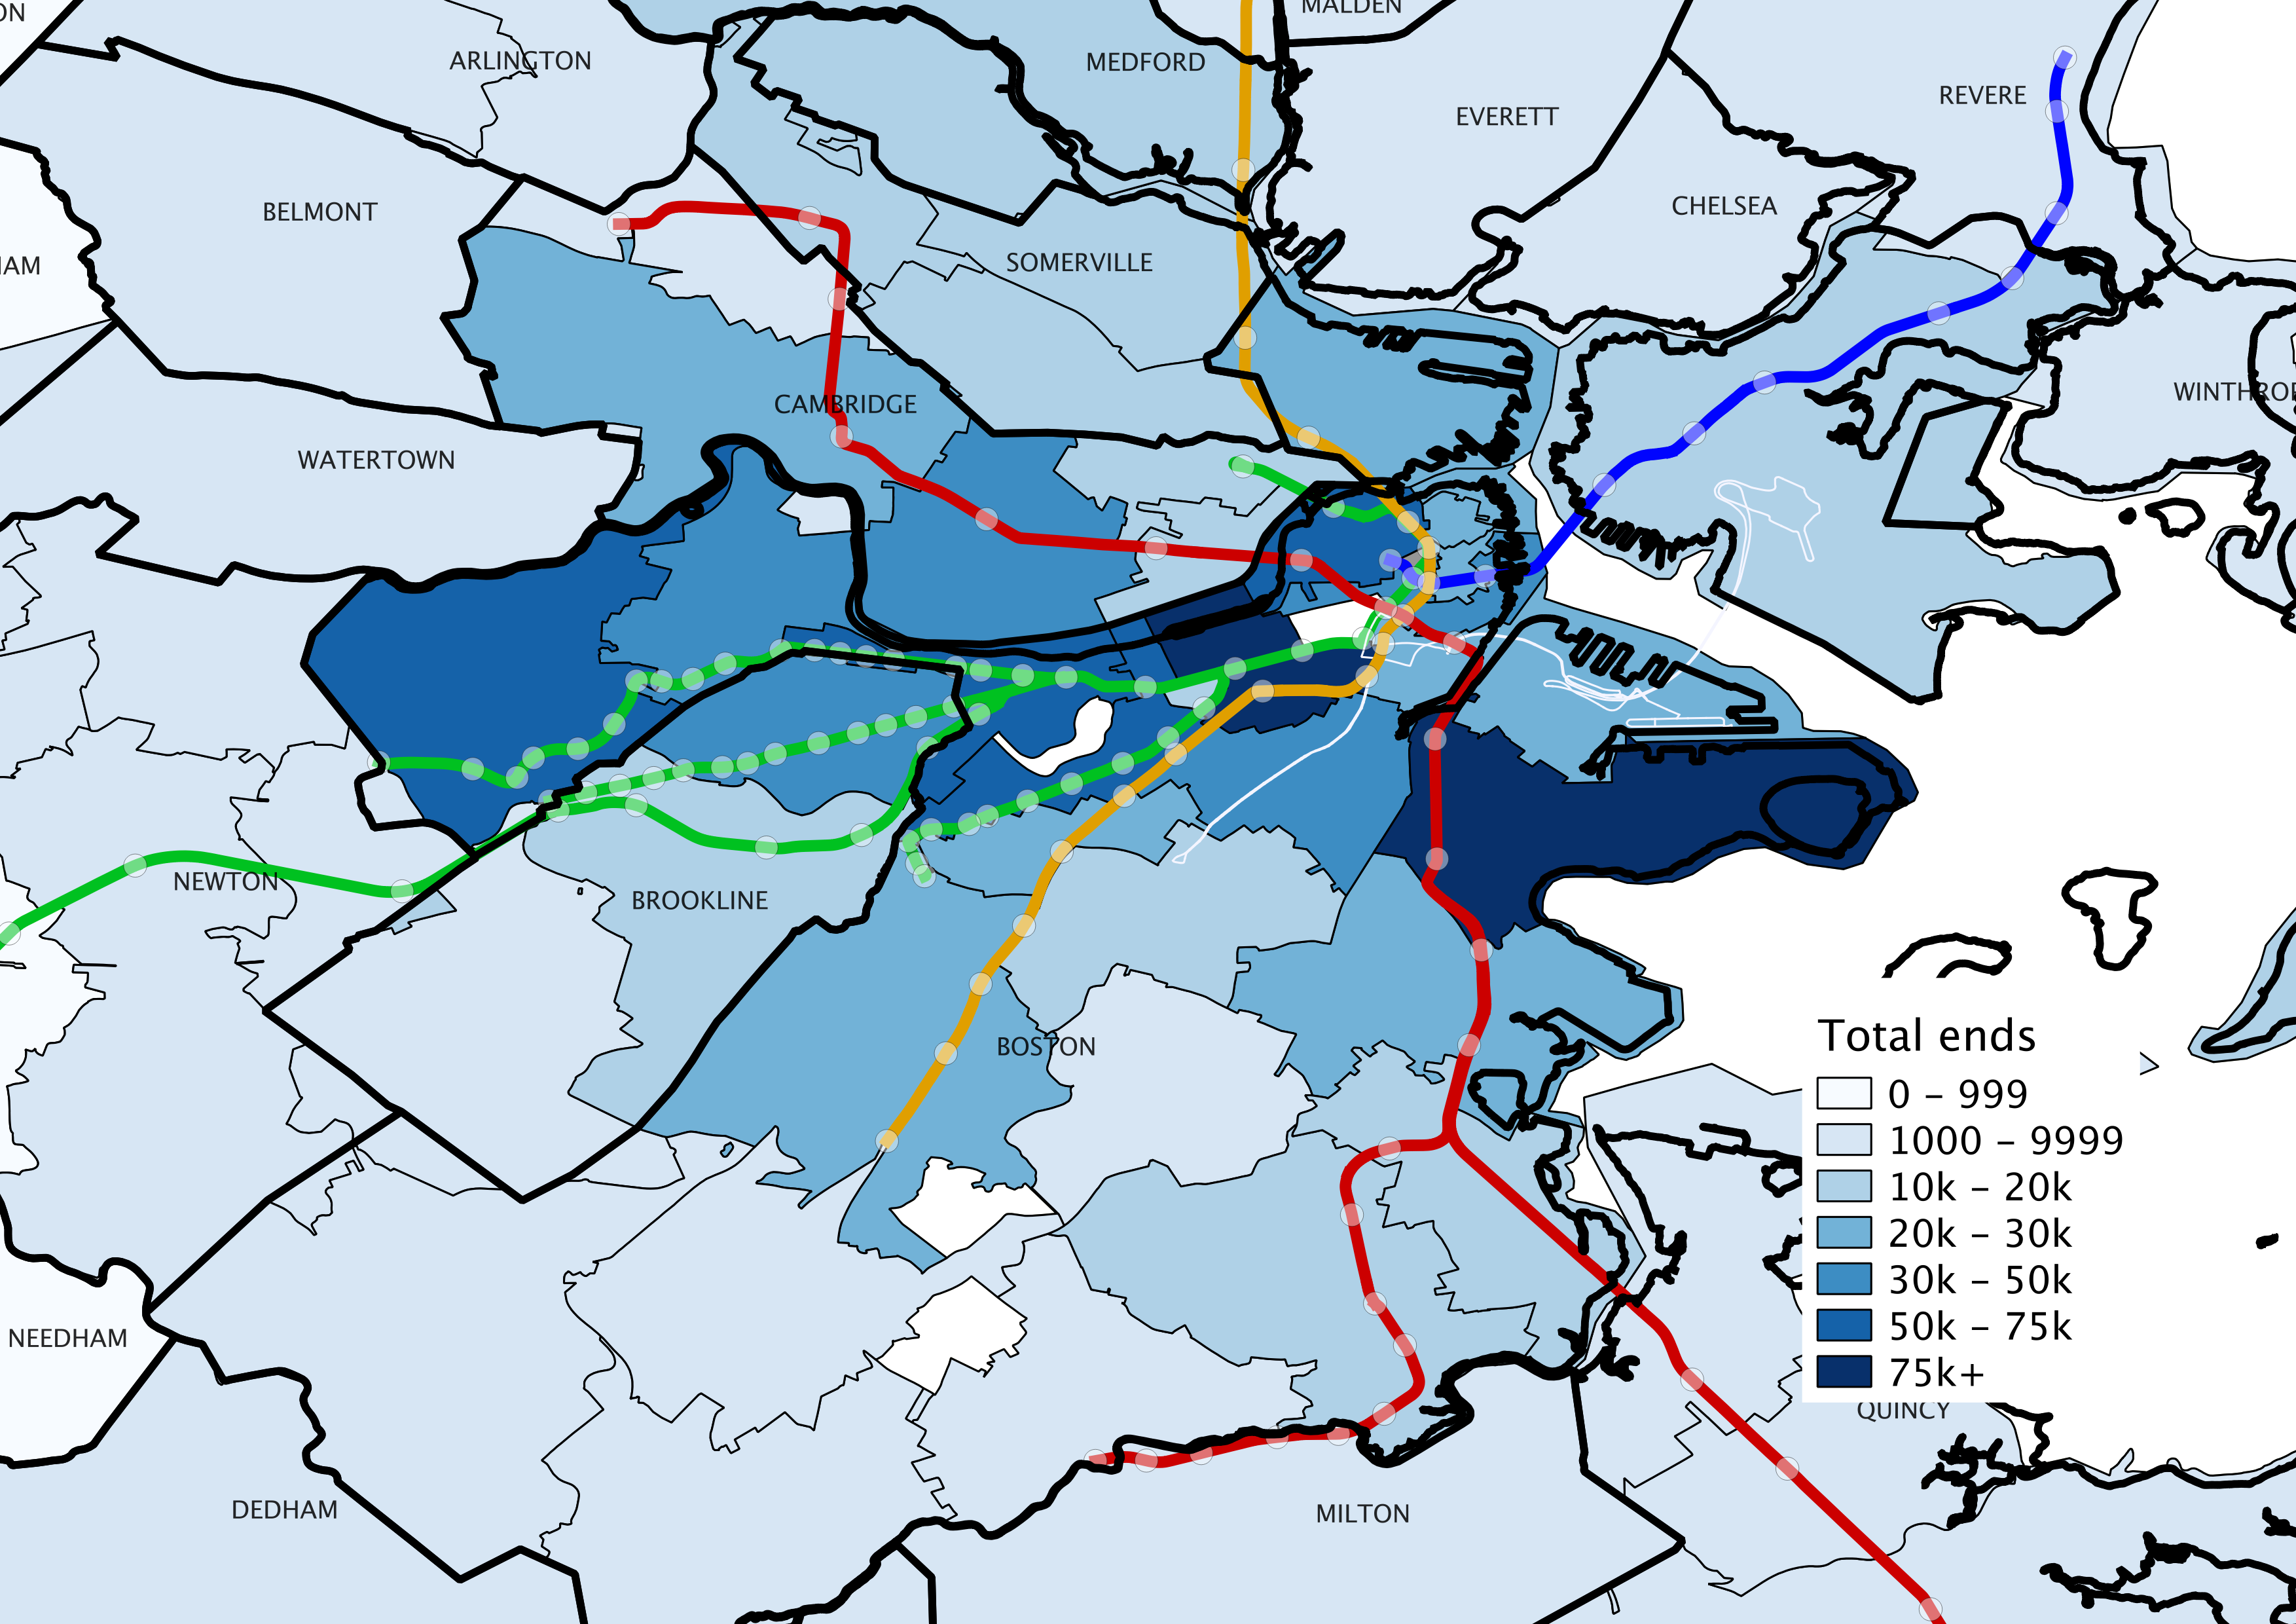
Taxi destinations are different. The highest destination areas stretch from Brighton to South Boston and in to more residential areas like Charlestown, Jamaica Plain, Brookline and Cambridge. Note that there are many fewer drop-offs in East Boston than pick-ups thanks to the airport receiving very few passengers late at night.
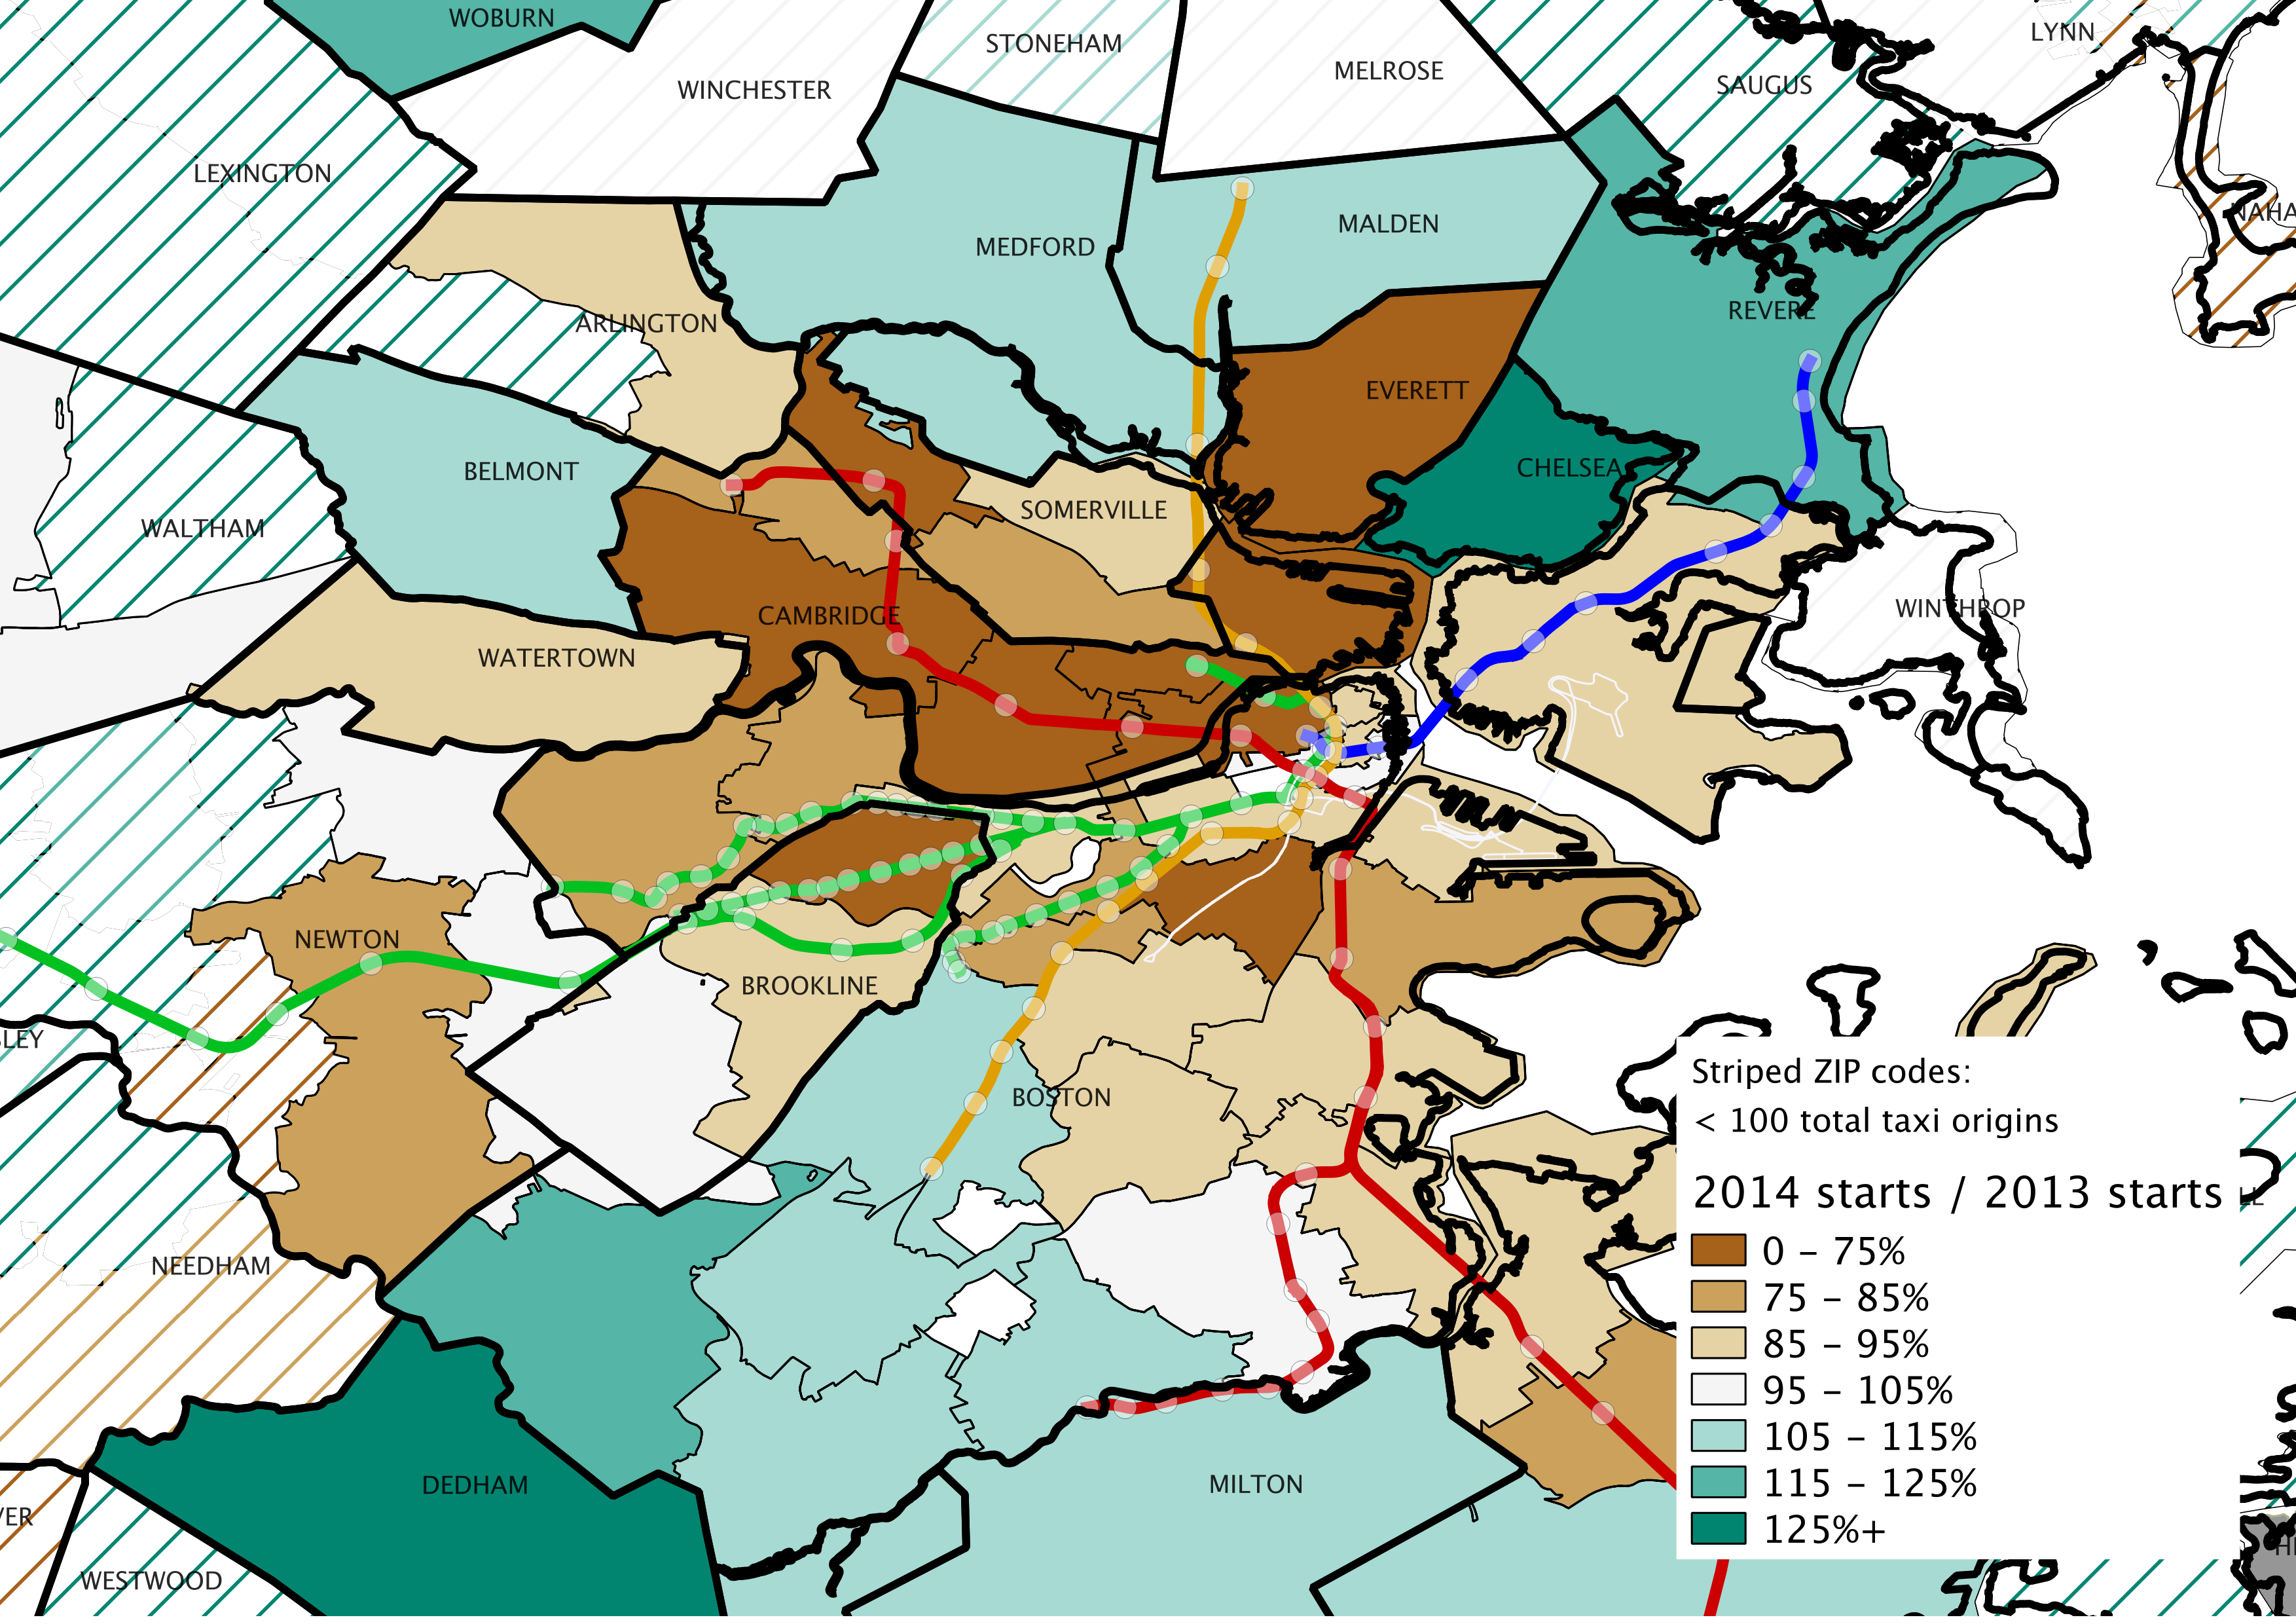
This map shows the change in trips from 2013 to 2014. Brown is a decrease, and green is an increase. Any areas with stripes had fewer than 100 rides and the data there was unreliable (it’s probably unreliable in Cambridge, too, but we kept it for now; there are certainly some less-than-scrupulous cabbies who pick up street hails outside of the city limits—we can have the long discussion about how we should have a regional taxi medallion system another time). In any case, note that the most heavily-trafficked pickup areas—just south of the Charles—see only minor declines.
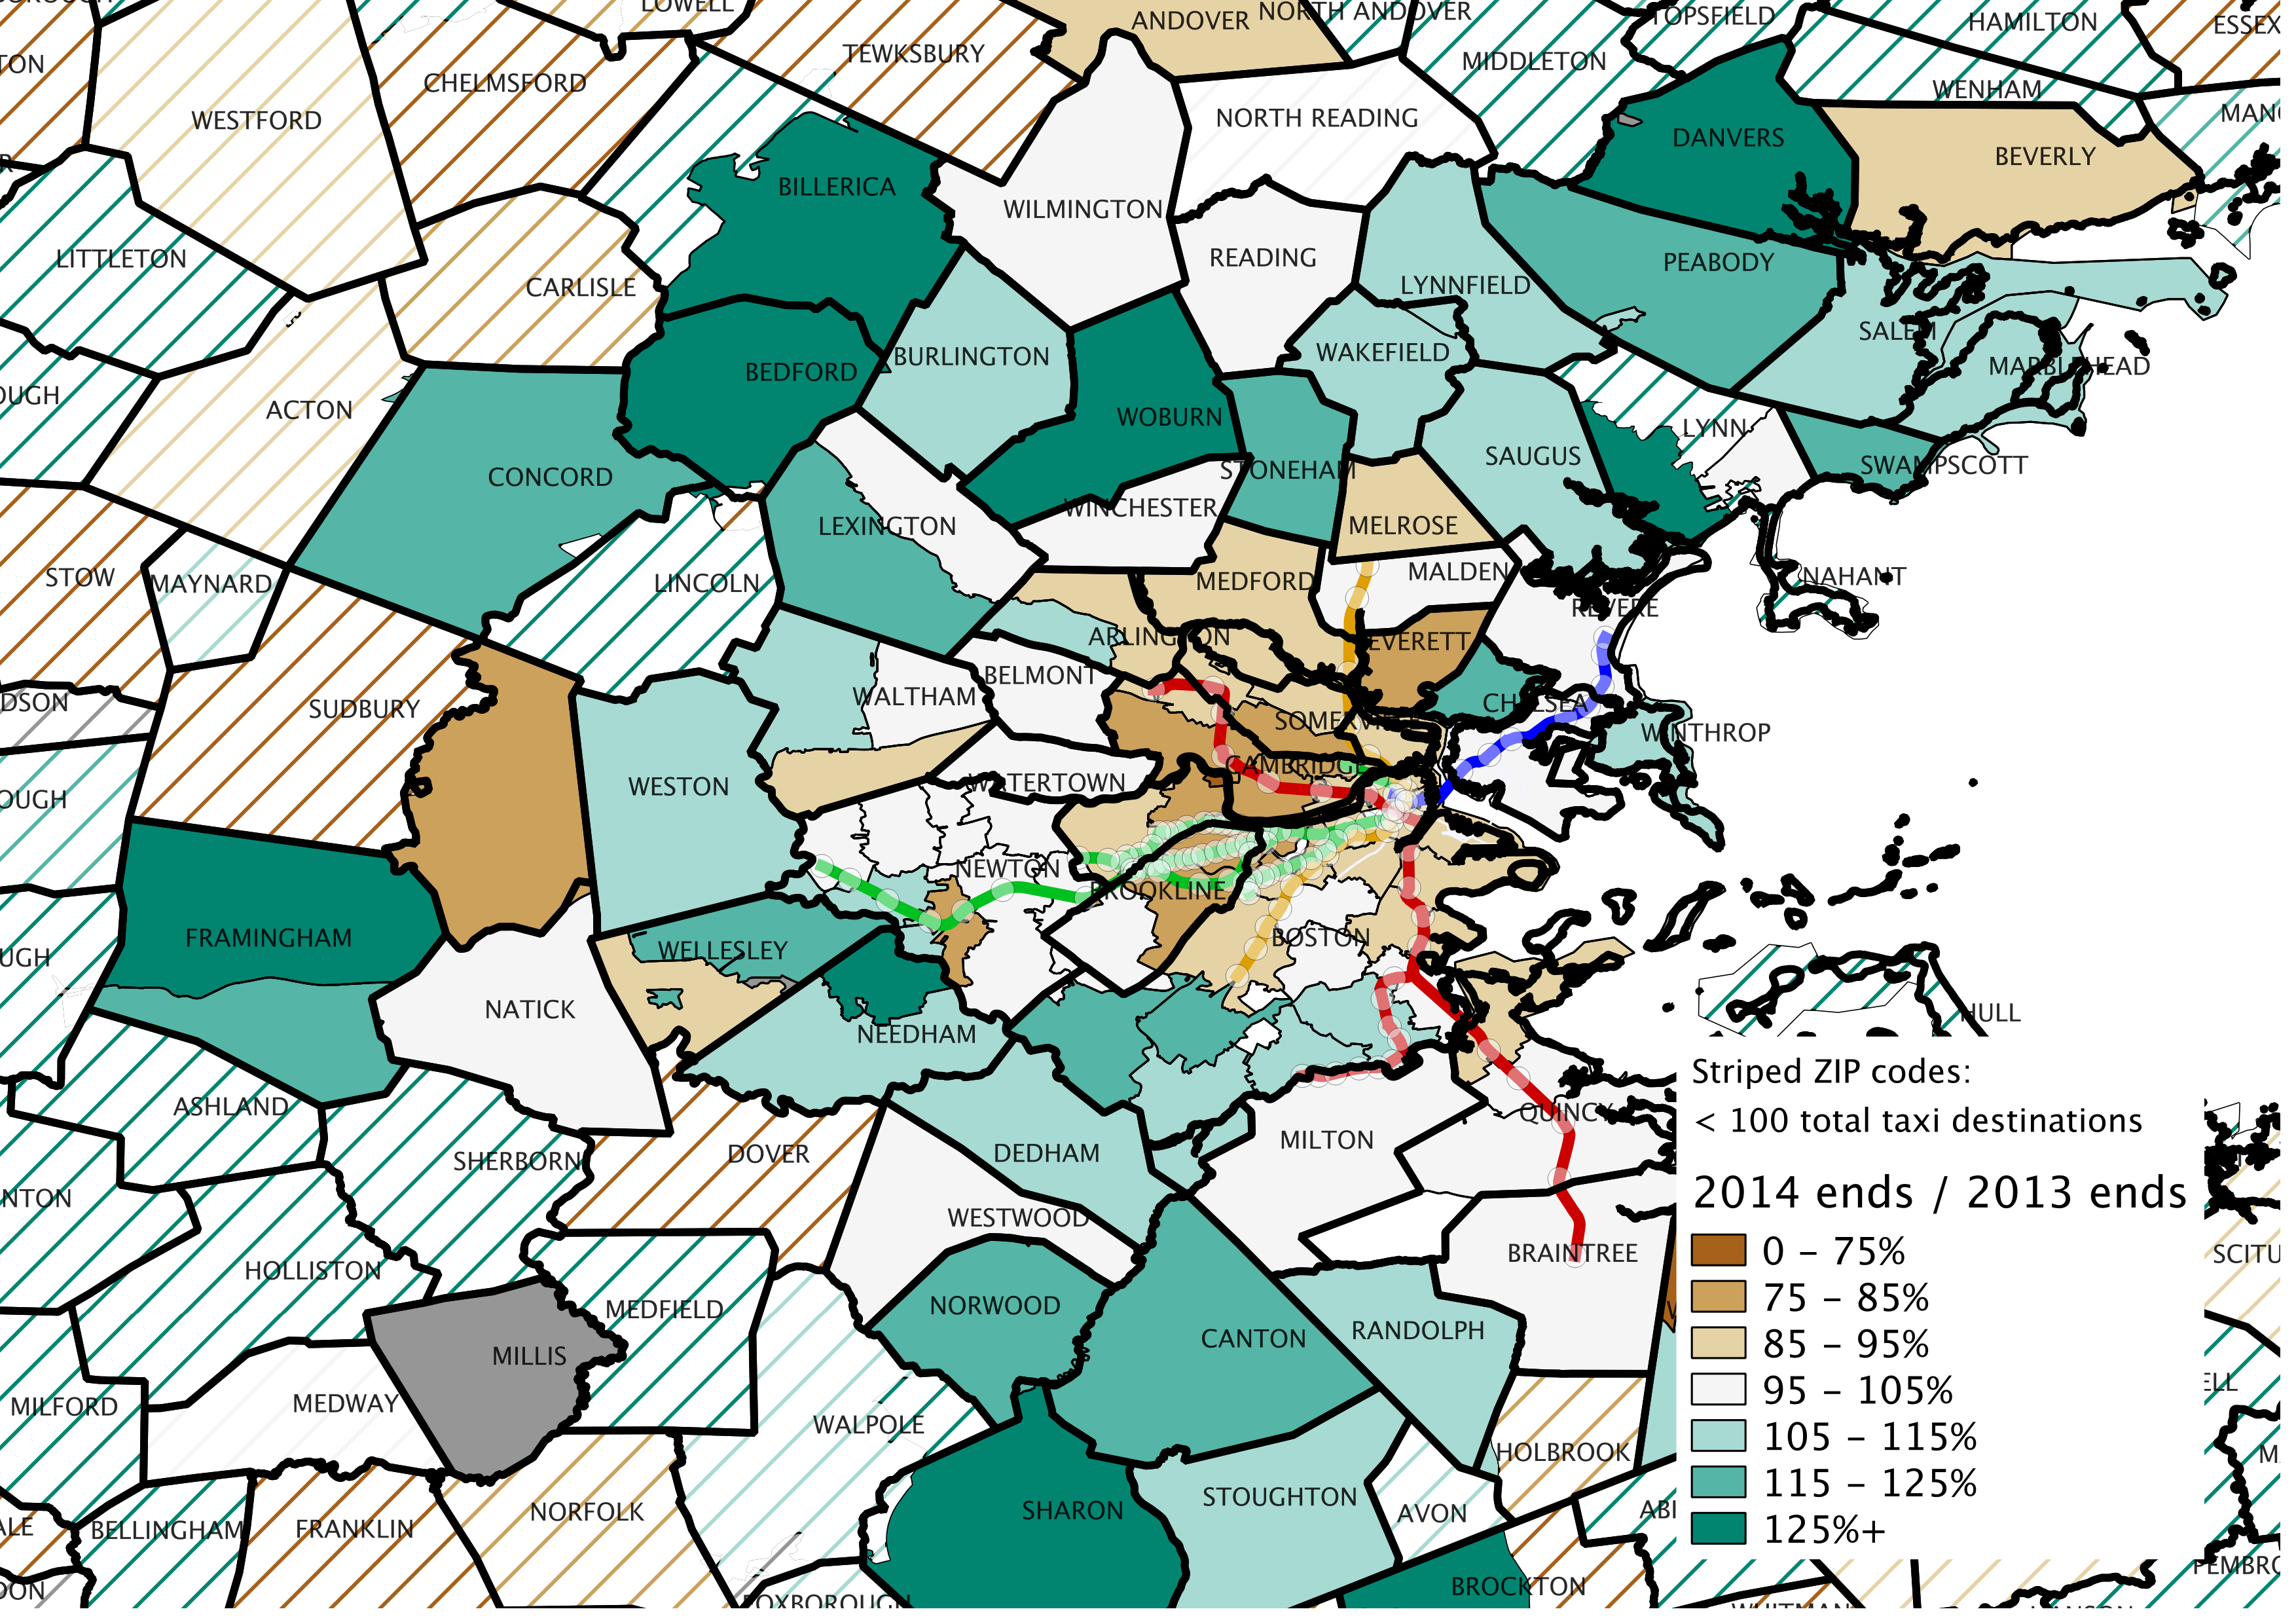
Here’s where the data get very interesting: the relative change in taxicab destinations from 2013 to 2014. It appears there are concentric rings around downtown Boston. In areas served by the MBTA rapid transit services, there is a decline in taxicab trips. In areas beyond there, however, there are increases. While the data are not complete and we certainly have not run any statistical analyses, we can make some inferences from the spatial extent of these data (obvious caveat: correlation ≠ causation). It would seem that where late night MBTA service exists, taxicab trips have decreased on the order of 20% (or so). This is likely due to more patrons taking the MBTA. However, in areas not served by the T, there are increases in taxi use (albeit fewer rides overall). We could take a guess and say that these are people who are drawn to nightlife downtown by the presence of friends who are staying out longer (and taking the T home) and who take taxicabs home themselves. If true, these data strongly support late night T service, as it benefits pretty much everyone involved:
- The MBTA has more ridership which comes in to the city via normal routes (if they are taking cabs home, we can assume many ride non-late-night bus routes or commuter rail lines in)
- Taxicabs have fewer trips, but the average trip is longer (and, thus, more lucrative for the taxi driver).
- Businesses have more patronage overall.
- Late night MBTA service drives demand for more nightlife for people who live within the late night service area and people who live outside of it, and money spent on the service is a catalyst for the local economy, and serves the goal of making Boston more of a 24-hour city.
With a longer-term data set, these data could be statistically explored; we hope that this will occur in the future.