No!
We ranked all MBTA bus lines, surface lines (Silver Line, trolley lines) and rapid transit stations by ridership, both average weekday ridership (from the 2014 Blue Book) and late night (after midnight) ridership. Here’s what we found. The map below shows these stations, surface lines and late night routes, and how their rank changes from weekday ridership to the late night (red: higher rank on weekdays, blue: higher rank late night; rapid transit lines are ranked by stations and show up as white except for surface-running segments [Green Line branches, Silver Line, Ashmont-Mattapan Trolley]):
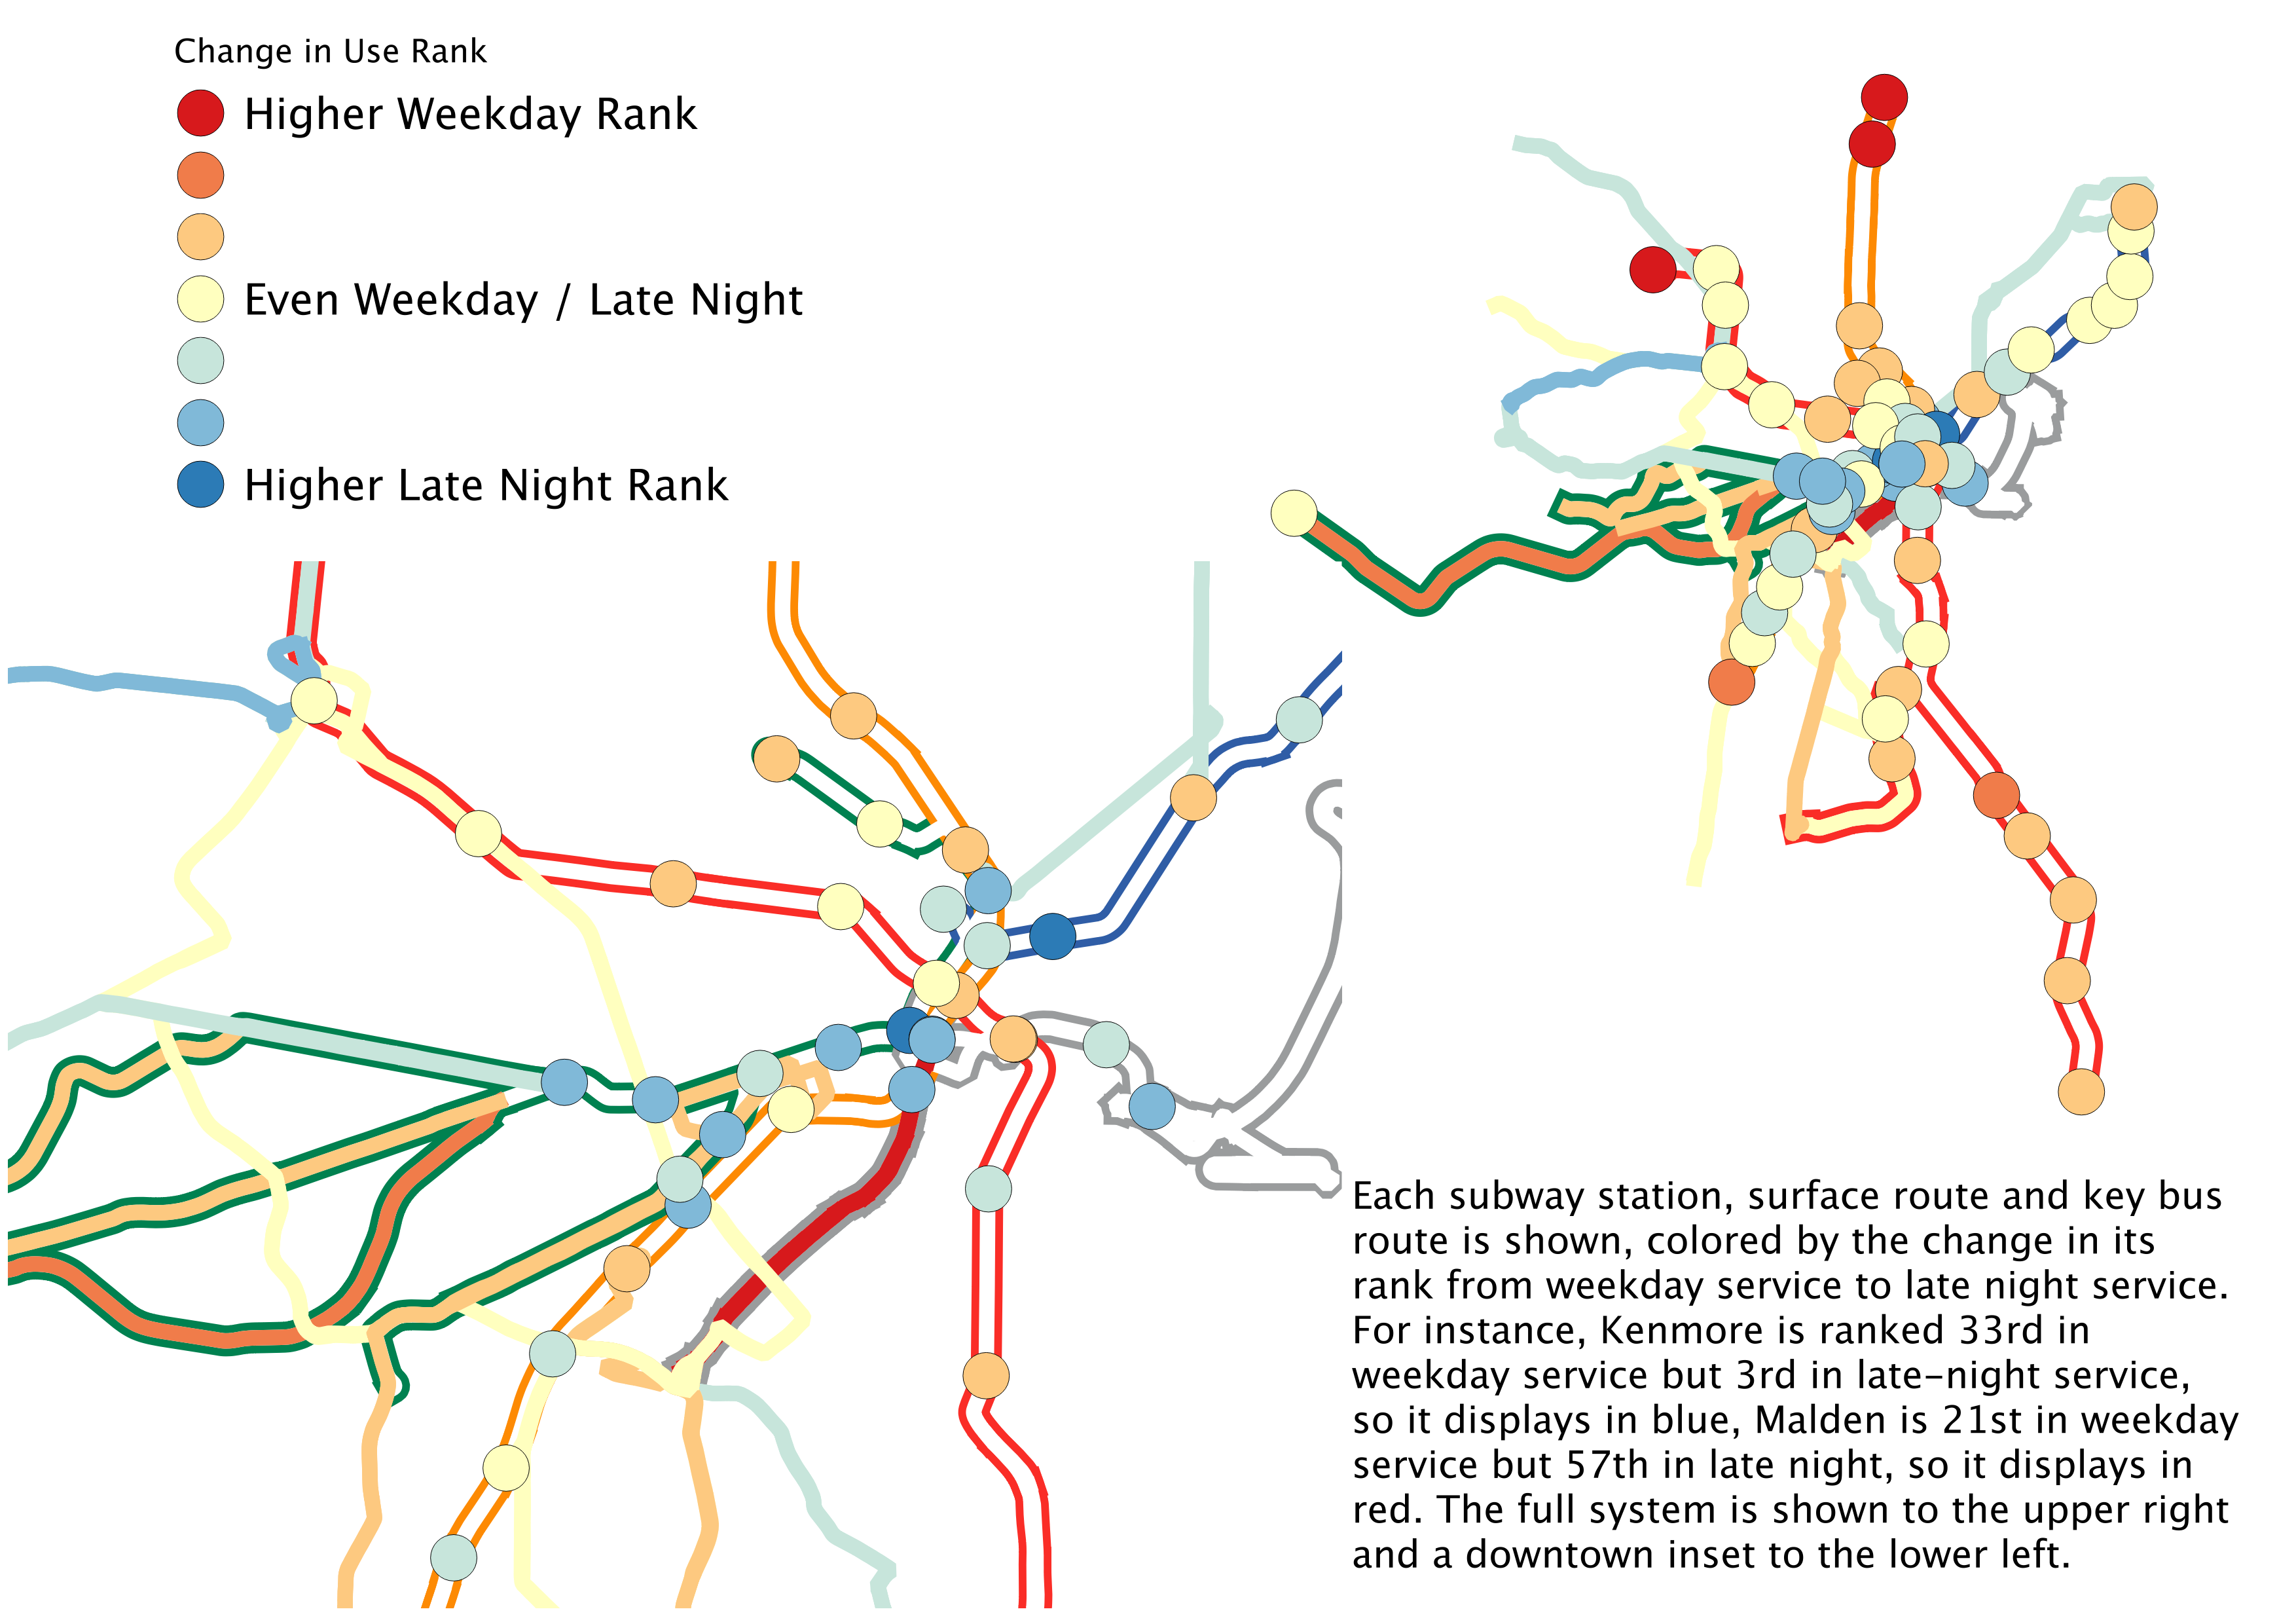
(Note: rapid transit lines are shown with stations, but no overall line color. The SL1 and SL2 are not shown due to variances in data collection and fare control.)
Why rankings? We want to show the relative changes, and while the two data sets have similar numerical ranges, they are distinct data. It also allows us to more evenly compare stations and lines with of different sizes. Using absolute data in this case would paint a murkier picture. For instance, Harvard is the second most used station in the late night, and fourth in weekday ridership, but has 5000 fewer total late night riders than average weekday riders. Park, on the other hand, increases by 8000 riders, but only moves up five places. The larger numbers at this end of the scale would cause these to be skewed, when what we really want to show is that both are popular both on weekdays and in the late night.
Here are the top 10 stations and surface lines by daily ridership:
B Line surface
South Station
Downtown Crossing
Harvard
D Line surface
Park Street
Back Bay
North Station
Central Square
SL5 Washington St
These are followed by Kendall, Forest Hills, the 39 and 28 buses, Copley, the 66, State, the 1, Davis, the E Line, Malden, the 23, the C Line and the 111 to round out the top 25. Usual suspects. Commuter routes. Major transfer stations near the top.
Here’s the top 10 for late night:
Park Street
Harvard
Kenmore
State
Central Square
Haymarket
Copley Square
Back Bay
Boylston
Hynes
and I’ll add 11 and 12:
South Station
Aquarium
Wow, okay, that’s different. More representation from the Red and Green Lines, but some major shifts.
Several routes fall dramatically. South Station—a major commuter transfer hub—falls from 2nd to 11th. The B Line—since this data only shows boardings on the surface, of which there are relatively few late at night—goes from first to 14th. Downtown Crossing falls from 3rd to 13th, and the D Line goes from 5th to 26th; not a lot of Newtonites are boarding the train in to the city in the wee hours.
There’s even more dramatic movement up in the ranks. Copley goes from 15th to 7th. Kenmore from 33th to 3rd! And the big movers are further down. Boylston, in 9th place during late night, rises from 45th. And Aquarium? On a weekday, ridership at Aquarium is right between Quincy Adams and Roxbury Crossing: 65th overall. After midnight? 12th.
There are explanations, I think, for all of this. Most of the locations on this list are near centers of nightlife: Harvard and Central in Cambridge, and the whole of the Green Line between Park and Kenmore, including Back Bay. There’s a nice swath of blue dots from the Theater District through Back Bay to Kenmore. And major transfer stations fall (they start so high that they can’t go anywhere but down) except for Park, which serves the Red and Green lines, the two busiest late night lines, so Park is the busiest late night station (rising from sixth, so maybe it isn’t the busy Boston center, as Tom Lehrer put it).
But what of State and Aquarium? Ridership at these stations, I think, has to do with frequency and the Government Center closure. In normal times, if you were at Boylston and wanted to go to East Boston, you’d get on the Green Line, assume a train would soon take you to Government Center (even late at night, the Green Line trains come every five minutes or so) where you’d make the transfer. Even with Government Center closed, you’d wander over to the Orange Line (every 5 minutes at rush hour) and take it to State. Now? The Orange Line only runs every 15 minutes late at night to State. So it’s worth hoofing it to the Blue Line and boarding there.
And Aquarium? Well, if you just had dinner in the North End or caught a show or a club in the Theater District, you might wander downhill to the harbor, and find your way to Aquarium. If you compare total late night ridership (the data was from late march to late June) to average weekday ridership, Aquarium has by far the highest ratio. Still, this number seems high.
Here are the 83 Rapid Transit stations, Surface Lines and Key Bus Routes, plotted by their average weekday ridership and total late night ridership. The second chart is an inset of the first bounded by 7000 late night rides and 15,000 weekday ridership for clarity:
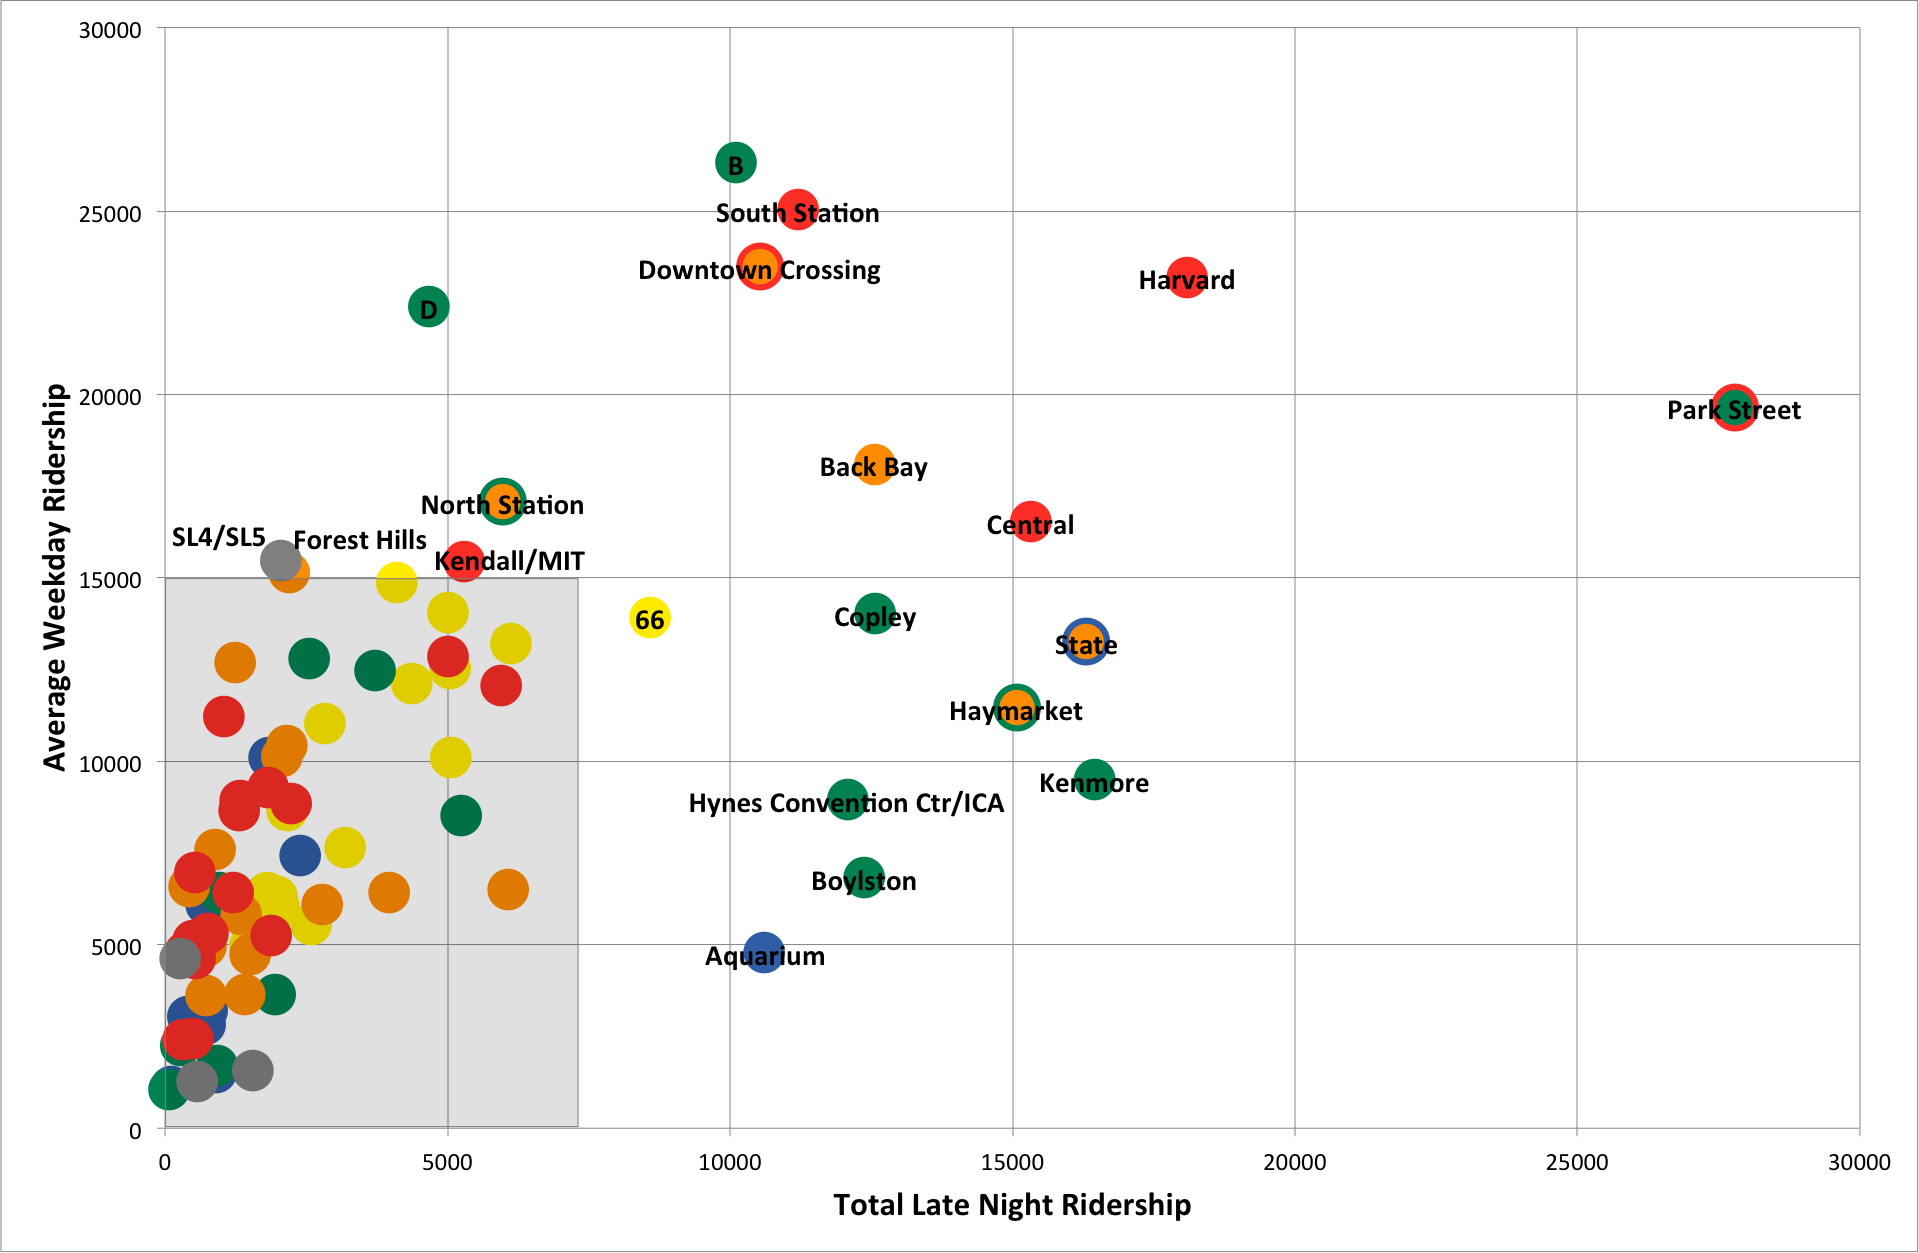
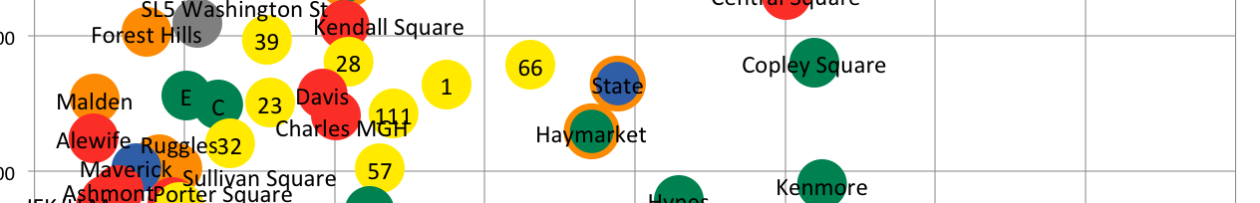
The gray rectangle was too complex to label, but a zoomed-in inset is shown below (scaled differently):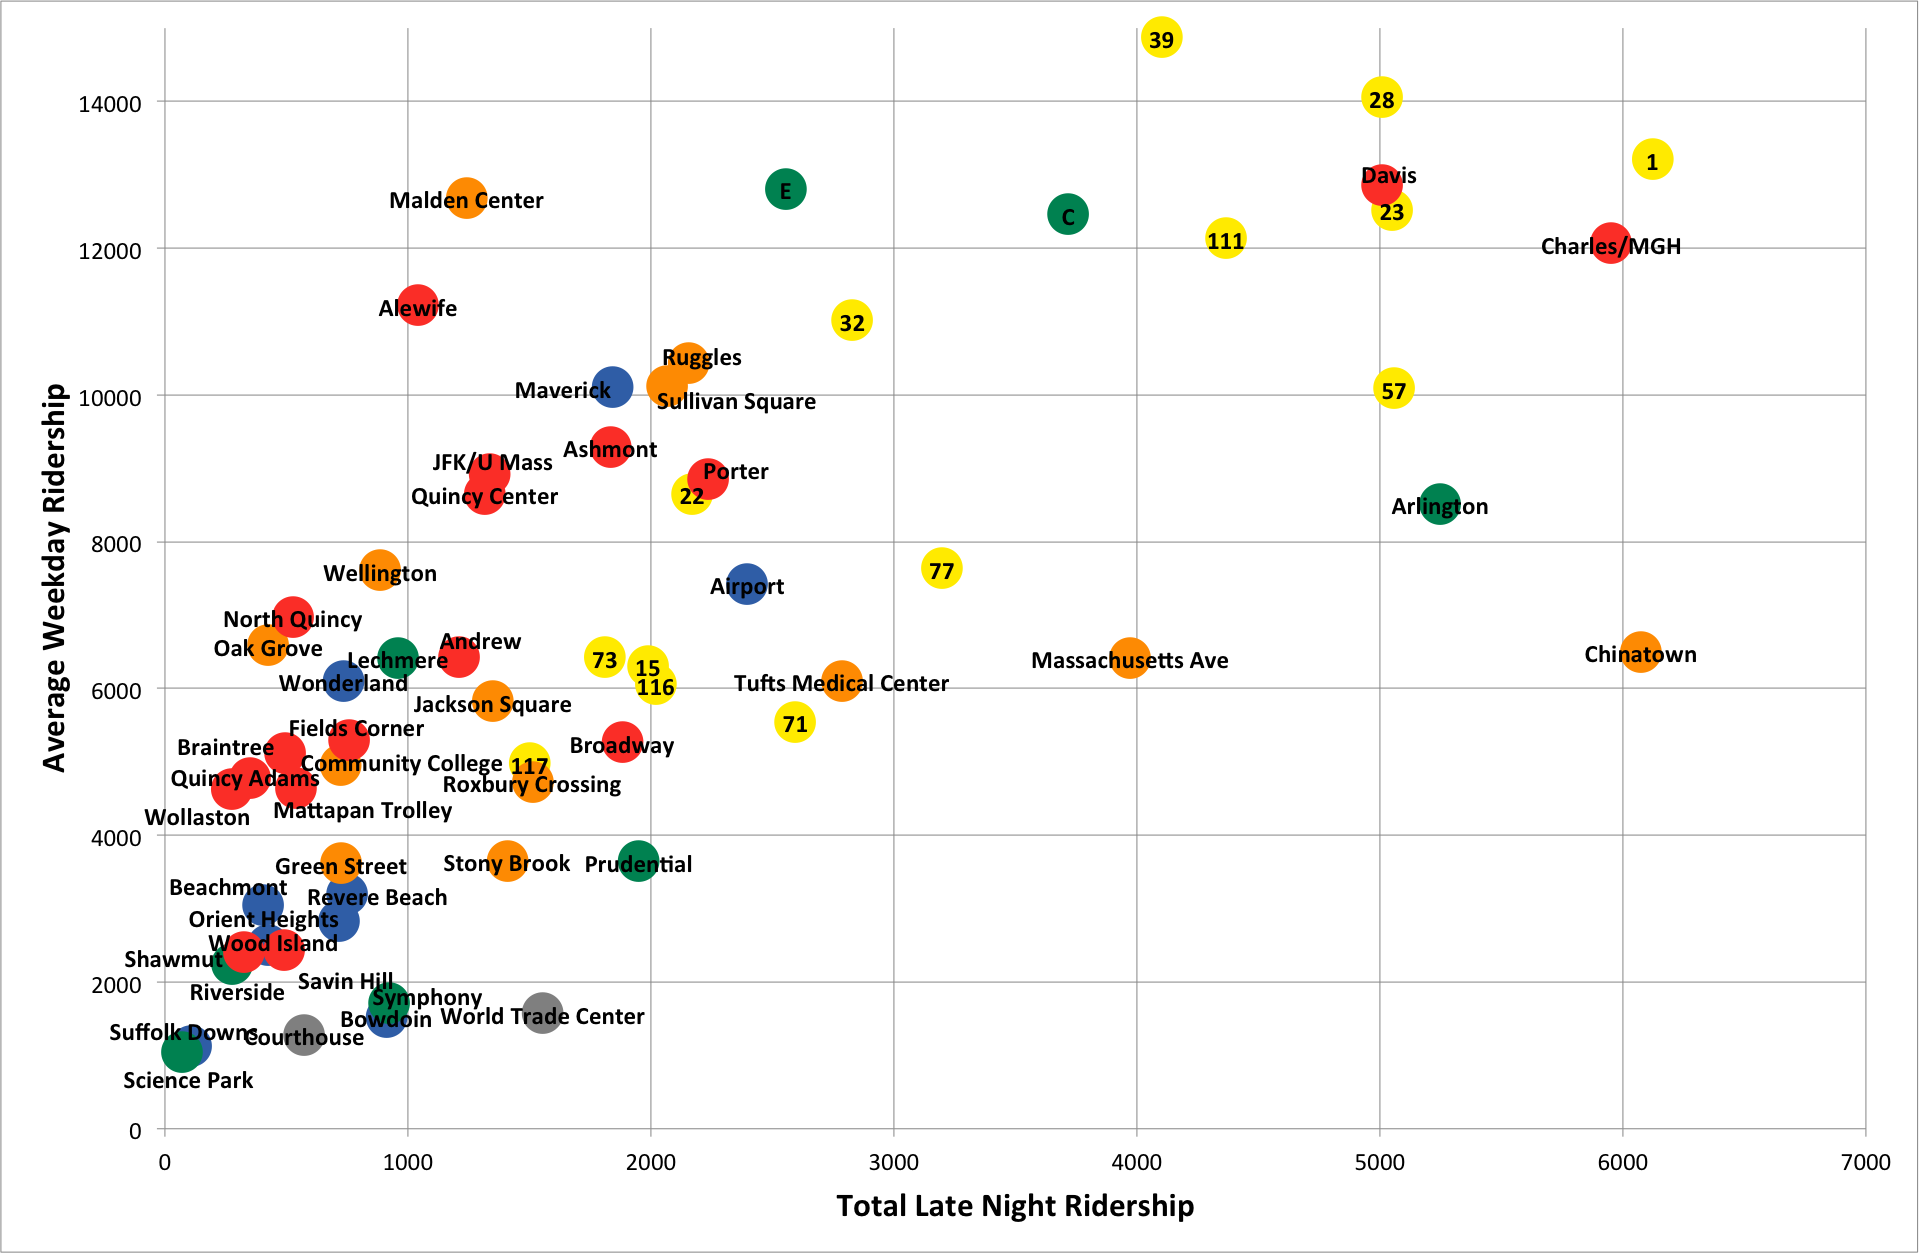
Basically, points clustered towards the Y axis have relatively more ridership during regular operating hours, and those closer to the X axis see relatively more ridership late at night. So it makes sense that outlying stations, especially those built near parking garages, are in the former category. And locations near nightlife destinations are in the latter.
Want more? Because Excel and Google Docs are braindead in their own special ways, here’s a Google Docs chart showing the same data, but different and interactive. Okay, it turns out Google Docs is so braindead that it won’t allow for charts to be published. Snakes. So much for that, then.