Transport Report: June 2011 << Previous month — Next month >>
Every day this year, I've recorded how far I travel, and by what mode, in a nifty Google Doc.
Notes forthcoming.
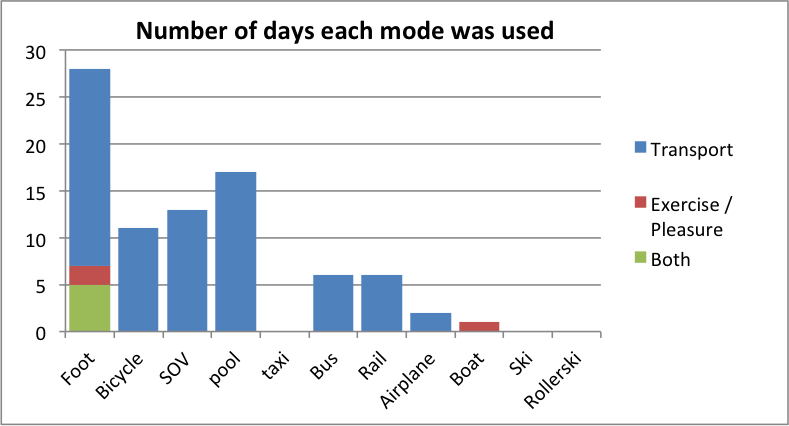
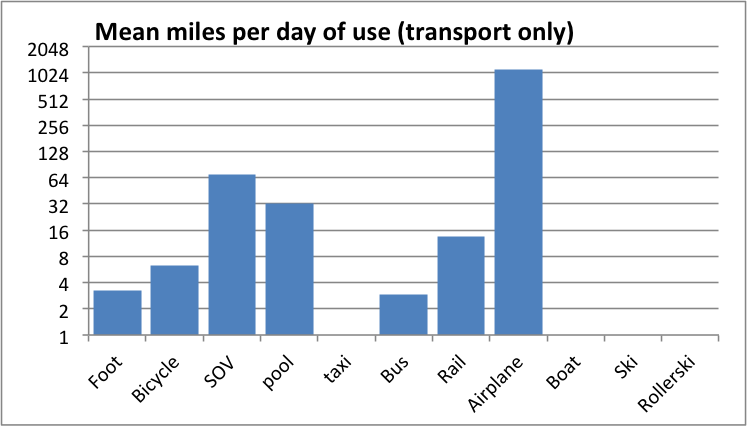
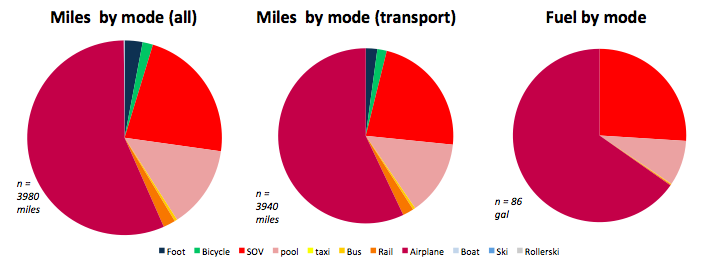
Here's the data, broken out in to charts:
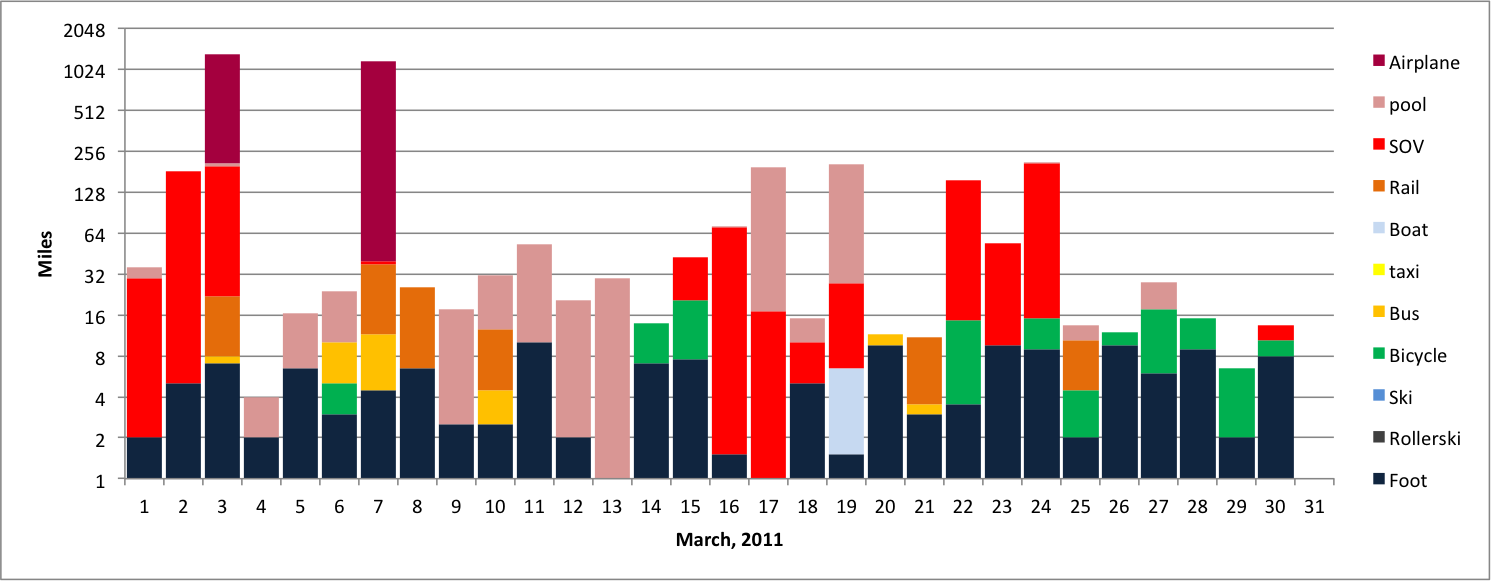
Miles per day by mode. Log scale, base 2 (to get more lines). NB that all data starts at one; there is no way to display zero values in a log scale, so 1 null mile is added to each day to display the graph correctly.


Quick notes:
Coming soon.
<< Previous month — Next month >>
© 2011, Ari Ofsevit